
A triple bottom is a chart pattern where price falls to roughly the same low three times, bounces each time, and then closes above the highest point between those lows. We scanned eight years of daily forex data to see how it really behaves. This guide settles three questions: how to spot one, how the target is measured, and what happened after 77 real patterns on 23 currency pairs.
What a triple bottom is
A triple bottom has three parts. First, there are three swing lows at about the same price. Next, there are two rallies between them. The highest point of those rallies is the neckline. The pattern only counts as complete when a candle closes above that neckline.
Until then, it is just a range with a floor. In short, three touches tell you that buyers showed up three times, not that the trend has turned.
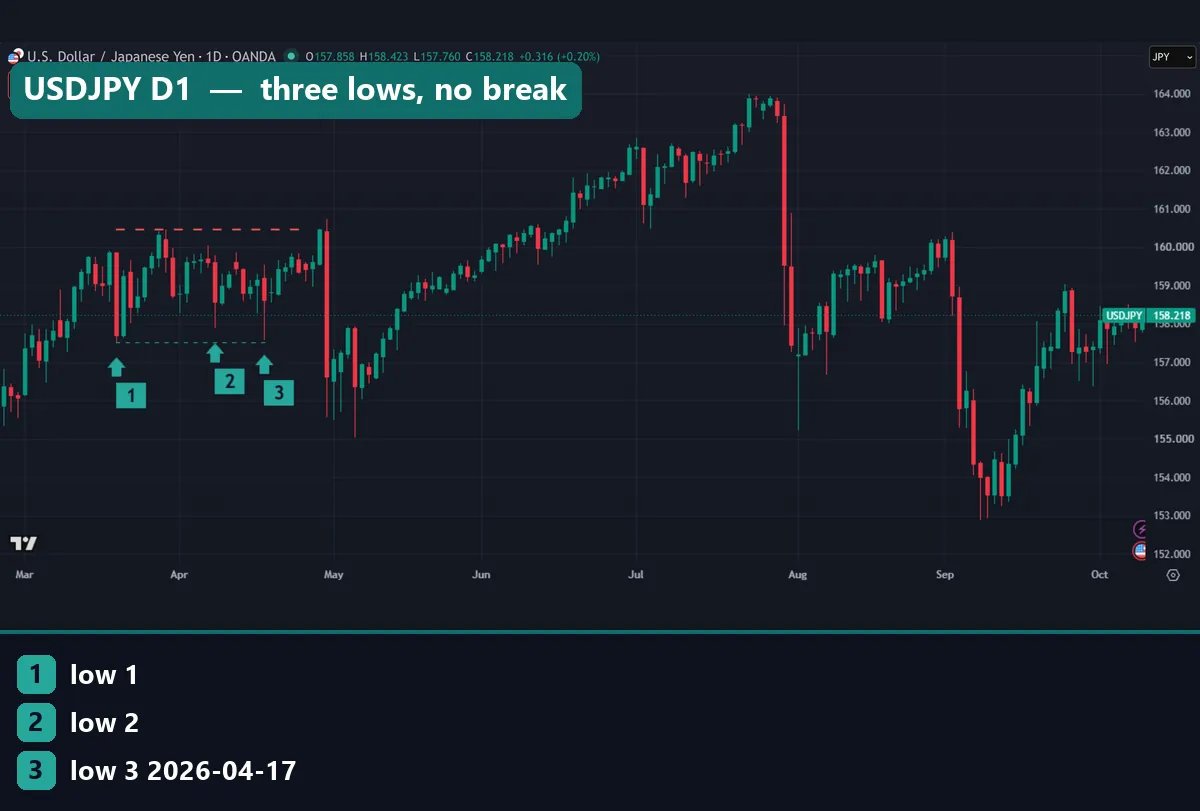
The chart above shows a clean shape on the USDJPY daily chart. The three lows printed at 157.51 on 19 March 2026, 157.888 on 8 April and 157.59 on 17 April. The red dashed line is the neckline at 160.464. However, price did not close above it within our 30-day window. Instead, it traded below 156 in early May.
The triple bottom is a close cousin of the double bottom pattern, with one extra test of the low. It is also related to the inverse head and shoulders. There, the middle low sits deeper; in a triple bottom, all three sit close together.
How it works: lows, neckline and target
The logic is simple. Sellers push price down to a level three times. Each time, buyers absorb the selling and lift price again. A close above the neckline is meant to show that sellers have run out. That is the story, at least.
The measured target adds the pattern height to the neckline.
height = neckline - lowest low
target = neckline + height
So a pattern with a neckline at 1.2000 and a lowest low at 1.1900 has a height of 100 pips and a target at 1.2100. Our guide to measured move targets covers the method in more detail.
The stop, in the classic version, sits below the lowest of the three lows. If price closes back below the lows, the idea is void. Thomas Bulkowski keeps long statistics on stock patterns in his triple bottoms page at ThePatternSite, and his numbers come from equities, not forex. Our test below is our own, on currency pairs.
The triple top: the mirror image
A triple top is the same pattern upside down. Three highs sit at about the same price, the neckline is the lowest point between them, and the pattern completes on a close below it.
Likewise, the target is the height subtracted from the neckline. The stop sits above the highest of the three highs. We did not test triple tops for this article, so we print no numbers for them.
If you trade tops more than bottoms, read our double top pattern guide and the head and shoulders pattern guide next.
How we tested the triple bottom
Drawing patterns by eye is easy to bias, because you tend to see the ones that worked. So every pattern in our sample came from a fixed scan.
Our data came from MetaTrader 4, build 1471, using Capital Point Trading terminal history. We used daily bars on 23 forex pairs, from 12 June 2018 to 24 August 2026.
For the chart examples, we used the TradingView web chart with OANDA data. Those shots were taken on 9 October 2026 on D1, H1 and M15 charts of USDJPY, AUDUSD, GBPUSD, gold (XAUUSD) and EURUSD. Every marker you see is our measurement.
All results are before spread, swap and commission. We did not place trades. Instead, we counted what price did after each pattern. Our general method is set out in the editorial testing policy.
Classic chart books want volume to rise on the breakout. But forex has no central volume; MT4 and OANDA show tick volume, the number of price changes. So we did not use volume.
Our detection rules and settings
Here is the exact rule set. A different choice would find a different sample.
| Parameter | Our setting | Why it matters |
|---|---|---|
| Swing low definition | 5-bar fractal low | A bar with two higher lows on each side |
| Number of lows | 3 consecutive fractal lows | No other fractal low between them |
| Time window | All three within 90 days | Stops very old lows joining a new range |
| Low tolerance | Within 0.5 ATR of each other | Scales the “same price” idea to volatility |
| Neckline | Highest high between low 1 and low 3 | The level a close must clear |
| Minimum height | 1.5 ATR | Filters out tiny, flat ranges |
| Break window | A close above the neckline within 30 days | After that, we call it no break |
| Target window | Neckline plus height, within 40 days | Time limit for the measured move |
The fractal is the same idea as Bill Williams’ indicator. TradingView explains it in its Williams fractal help page on TradingView, and we cover it in our Williams fractals guide. ATR is the average true range, explained in what ATR means in trading.
Reading a triple bottom on a chart
On our charts, green markers 1, 2 and 3 are the three lows. The red dashed line is the neckline. A blue marker, where one exists, is the first close above the neckline. The thin green dashed line marks the lowest low.
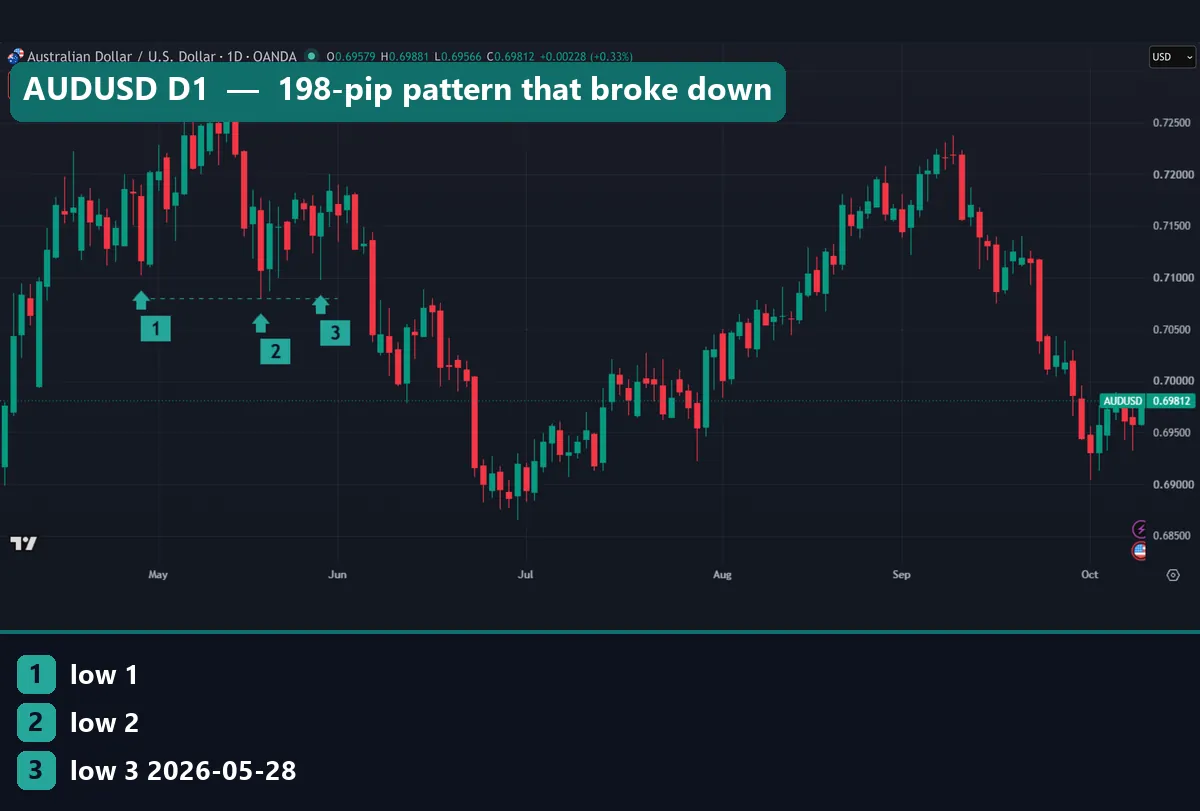
The AUDUSD daily chart shows a wide pattern. The lows came in at 0.71018 on 29 April 2026, 0.70796 on 19 May and 0.70979 on 28 May. The neckline sat at 0.72777, so the height was 198 pips. Price never closed above the line. Instead, it broke the lows in June and traded below 0.6900.
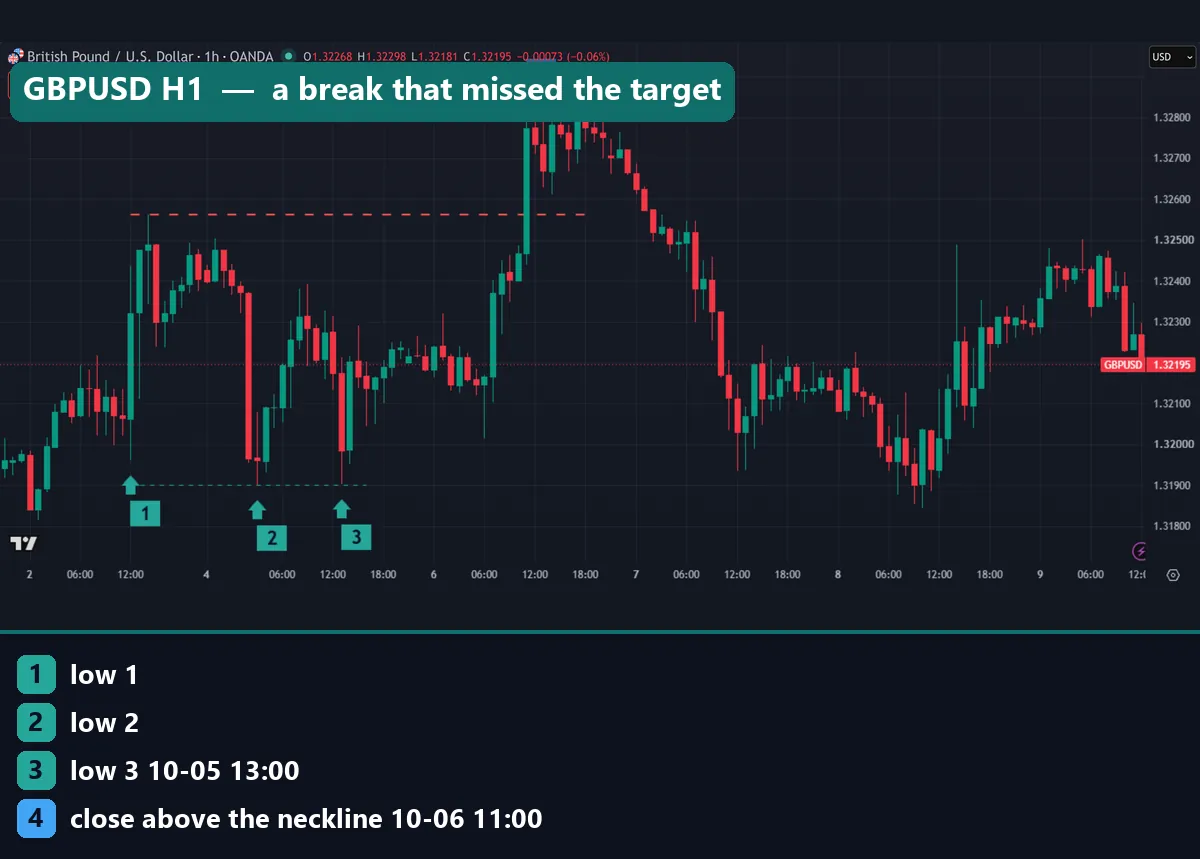
The GBPUSD hourly chart is a pattern that did complete. The lows were 1.3196 at 12:00 UTC on 2 October 2026, then 1.3190 and 1.31902 on 5 October. The neckline was 1.32562. A candle closed above it at 11:00 UTC on 6 October, marked 4. So the height was 66.2 pips and the target was 1.33224.
Next, look at what followed. The rally stalled below 1.3290 and never reached the target. Then price slid back down to the area of the lows on 8 October. In other words, a valid break still led nowhere.
Worked example: the gold triple bottom
Here is one pattern with real numbers. This is gold on the one-hour chart, quoted in dollars.
- Low 1: $4,125.28 at 15:00 UTC on 2 October 2026.
- Low 2: $4,124.75 at 04:00 UTC on 5 October.
- Low 3: $4,123.36 at 15:00 UTC on 5 October.
- Neckline: $4,170.44, the highest high between low 1 and low 3.
- Height: $4,170.44 minus $4,123.36 equals $47.09.
- Target: $4,170.44 plus $47.09 equals $4,217.53.
- Break: a close above the neckline at 11:00 UTC on 6 October.
So far, this is a clean pattern. The three lows sit within $1.92 of each other. A classic stop would go under $4,123.36. So the distance from the break to the stop is about the same as the distance to the target.
That gives a reward to risk of about 1 to 1 before costs. Our guide to the risk reward ratio explains why that ratio needs a high hit rate to pay. And as the next sections show, this pattern does not offer one.
What 77 daily triple bottoms did
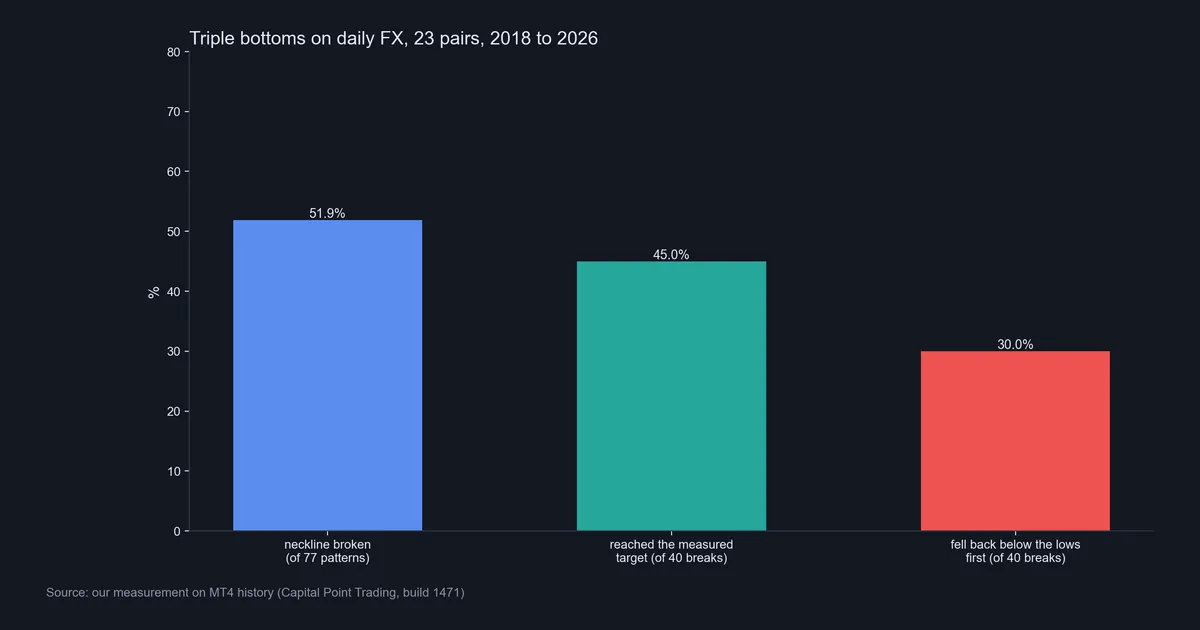
Our scan found 77 triple bottoms on the 23 daily pairs. So the pattern is rare under strict rules.
Only 51.9% of them broke the neckline within 30 days. That is 40 patterns out of 77. The other 37 never completed. So a triple bottom drawn before the break is close to a coin flip.
Of the 40 breaks, 45.0% reached the measured target within 40 days. That is 18 patterns. Meanwhile, 30.0% of the breaks fell back below the three lows before reaching the target. That is 12 patterns. The rest did neither inside the window.
Now put those together. Out of 77 patterns, only 18 went from three lows to a full measured move. That is about 23% of all patterns we found. Also, 77 is a small sample, so treat the figures as a rough picture, not a fixed rate.
Our guide to chart pattern failure covers why this happens.
Gold after the break: the full sequence
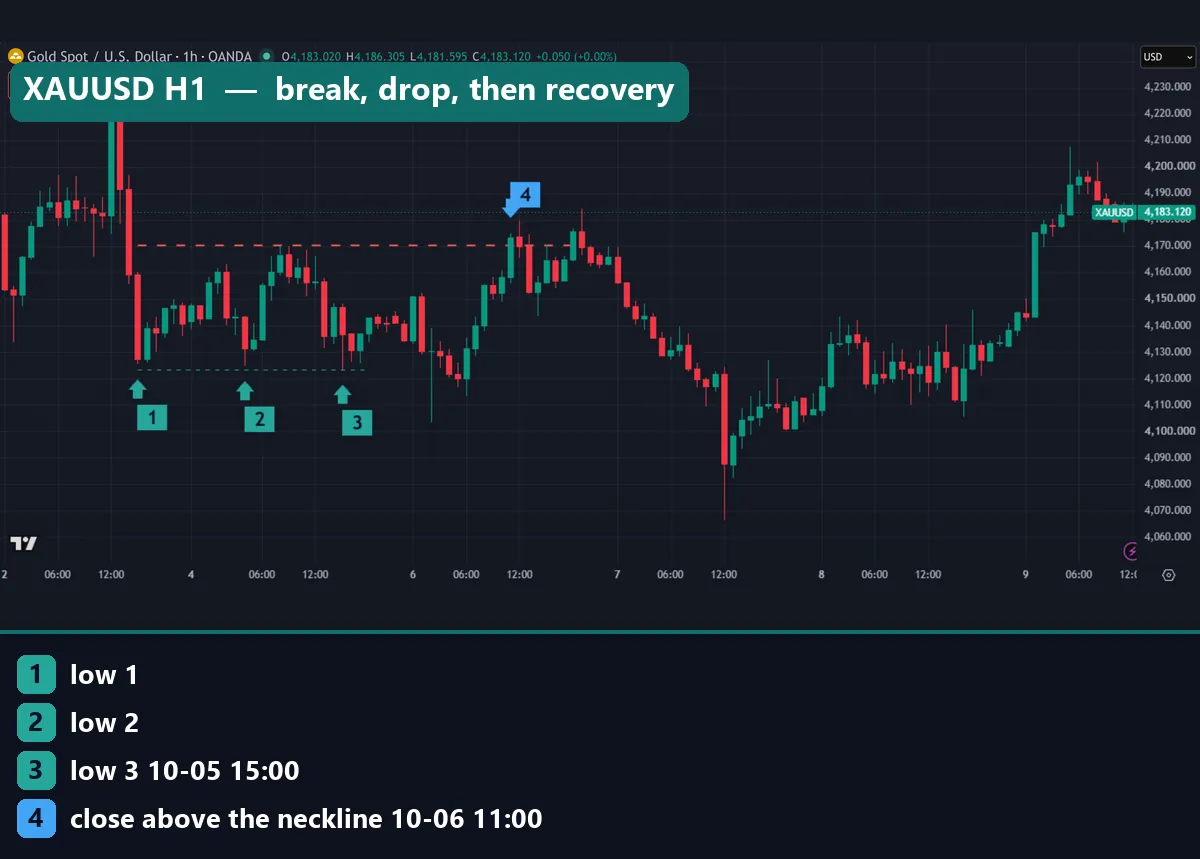
Back to gold. Marker 4 is the close above $4,170.44 at 11:00 UTC on 6 October. Price stalled near the line and then turned lower.
By midday on 7 October, gold traded near $4,070, well under the third low at $4,123.36. That would have stopped out the classic trade. Then gold reversed again and climbed above $4,200 on 9 October. But that rally still fell short of the $4,217.53 target.
So this one pattern shows both failure modes in one chart. First, it broke out and failed. Then it went the right way, but only after taking out the stop. That outcome hit 30% of our daily breaks.
Download the complete indicator database
Put these concepts on your charts. One email unlocks the full library of 1,380+ indicators with compiled MT4 and MT5 files, plus my TradingView scripts. No paywall, no spam, unsubscribe any time.
Get free access to my indicator database
One email unlocks 1,380+ free MT4, MT5 and TradingView indicators — the complete library. No single-tool download; you get the whole database.
Where it fails
The triple bottom has real weak points.
- Half never complete. Only 51.9% of our patterns closed above the neckline.
- The target is often missed. Only 45% of breaks reached the measured move, and 30% returned below the lows first.
- The stop is wide. With a stop under the lows, risk often equals the whole pattern height. That makes the trade close to 1 to 1 at best.
- The shape is defined loosely. Two traders using different tolerances will disagree on which patterns exist.
- Small samples. 77 daily patterns over eight years is not much data. We did not test lower timeframes for statistics.
- No real volume. The classic volume check cannot be done in spot forex, because tick volume is not traded volume.
Above all, three bounces feel like proof. They are not.
Two more charts where this fails
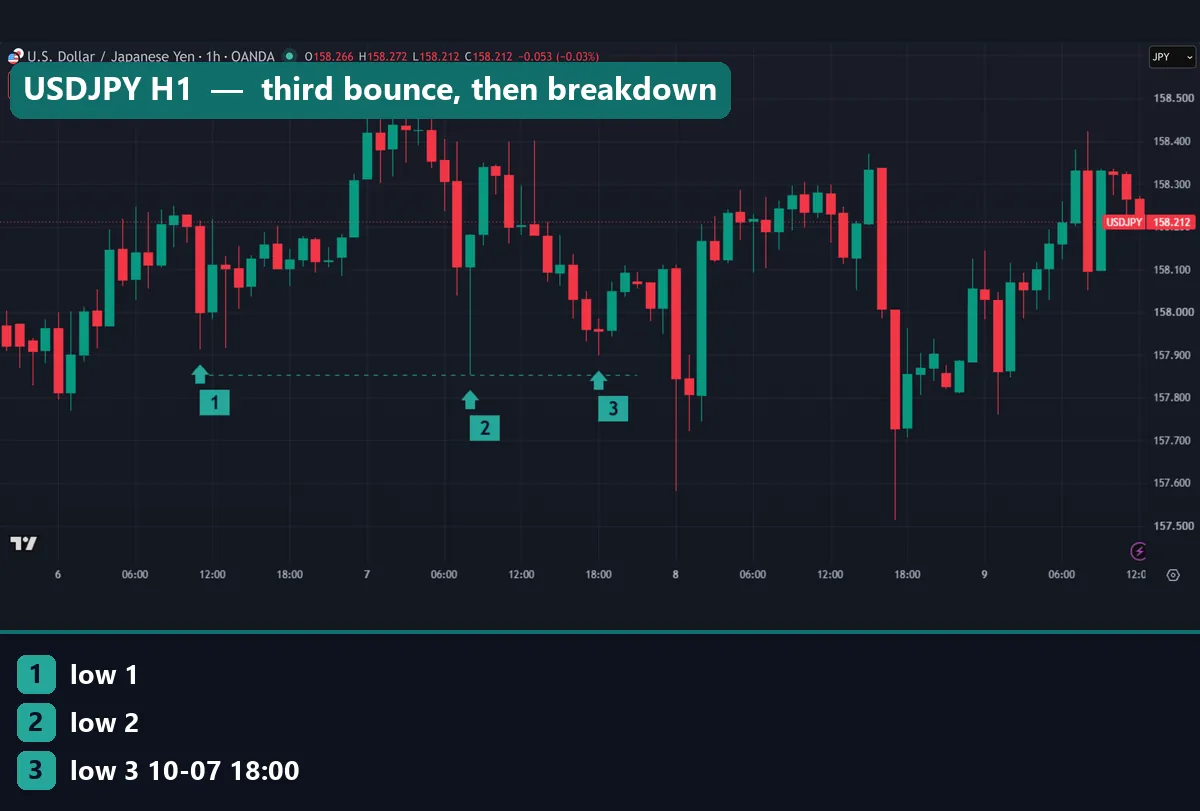
The USDJPY hourly chart shows a tight pattern that never broke. The lows were 157.912, 157.853 and 157.898, from 6 to 7 October 2026. The neckline sat at 158.51, a height of 65.7 pips. Price never closed above it. Instead, on 8 October it dropped through all three lows and traded under 157.600. A buy on the third bounce at 18:00 UTC on 7 October would have been stopped out.
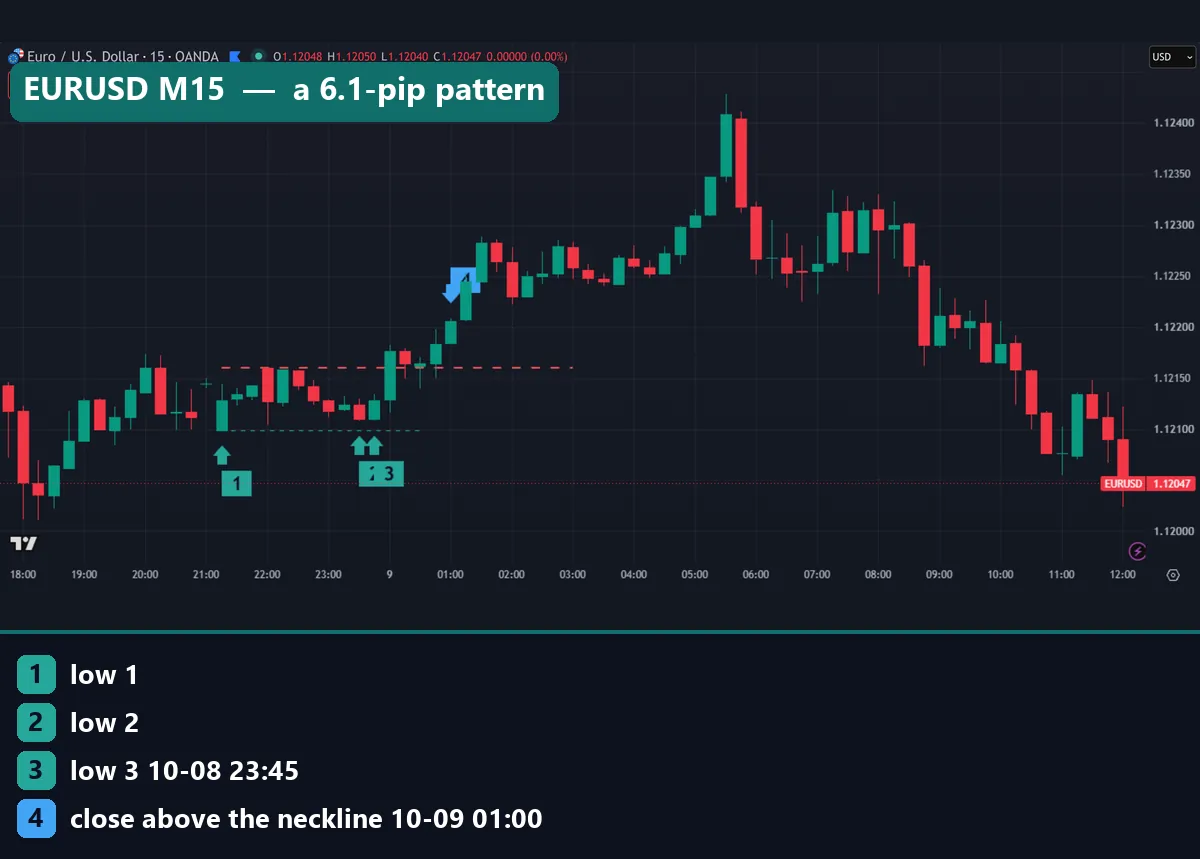
The EURUSD 15-minute chart shows a different problem. Low 1 printed 1.12099 at 21:15 UTC on 8 October. Lows 2 and 3 both printed 1.12108, at 23:30 and 23:45, on neighbouring bars. That is why markers 2 and 3 overlap on the chart. To the eye, it looks more like a double bottom, but a mechanical scan still counted it.
The break came at 01:00 UTC on 9 October above 1.12160, and the target of 1.12221 was hit soon after. Yet the whole height was only 6.1 pips. On a pattern that small, costs take a large share of the move.
Common mistakes with the triple bottom
- Buying the third low. The third bounce is not a signal. In our test, nearly half of the patterns never broke the neckline. Wait for the close above it.
- Using a wick as the break. A spike above the neckline that closes back below it is not a break. We counted closes only. Our break and retest strategy test shows how often first breaks fail.
- Setting the stop too tight. A stop just under the neckline gets hit by normal noise. However, a stop under the lows makes the trade wide. Size the position to that distance. Our guide on how to use a stop loss covers the trade-off.
- Ignoring the size of the pattern. A 6-pip pattern on M15 and a 198-pip pattern on D1 are not the same trade. Check the height against your costs.
Where to go next
If you want a tool to mark swing lows for you, our fractal indicator for MT4 plots the same 5-bar lows our scan used.
For background on the levels behind the pattern, read support and resistance explained. Our guide to peaks and troughs covers how swing points define trend.
For outside reading, the triple top and triple bottom entry on Wikipedia gives the basic definition. StockCharts has a longer write-up in its triple bottom reversal article at StockCharts ChartSchool.
FAQ about the triple bottom
Is a triple bottom bullish?
Only after it completes. The pattern is bullish once a candle closes above the neckline. Before that, it is a range. In our daily test, just 51.9% of patterns ever closed above the neckline.
How do you calculate the triple bottom target?
Take the neckline and subtract the lowest of the three lows to get the height. Then add that height to the neckline. In our gold example, $4,170.44 plus $47.09 gave a target of $4,217.53.
Where should the stop loss go?
The classic stop sits below the lowest of the three lows. That point is where the pattern is clearly void. It also makes the risk wide, so size the position to that distance.
How close do the three lows need to be?
There is no fixed rule. We required all three lows within 0.5 ATR of each other on the daily chart. A looser rule finds more patterns, but many of them are just ranges.
Is a triple bottom stronger than a double bottom?
Many books say so, because the level held one extra time. We did not test the two side by side, so we cannot confirm it. Our triple bottom numbers alone do not show a strong pattern.
What timeframe works best for a triple bottom?
We measured only daily charts for statistics. Lower-timeframe patterns tend to be smaller. Our EURUSD M15 example had a height of only 6.1 pips, so costs matter far more there.
Does volume confirm a triple bottom in forex?
Not in the classic sense. Spot forex has no central volume, and MT4 and OANDA show tick volume, which counts price changes. We did not use volume in our test.
How often does a triple bottom reach its target?
In our sample of 77 daily patterns, 40 broke the neckline and 18 of those reached the target within 40 days. That is 45% of breaks, or about 23% of all patterns. These figures are before costs; results are not guaranteed; past performance is not indicative of future results.
Last updated: 9 October 2026.

About the author
Written by Dominic Walsh, a Forex trader and MT4/MT5 indicator, Expert Advisor and script developer. Every tool on forexmt4systems.com is tested on live charts before release and ships with ready-to-use compiled MT4 (.ex4) and MT5 (.ex5) files. Learn more about the trader and developer behind this site.
How we build, test and correct every tool: Editorial & Testing Policy. Trading carries risk; see the disclaimer.