
ICT standard deviation is a way to project price targets by stacking copies of a reference range above and below it, usually at 1, 2, 2.5 and 4 times its size. This guide settles three things. First, what the levels are and how to draw them. Next, which range to anchor them to. Last, how often price actually reached them on nine symbols we measured on MetaTrader 4. The short answer: the first level was reached on a minority of days, and the deeper levels were rare.
What ICT standard deviation actually means
The term comes from the Inner Circle Trader teaching, which you can follow on the Inner Circle Trader channel on YouTube. In that teaching, a “standard deviation” is one full copy of a chosen range. So 2 standard deviations means two range widths beyond the edge.
That is not the statistical standard deviation. In statistics, the standard deviation measures how far values spread around their average. The NIST handbook page on measures of scale shows the real formula. ICT borrows the name, but the math is a simple multiple of a high minus a low.
This matters because the name sounds like a probability. A trader may think a 2 SD level carries some bell-curve meaning. It does not. Instead, it is a ruler laid on the chart. For a broad view of where these ideas sit, our page on what ICT trading is covers the wider method.
How the projections are calculated
The math takes three steps. First, mark the high and the low of the reference range. Then subtract to get the range width. Finally, add or subtract multiples of that width from the edges.
Range = High - LowUpper level n = High + n x RangeLower level n = Low - n x Range
Here n is 1, 2, 2.5 or 4 in our test. Some traders add 1.5, 3 or more. The formula stays the same.
On TradingView, most people draw this with the Fibonacci tool and add negative levels such as -1, -2, -2.5 and -4. The TradingView help page for the Fib Retracement tool explains how to edit its levels. Which side the negative levels print on depends on the direction you drag. So check that the -1 line sits one full range beyond the edge you meant. Our guide to ICT Fibonacci settings lists the level values people commonly type in.
Which range to anchor: Asian range, CBDR and others
ICT practitioners do not agree on one anchor. That is the single biggest source of confusion with this tool. Different anchors give different levels on the same day.
- Asian range: the high and low of the quiet overnight session. Our Asian trading session guide covers its hours.
- CBDR: the central bank dealers range, usually 14:00 to 20:00 New York time.
- Flout: the CBDR and the Asian range joined into one range.
- A swing leg: some traders project the leg that broke structure, often inside an ICT dealing range.
We picked the Asian range. It is easy to define by clock time, so anyone can repeat it. That said, it is one stated choice, not the official one. If you use the CBDR, our numbers do not describe your levels.
How we tested ICT standard deviation levels
We ran one rule on MetaTrader 4, build 1471, on a Capital Point Trading terminal. The data was M15 history from June 2025 to August 2026 on nine symbols: AUDCAD, AUDUSD, EURUSD, GBPUSD, NZDCAD, USDCAD, USDCHF, USDJPY and XAUUSD.
The rule was simple. The Asian range is the high and low of 21:00 to 06:59 UTC. The projections sit 1, 2, 2.5 and 4 range widths beyond its high and its low. Then a day counts as “reached” if the London and New York part of the same day traded at least that far beyond the range, on either side.
The day counts differ by symbol. AUDCAD had 318 usable days, but USDJPY had 99 and AUDUSD had 109. So treat those two as thin samples.
The chart examples come from the TradingView web chart with OANDA M15 data for 5 and 6 October 2026. We took the screenshots on 7 October 2026. No trades were simulated, so spread, swap and commission do not enter these figures. Our editorial testing policy explains how we run and report tests.
Settings and parameters
These are the inputs we used. Change any of them and the levels move, so write yours down before you test.
| Parameter | Our value | Common alternatives |
|---|---|---|
| Anchor range | Asian range, 21:00 to 06:59 UTC | CBDR, Flout, a swing leg |
| Projection multiples | 1, 2, 2.5 and 4 | 1.5, 3, or only 2 to 2.5 |
| Chart timeframe | M15 | M5 or H1 |
| Window for “reached” | London and New York part of the same day | Only a kill zone, or the next day too |
| Side | Either side counts | Only the side of your daily bias |
| Price used | High and low wicks | Candle closes |
The “either side” choice makes our numbers generous. If you only count the side of your bias, expect lower figures. Our ICT times guide lists the session windows in one place.
Reading the levels on a chart
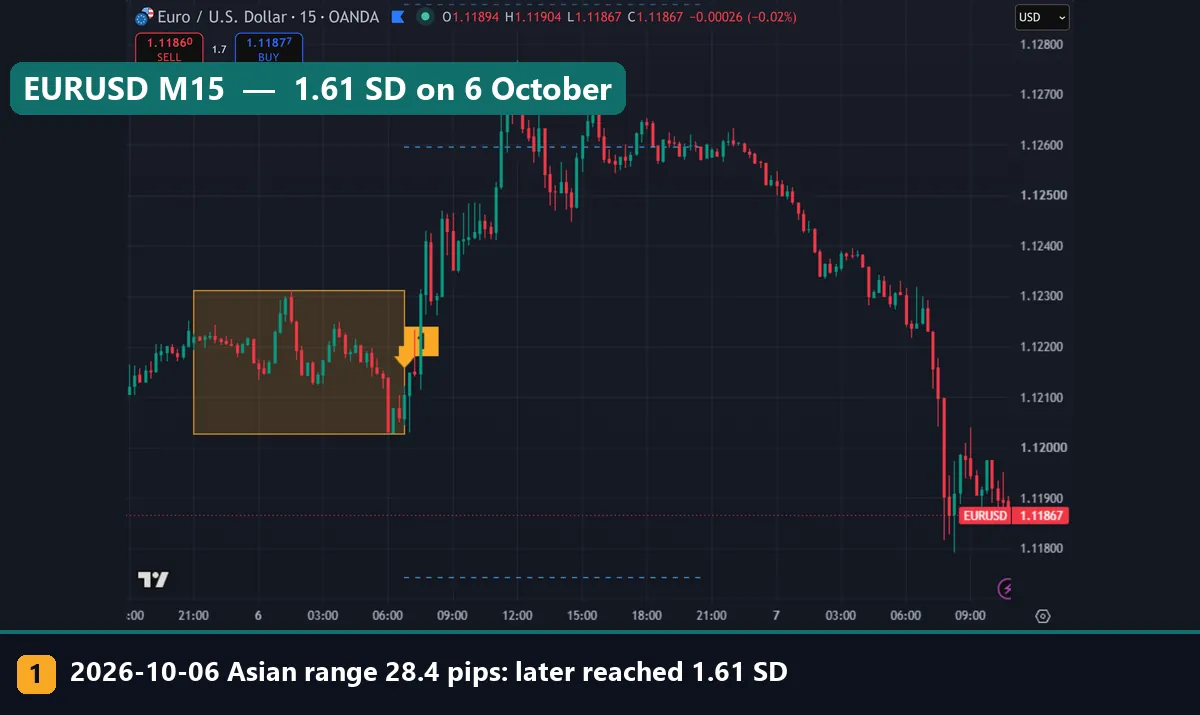
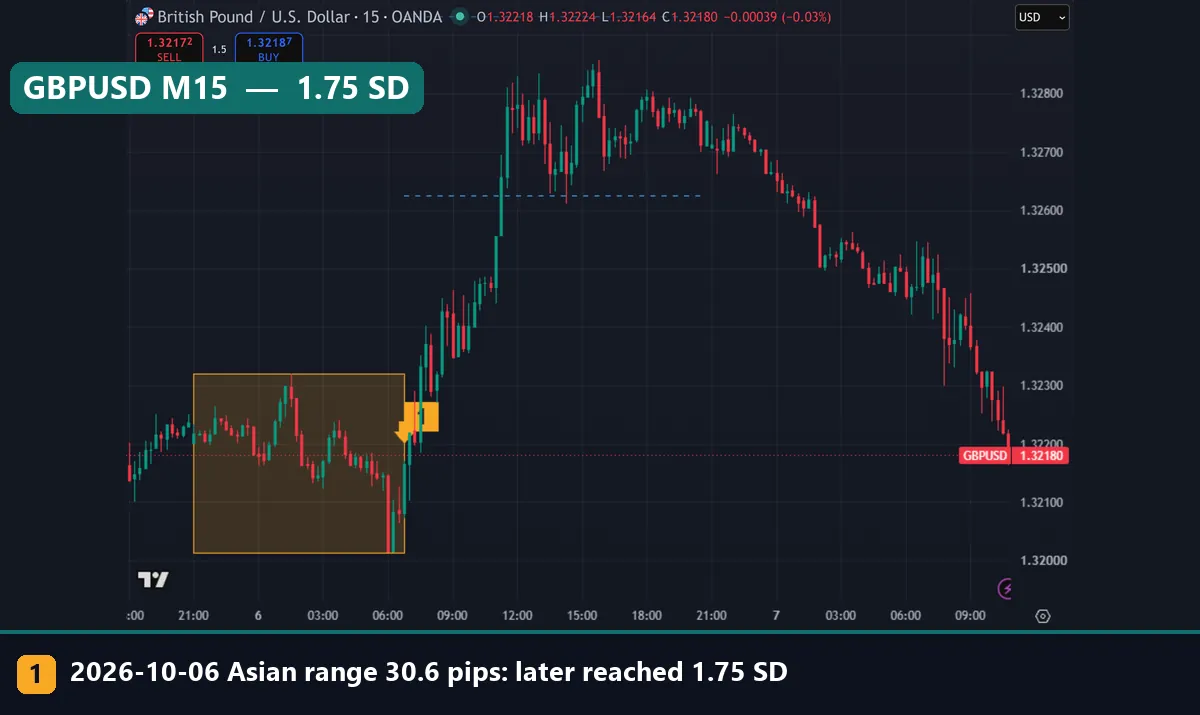
In our charts, the yellow box is the Asian range. The blue dashed lines are the 1 and 2 projections above and below. The dotted blue lines are the 2.5 projections. When price never got near a level, that line sits off the screen.
The GBPUSD chart below shows 6 October 2026. The Asian range was 30.6 pips, from 1.32014 to 1.32320. So the first upper projection sat at 1.32626. Price broke the top of the box after 07:00 UTC, then climbed through that line. It peaked at 1.75 SD and stalled under the 2 SD line, which is off the top of the chart.
Gold tells a different story on the same day. The Asian range was $48.76, from $4,103.52 to $4,152.27. That box is wide, so the first projection sat near $4,201. Price rallied hard, but it only got 0.66 of a range above the high. As a result, none of the blue lines appear on the chart.
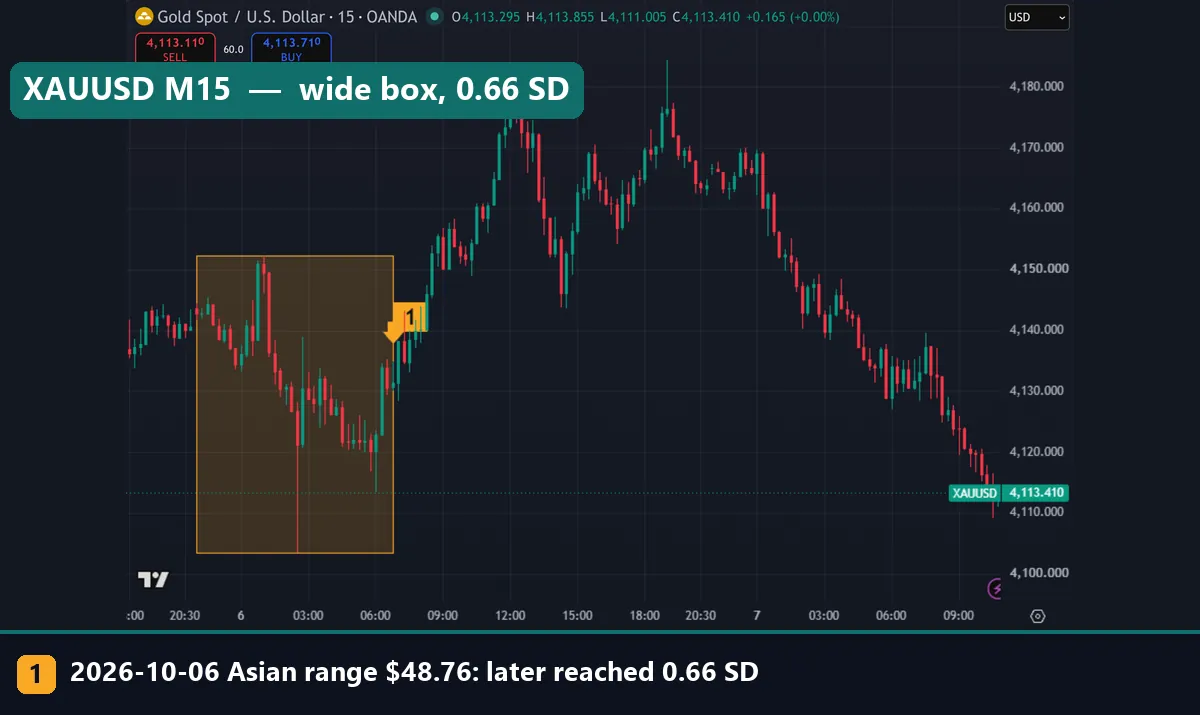
In short, the same move looks large or small depending on the box. A wide Asian range pushes every level further away.
Worked example: EURUSD on 6 October 2026
The opening chart shows EURUSD M15 on 6 October 2026. Here is the math step by step.
- The Asian high was 1.12312 and the low was 1.12028.
- So the range was 0.00284, or 28.4 pips.
- The 1 SD levels were 1.12596 above and 1.11744 below.
- The 2 SD levels were 1.12880 and 1.11460.
- The 2.5 SD levels were 1.13022 and 1.11318.
After the box closed, price dipped to the Asian low and then rallied. It crossed 1.12596 a few hours later. The high of the day came at 1.61 SD, roughly 1.1277. So the 1 SD level was reached, but the 2 SD level was not. On the downside, price held just above the Asian low.
Next, look at the right side of the same chart. On 7 October, price fell back below the whole box. Our rule only scores the same day, so that drop does not count. Still, it shows how a level can look “respected” on one day and irrelevant the next.
One more contrast from the same data: on 5 October, the EURUSD Asian range was 100.2 pips. Price never even broke out of it. A wide box is often a sign the day’s move already happened overnight.
What nine symbols showed over 14 months
The bar chart below is our measurement from MT4 history. It shows how often each level was reached, on either side, per symbol.
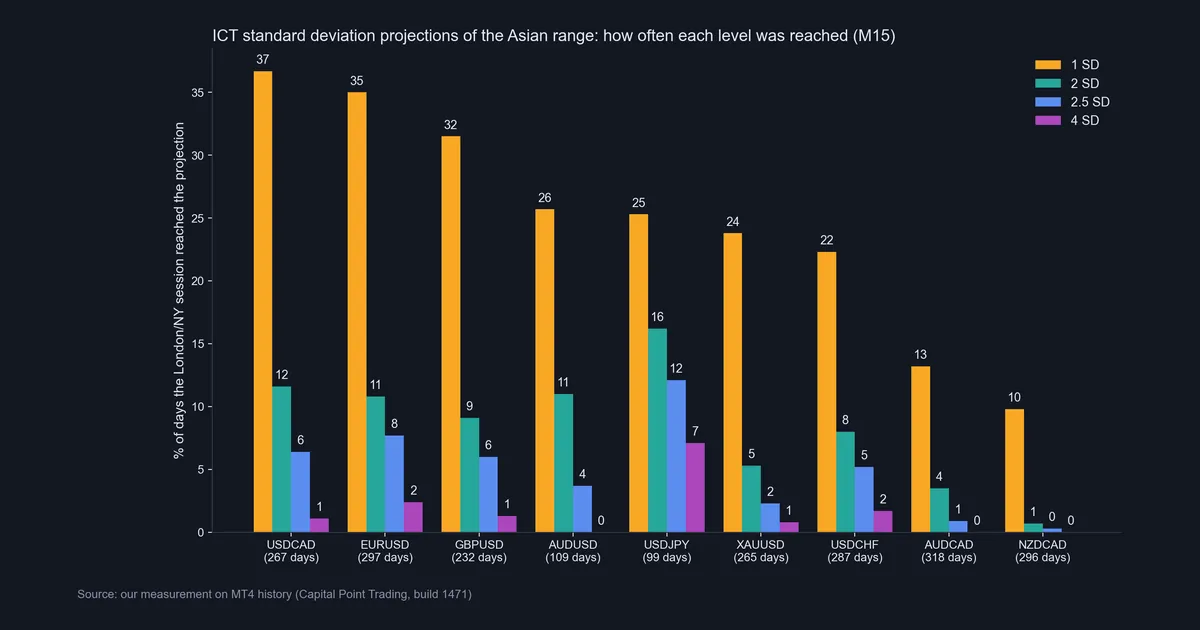
The 1 SD level was reached on 36.7% of USDCAD days and 35.0% of EURUSD days. Those were the highest figures. However, AUDCAD reached it on only 13.2% of days, and NZDCAD on 9.8%.
Deeper levels were rare. EURUSD hit 2 SD on 10.8% of days and 4 SD on 2.4%. NZDCAD hit 2 SD on 0.7% of days. AUDCAD, AUDUSD and NZDCAD never reached 4 SD at all. USDJPY looked the most stretched, with 2 SD on 16.2% of days, but it had only 99 days of data.
Also note what a quiet day looks like. On 6 October, USDJPY had a 47.8-pip Asian range and then traded only up to its high. It reached 0.00 SD: no breakout at all.
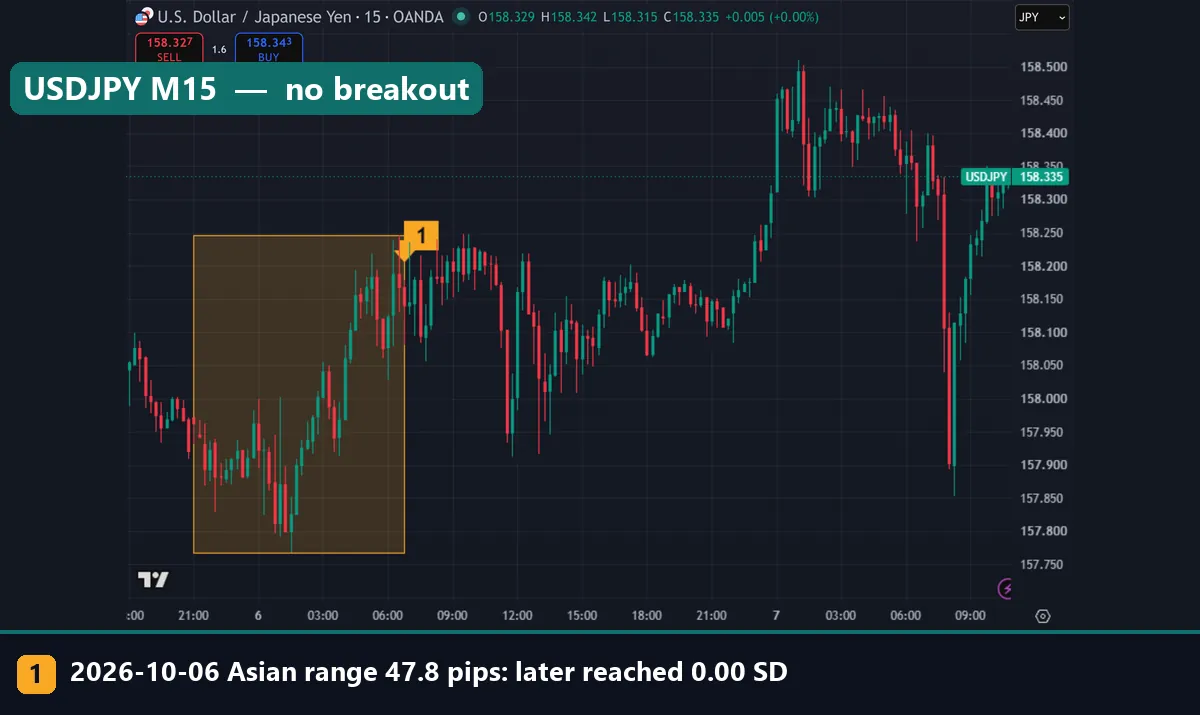
So on most days, for most symbols, even the first projection was not reached. That is the baseline any SD-based plan has to beat.
Download the complete indicator database
Put these concepts on your charts. One email unlocks the full library of 1,380+ indicators with compiled MT4 and MT5 files, plus my TradingView scripts. No paywall, no spam, unsubscribe any time.
Get free access to my indicator database
One email unlocks 1,380+ free MT4, MT5 and TradingView indicators — the complete library. No single-tool download; you get the whole database.
Where it fails
First, the levels are not a forecast. They are a ruler. Our data shows the 1 SD level was missed on most days for every symbol we tested. So treating it as a likely target sets you up for many missed exits.
Second, the anchor changes everything. An Asian range of 28.4 pips and one of 100.2 pips on the same pair give very different maps. Our test says nothing about the CBDR, the Flout or swing-leg projections.
Third, the name misleads. Because “standard deviation” sounds statistical, people assume the levels map to odds. They do not.
Fourth, you only know the final range at 06:59 UTC. Any level drawn before then will move. And if news hits early in London, price can blow through two levels before you have read them. Our list of forex news release times helps you see those days coming.
Finally, our samples are small for USDJPY and AUDUSD, and we measured reach, not trades. We did not test stops, entries or costs, and we did not test out of sample.
Two charts that show the limits
GBPJPY on 6 October 2026 is the most extended case in our chart set. The Asian range was 43.7 pips, from 208.644 to 209.081. Price broke out after 07:00 UTC and pushed through the 1 SD line at 209.518. Then it went through the 2 SD line at 209.955 too, peaking at 2.22 SD. It did not reach the 2.5 SD line, the dotted one near the top, on that day.
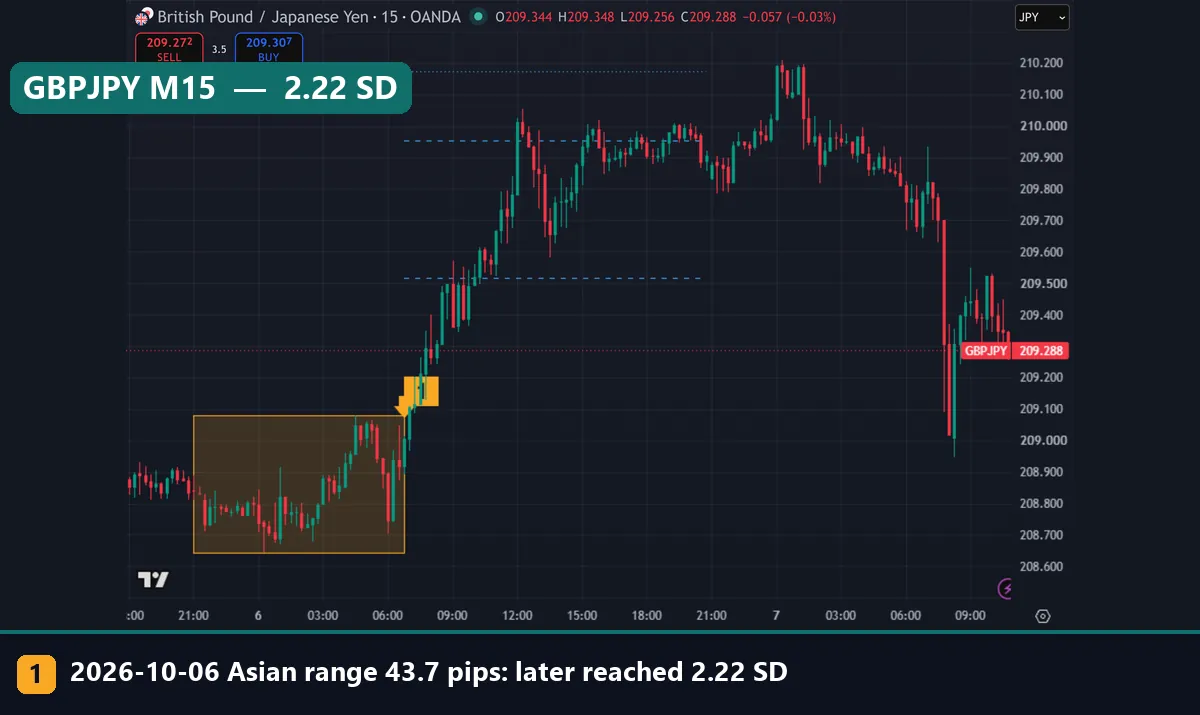
Many ICT followers watch 2 to 2.5 SD as a turning zone. Here price did stall between them. But one day is an example, not evidence, and GBPJPY was not in our MT4 sample.
AUDUSD on 5 October 2026 shows the opposite. The Asian range was 25.3 pips. Price broke out higher but stopped at 0.62 SD. The dashed line is the 1 SD level at 0.69831. Price only crossed that line on the following day, which our same-day rule does not count.
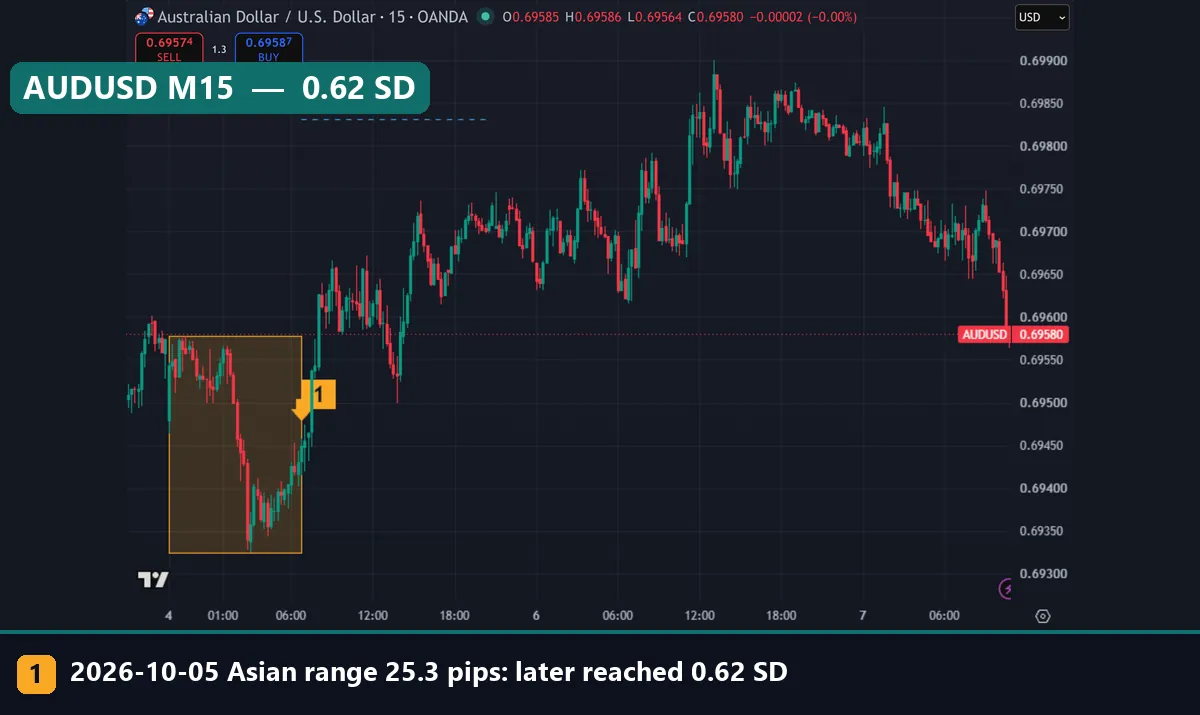
Across both October days in our TradingView set, seven symbols gave 14 symbol-days. Only three reached 1 SD: EURUSD, GBPUSD and GBPJPY, all on 6 October.
Common mistakes with SD projections
- Drawing from an unfinished range. The Asian box is not final until the session ends. Levels drawn at 03:00 UTC will shift.
- Mixing anchors. Some traders use the CBDR one day and the Asian range the next, then remember only the day that fit. Pick one anchor and stick to it.
- Reading 2 SD as a likely target. In our data, 2 SD was reached on about one day in ten for EURUSD. That is a tail event, not a default exit.
- Ignoring the range size. A very wide box puts every level far away. Compare the box to the pair’s normal day, for example with an average daily range indicator.
Where to go next
If you want the session box drawn for you, our ICT Asian range indicator marks it on MT4 and MT5. Also, the ICT CBDR indicator covers the other common anchor.
For context on how these projections fit a full day, read the ICT Asian range strategy. Then see the London kill zone page, since the breakouts in our charts began right after the box closed, in London hours.
Next, the Fibonacci retracement vs extension guide explains why projections beyond 100% behave like extensions. And if you want a real statistical standard deviation on a chart, Bollinger Bands use one.
Finally, to see why forex trades around the clock in separate sessions, the BIS Triennial Survey of FX turnover shows where the volume is booked.
FAQ
Is ICT standard deviation the same as statistical standard deviation?
No. In ICT use, one standard deviation is one copy of a chosen range, while the statistical version measures spread around an average.
What range should I project from?
There is no single answer, since practitioners use the Asian range, the CBDR, the Flout or a swing leg; we used the Asian range from 21:00 to 06:59 UTC.
Which levels do traders watch most?
Many watch 1, 2, 2.5 and 4 range widths, and some add 1.5 or 3, but the formula stays the same for every level.
How often did price reach 1 SD in your test?
It ranged from 9.8% of days on NZDCAD to 36.7% on USDCAD, counting either side, on M15 history from June 2025 to August 2026.
How often did price reach 2 SD?
Rarely: 0.7% of days on NZDCAD, 10.8% on EURUSD, and 16.2% on USDJPY, though USDJPY had only 99 days of data.
How do I draw the levels in TradingView?
Use the Fib Retracement tool across the range, add levels such as -1, -2, -2.5 and -4, and check that -1 sits one full range beyond the edge you meant.
Does a small Asian range mean a bigger move later?
Not clearly: on 6 October, AUDUSD and USDCHF had the narrowest boxes and still did not reach 1 SD, and we did not measure this across the full history.
Can I trade the levels on their own?
We did not test entries, stops or costs, so our data does not support trading the levels alone; results are not guaranteed; past performance is not indicative of future results.
Last updated: 7 October 2026.

About the author
Written by Dominic Walsh, a Forex trader and MT4/MT5 indicator, Expert Advisor and script developer. Every tool on forexmt4systems.com is tested on live charts before release and ships with ready-to-use compiled MT4 (.ex4) and MT5 (.ex5) files. Learn more about the trader and developer behind this site.
How we build, test and correct every tool: Editorial & Testing Policy. Trading carries risk; see the disclaimer.