
Killzones are four time windows, set in New York time, when ICT teaching says the big moves start. This guide gives the times in New York, London and UTC, shows how daylight saving shifts them, and tests one claim. Do the day’s high and low really form inside them? We checked 2,170 trading days on nine markets. In short, they held the day’s extremes about as often as their share of the clock predicts. The London killzone did worse.
What killzones are
The term comes from ICT, the Inner Circle Trader, a teaching brand run by Michael Huddleston. He split the forex day into short windows tied to the big trading centres. Our primer on what ICT trading is covers the wider method.
The word is also spelled kill zones. Four windows are common in his material and in the indicators built on it:
- Asian killzone: 20:00 to 00:00 New York time.
- London killzone: 02:00 to 05:00.
- New York killzone: 07:00 to 10:00.
- London close killzone: 10:00 to 12:00.
Start and end times differ between ICT videos and between indicator authors. So treat any table as a convention, not a law. Our pages on the London kill zone and the New York kill zone cover each window in more depth.
How killzones work
The idea rests on liquidity. Forex trades around the clock, but not evenly. The BIS 2025 Triennial Survey release lists the UK and the US first among the four places that handle most FX trading. When their desks start dealing, ranges grow.
ICT adds a twist. The first push inside a killzone often runs the stops above or below a recent high or low, then turns. That fake move is the Judas swing. So a killzone trader waits for the window, watches for a sweep of a nearby level, and trades the turn.
That gives a claim we can test. If killzones matter, the day’s high and low should form inside them more often than their share of the clock. We used two simple measures:
share of range = (killzone high - killzone low) / (day high - day low)
clock share = window length in hours / 24
A three-hour window covers 12.5% of the clock. If the day’s high landed at a random time, it would fall inside that window on about 12.5% of days. A window has to beat its clock share to mean anything.
How we tested killzones
We measured killzones on M15 history from MetaTrader 4, build 1471, on the Capital Point Trading server.
- Markets: EURUSD, GBPUSD, USDCAD, USDCHF, AUDCAD, NZDCAD, XAUUSD (gold), AUDUSD and USDJPY.
- Window: 1 June 2025 to 26 August 2026, set by each symbol’s M15 history. AUDUSD and USDJPY only start on 25 March 2026.
- Sample: 2,170 New York trading days in total, from 99 days on USDJPY to 318 on AUDCAD.
- Trading day: 17:00 to 17:00 New York time, with US daylight time applied.
- Killzones: the four windows above, fixed in New York time.
- “Formed in”: the window that holds the M15 bar that made the day’s high or low.
The chart examples come from the TradingView web chart with OANDA data on the 15-minute timeframe. We took them on 15 October 2026, and all five show the trading day of 14 October. The chart clock is UTC, four hours ahead of New York. Our editorial testing policy explains our methods.
Killzone times in New York, London and UTC
London and New York keep a five-hour gap for most of the year, so the London column holds in summer and in winter. Only the UTC times move.
| Killzone | New York | London | UTC (US summer time) | UTC (US winter time) | Share of 24 hours |
|---|---|---|---|---|---|
| Asian | 20:00-00:00 | 01:00-05:00 | 00:00-04:00 | 01:00-05:00 | 16.7% |
| London | 02:00-05:00 | 07:00-10:00 | 06:00-09:00 | 07:00-10:00 | 12.5% |
| New York | 07:00-10:00 | 12:00-15:00 | 11:00-14:00 | 12:00-15:00 | 12.5% |
| London close | 10:00-12:00 | 15:00-17:00 | 14:00-16:00 | 15:00-17:00 | 8.3% |
| Outside all four | 12 hours | 12 hours | 12 hours | 12 hours | 50.0% |
The London close window also holds the 4pm London fix, when many benchmark FX rates are set. Our guide to the London trading session covers that hour.
The daylight-time gap that moves killzones
The US and the UK change their clocks on different dates. NIST’s daylight saving time rules put the US switch on the second Sunday of March and the first Sunday of November. GOV.UK’s clock-change dates put the UK switch on the last Sunday of March and of October. The EU uses the same last-Sunday dates as the UK.
So for about three weeks in March and one week around the end of October, New York sits only four hours behind London. In 2026 the first gap ran from 8 to 29 March. The second runs from 25 October to 1 November.
During a gap week, a killzone pinned to New York time slides one hour earlier in London. The London killzone then runs from 06:00 to 09:00 London time. A tool pinned to London time would disagree with ours for about a month a year. Our forex time zone converter maps the windows to your own clock.
Drawing killzones on TradingView and MT4
If you build your own killzone boxes, pin each session to New York time, not to the chart’s clock. TradingView’s Pine Script sessions docs explain that time() reads a session in the exchange’s time zone unless you pass one. This short sketch shades three windows:
//@version=6
indicator("Killzones, New York time", overlay = true)
tz = "America/New_York"
london  = not na(time(timeframe.period, "0200-0500", tz))
newYork = not na(time(timeframe.period, "0700-1000", tz))
lnClose = not na(time(timeframe.period, "1000-1200", tz))
bgcolor(london  ? color.new(color.blue, 85)   : na)
bgcolor(newYork ? color.new(color.orange, 85) : na)
bgcolor(lnClose ? color.new(color.teal, 85)   : na)
On MT4 the chart runs on the broker’s server clock, so a killzone tool needs that clock’s offset from New York. Our ICT kill zone indicator page and the guide to ICT kill zone indicators list MT4 and MT5 options. Check each tool’s time offset before you trust its boxes.
Reading killzones on a chart
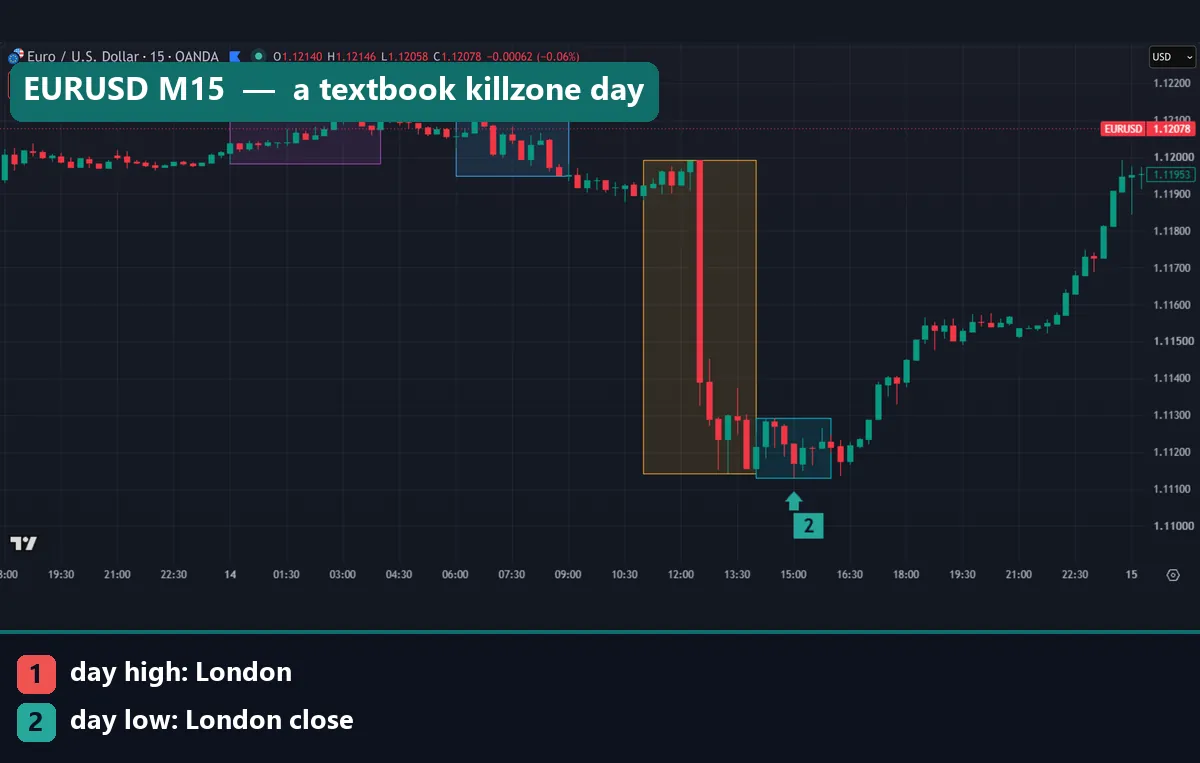
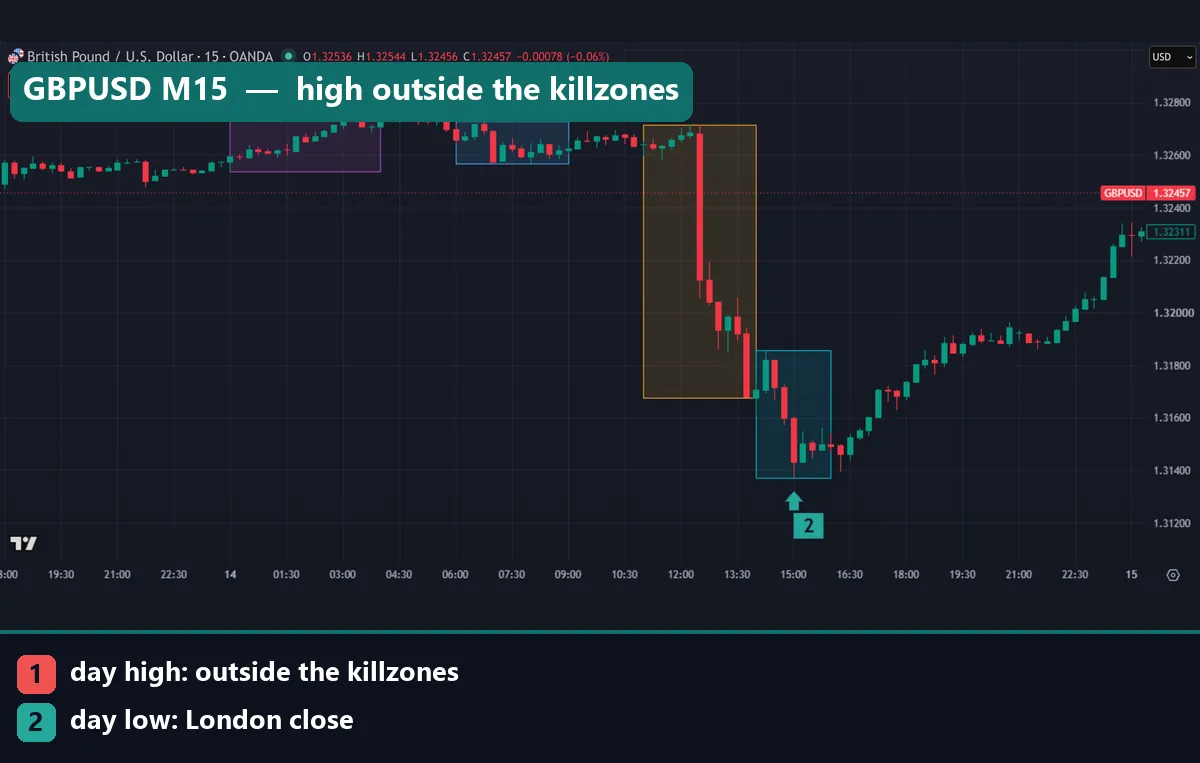
On our charts each killzone is a box from the window’s high to its low. Purple marks Asian, blue marks London, gold marks New York and teal marks the London close. Marker 1 points at the bar that made the day’s high, and marker 2 at the low.
GBPUSD shows the first surprise. The day’s high, 1.32753, came at 04:45 UTC, which is 00:45 New York. That bar sits in the quiet stretch after the Asian window and before London. The low, 1.3137, came at 15:00 UTC inside the London close box.
Gold split the other way. Its high of $4,170.49 printed at 03:15 UTC, late in the Asian window. Its low of $4,073.545 came at 16:00 UTC, or 12:00 New York. That is the first bar after the London close window ends. So the box missed the low by one bar, and our count files that day as “outside”.
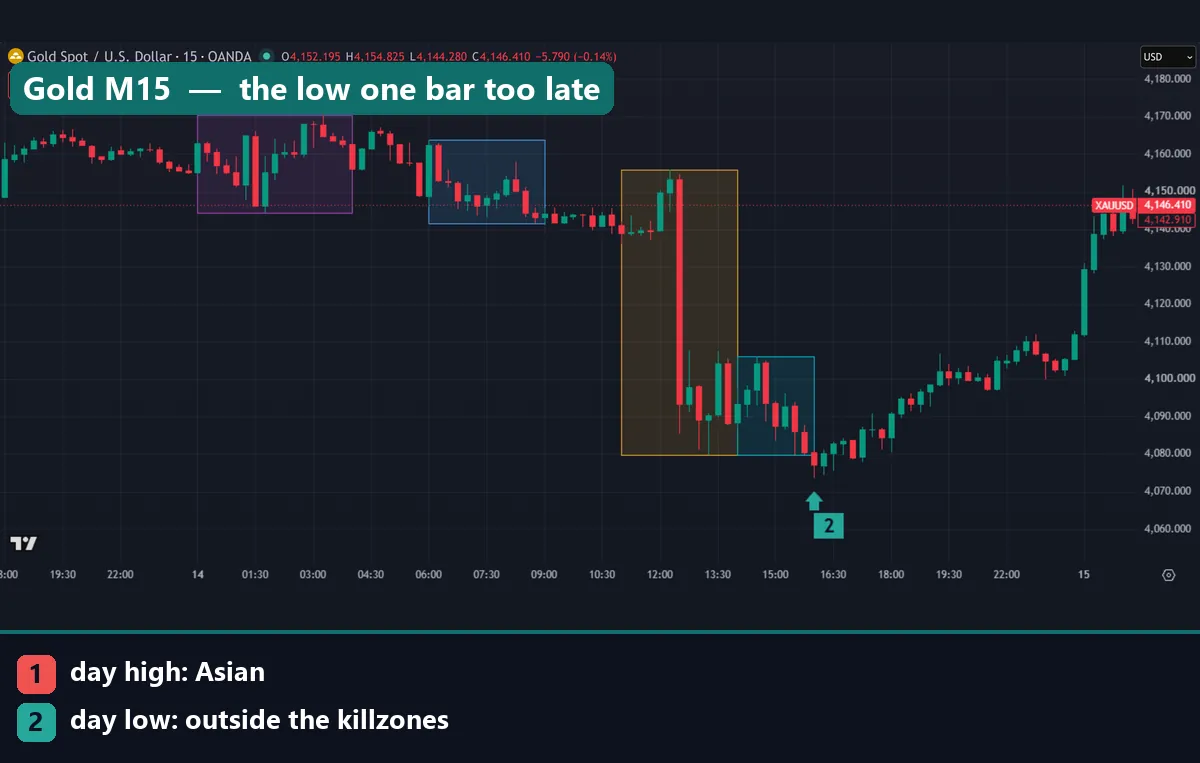
So read every killzone chart this way: find the day’s extremes first, then ask which box, if any, holds them.
Worked example: EURUSD on 14 October 2026
EURUSD gave the textbook version on the same day. Its trading day opened at 17:00 New York on 13 October at 1.12003. Times below are UTC, as on the chart:
- Asian box: 1.11982 to 1.12112, a 13-pip range.
- London box: 1.11949 to 1.12114. The day’s high, 1.12114, printed at 06:30 UTC (02:30 New York).
- New York box: 1.11142 to 1.11992, an 85-pip range.
- London close box: 1.11129 to 1.11292. The day’s low, 1.11129, printed at 15:00 UTC (11:00 New York).
- Close: 1.11566 at 17:00 New York.
The day’s range was 1.12114 minus 1.11129, or 98.5 pips. The New York box alone covered 85 of them, about 86% of the day. That is roughly twice our median of 44% for that window. Most of the drop came from one 15-minute candle at 12:30 UTC, which is 08:30 New York. Many US economic reports come out at that time, as our list of forex news release times shows.
This day fits the ICT story. London set the high, New York drove the move, and the London close held the low. But one day proves nothing, and the full sample tells a different story.
What 2,170 trading days showed
Across all nine markets, each killzone did cover a big slice of the day. The median New York box spanned 44% of the day’s range. Next came the London close at 39%, London at 36.2% and Asian at 32.6%. For a two-hour window, that London close figure is high.
But covering range is not the same as holding the extremes, as the chart below shows.
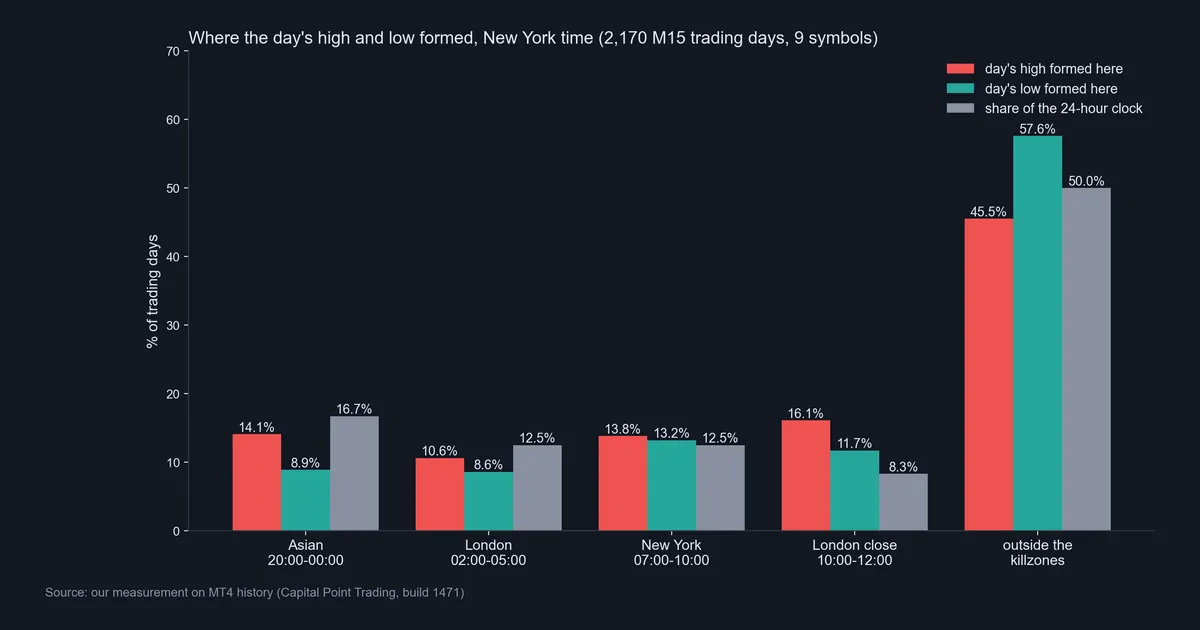
Outside all four killzones, the day’s high formed on 45.5% of days and the low on 57.6%. Those outside hours make up 50% of the clock. So, taken together, the killzones caught the high a little more often than chance and the low less often. The London close stood out: it held the high on 16.1% of days with only 8.3% of the clock.
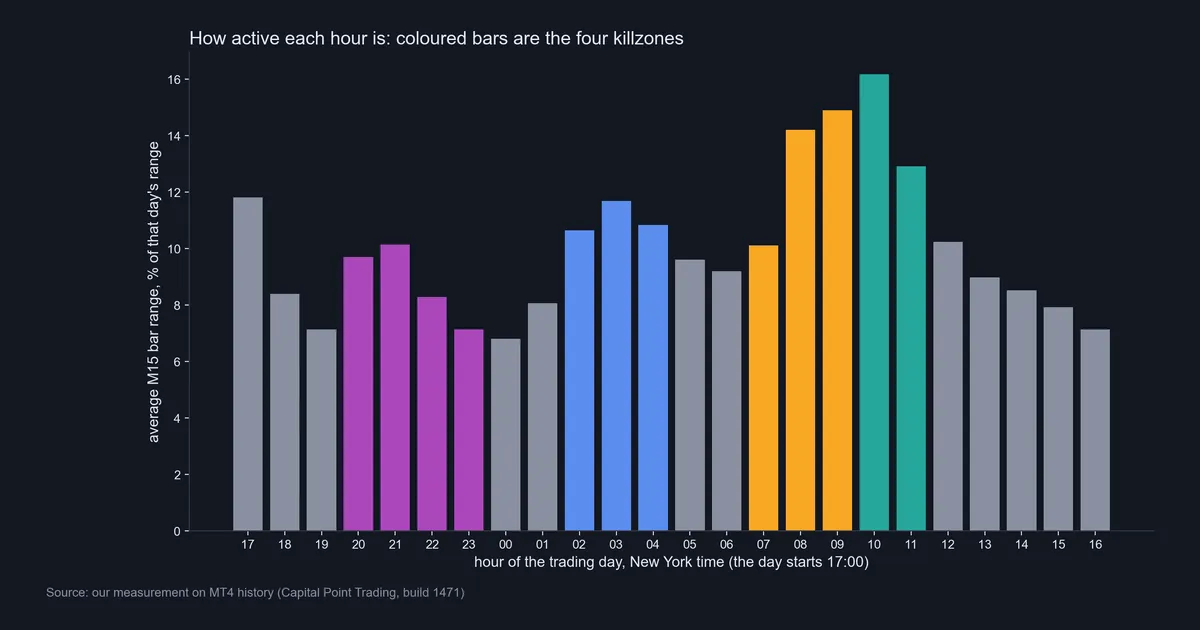
Our hourly chart points the same way. Average M15 bar range peaked in the 10:00 New York hour, the first hour of the London close window, at 16.17% of the day’s range. Next came 09:00 at 14.9% and 08:00 at 14.2%. At the other end, the quietest hour was 00:00, at 6.8%.
Download the complete indicator database
Put these concepts on your charts. One email unlocks the full library of 1,380+ indicators with compiled MT4 and MT5 files, plus my TradingView scripts. No paywall, no spam, unsubscribe any time.
Get free access to my indicator database
One email unlocks 1,380+ free MT4, MT5 and TradingView indicators — the complete library. No single-tool download; you get the whole database.
Where it fails: the limits of killzones
The London killzone is the weakest link. It held the day’s high on only 10.6% of days and the low on 8.6%. Both sit below its 12.5% share of the clock, so a random three-hour slot would have done better. That cuts against the popular idea that London sets the high or low of the day.
The Asian window did worse on lows: 8.9% against a 16.7% clock share. Its last hour, 23:00, was also one of the quietest of the day at 7.13%. And the New York window starts slowly, since its 07:00 hour scored 10.11% against 14.2% for the hour after.
Other limits:
- Short history. Our M15 data starts in mid-2025, so a different year could look different. Our note on backtest sample size explains why 2,170 days is still a modest test.
- Fixed windows. We used one common set of times. Shift a window by an hour and the counts change.
- One data feed. Highs and lows come from one broker’s bid prices. Another feed can put an extreme on a different bar.
- No trading test. This is a timing study. It holds no entries, exits or costs, so it says nothing about profit.
USDJPY and GBPJPY: the low came after the windows
These two charts show the most common miss in our data. Both made their highs inside the New York killzone. USDJPY topped at 158.951 at 13:15 UTC (09:15 New York). GBPJPY topped at 210.312 at 12:15 UTC (08:15 New York).
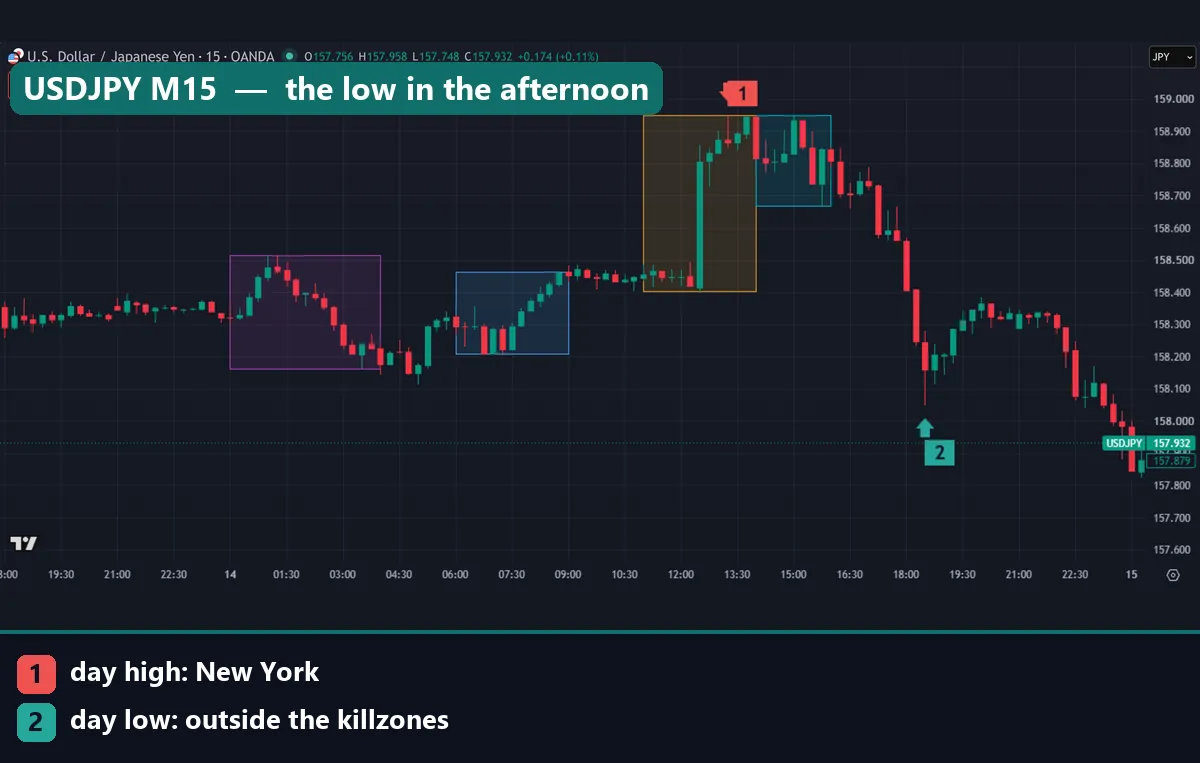
Then both kept falling after every window had closed. Each made its low at 18:30 UTC, which is 14:30 New York: 158.048 on USDJPY and 208.366 on GBPJPY. That is the New York afternoon, and no common killzone covers it. The trading day ends at 21:00 UTC, so the lower prices on the far right of the USDJPY chart belong to the next day.
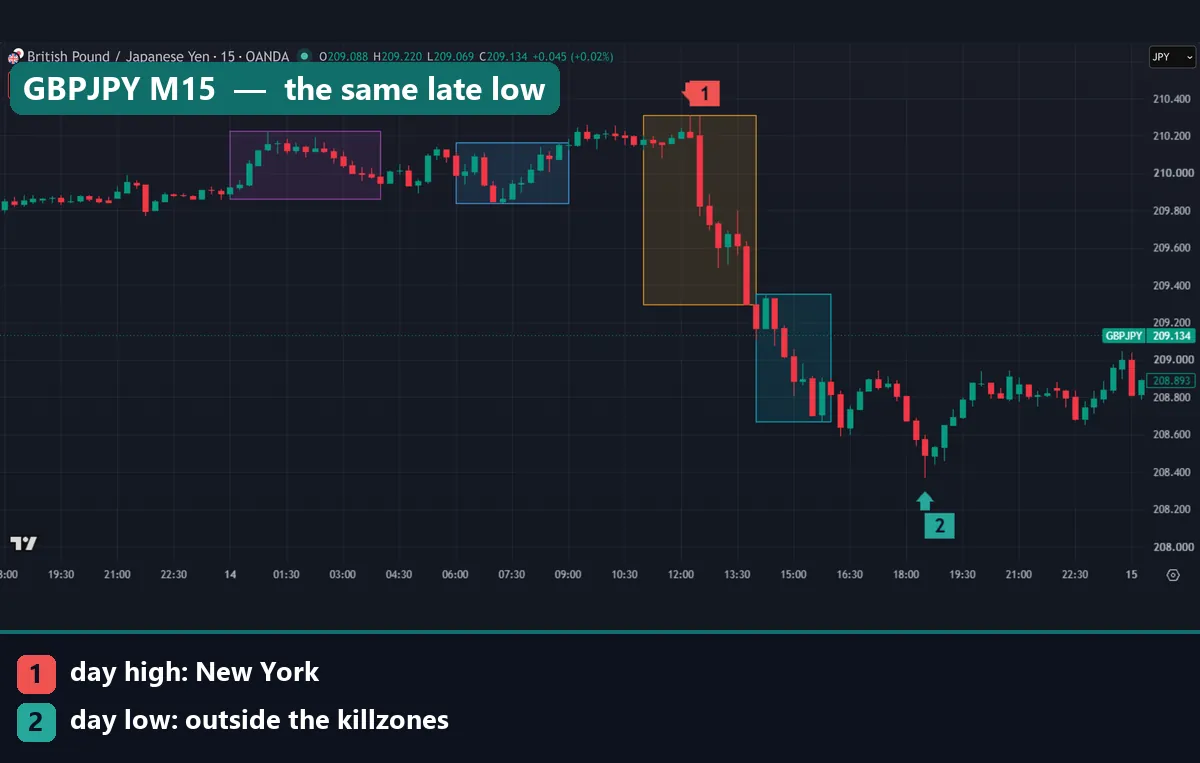
On both pairs, price fell below the London close box after it ended. Days like these feed the 57.6% figure.
Common mistakes with killzones
- Trusting the chart clock. TradingView and MT4 show times in your chosen zone or the broker’s. Convert to New York time before you draw a box, or every window lands in the wrong place.
- Ignoring the gap weeks. For about a month a year, New York and London are four hours apart, not five. Decide which city your windows follow.
- Treating a window as a signal. A killzone tells you when to watch, not which way price will go. Pair it with a setup, such as a sweep of the Asian range, and a stop.
- Closing the chart at noon. The hours outside the killzones held the day’s low on 57.6% of our days. Both JPY charts above made their lows in the afternoon.
Where to go next
Killzones work best as a timing frame around a setup you already trust. These pages build on this guide:
- Forex trading sessions, for the session basics behind every window.
- The Asian trading session, for the quiet hours that set the overnight range.
- The ICT Asian range strategy, which trades a sweep of that range in London.
- ICT daily profiles, which link the windows into a plan for the whole day.
For outside sources, use the NIST and GOV.UK clock rules and the TradingView sessions docs linked above.
FAQ: killzones questions answered
What are the ICT killzone times?
The common set is Asian 20:00 to 00:00, London 02:00 to 05:00, New York 07:00 to 10:00 and London close 10:00 to 12:00. All four are in New York time, and some authors shift them slightly.
Are killzones in New York time or London time?
ICT quotes them in New York time. Most of the year that makes no difference, because the cities sit five hours apart. In the gap weeks, the two clocks give different boxes.
Which killzone is the most active?
The New York window had the largest median share of the day’s range, at 44%. By the hour, the 10:00 New York hour was busiest, with an average M15 bar range of 16.17% of the day’s range.
Does the London killzone set the high or low of the day?
Not often in our sample. It held the high on 10.6% of days and the low on 8.6%, both below its 12.5% share of the clock.
Do killzones work on gold?
Gold was one of our nine symbols, with 265 days, but we did not split results by symbol. On our 14 October gold chart, the high came in the Asian window and the low one bar after the London close.
What is the difference between a killzone and a session?
A session is a city’s whole trading day, such as the London session. A killzone is a short window near a session’s open or close.
Which timeframe shows killzones best?
Use an intraday chart. We used M15, where a three-hour window holds 12 bars. On a daily chart the windows disappear inside one candle.
Can killzones predict the direction of the day?
No. A killzone marks when to watch, not which way price will go. In our test the day’s extremes often formed outside the windows. Use them as one filter among several, and keep in mind that results are not guaranteed; past performance is not indicative of future results.
Last updated: 15 October 2026.

About the author
Written by Dominic Walsh, a Forex trader and MT4/MT5 indicator, Expert Advisor and script developer. Every tool on forexmt4systems.com is tested on live charts before release and ships with ready-to-use compiled MT4 (.ex4) and MT5 (.ex5) files. Learn more about the trader and developer behind this site.
How we build, test and correct every tool: Editorial & Testing Policy. Trading carries risk; see the disclaimer.