
The PPO indicator is the MACD rebuilt as a percentage, so one reading means the same thing on EURUSD, USDJPY or gold. This guide settles three questions. First, what the Percentage Price Oscillator measures. Second, why the percentage scale matters when you compare pairs. Third, whether its crosses told us anything on 23 currency pairs over eight years. The short answer to the last one is no, and the numbers below show why.
What the PPO indicator is
The Percentage Price Oscillator tracks the gap between a fast and a slow exponential moving average. It then divides that gap by the slow average. So the reading is a percentage of price, not a price difference. A PPO of 0.50 means the 12-period EMA sits half a percent above the 26-period EMA.
The MACD uses the same two averages but prints the raw gap in price units. On EURUSD that gap is a few thousandths. On USDJPY it is tenths of a yen. So MACD values do not compare across pairs. The PPO fixes that and changes nothing else about the line.
Most versions also draw a signal line, usually a 9-period EMA of the PPO itself. Some add a histogram. In short, every MACD habit carries over, now on a common scale. StockCharts keeps a clear reference in its Percentage Price Oscillator article at StockCharts ChartSchool.
How the PPO is calculated
The formula has three parts.
PPO = (EMA12 - EMA26) / EMA26 x 100Signal = EMA9 of PPOHistogram = PPO - Signal
Both averages use the closing price by default. Because the EMA gives more weight to recent bars, the fast line reacts first when price turns. Our guide on SMA vs EMA covers that weighting in detail.
Notice what the division does. The MACD value is EMA12 - EMA26. The PPO is that same value divided by EMA26, times 100. So the sign of the PPO always matches the sign of the MACD. That means the zero-line crosses land on the same bar for both. Signal-line crosses can differ by a bar now and then, because the divisor drifts as price moves. In practice the two lines move together.
TradingView documents its version in the Percentage Price Oscillator page in the TradingView Help Center. MetaTrader has no built-in PPO, but its MACD function shows the same two-EMA logic in the iMACD reference in the MQL4 documentation.
How we tested the PPO
We ran two tests on two platforms.
First, the crossover test. We read daily history from MetaTrader 4, build 1471, on a Capital Point Trading terminal. The data covered 23 currency pairs from 12 June 2018 to 24 August 2026. We computed PPO(12, 26) with a 9-EMA signal line. Then we logged every signal-line cross and every zero-line cross. For each one we asked a simple question: was the close 10 days later higher or lower than the close on the cross day? Then we compared that share with the base rate: 52.3% of all days closed higher 10 days later.
Second, the chart examples. We used the TradingView web chart with OANDA data, captured on 9 October 2026. The symbols were EURUSD, GBPUSD and USDJPY on the daily chart, plus USDJPY on the one-hour chart. TradingView’s built-in “Price Oscillator”, set to 12 and 26 with Exponential ticked, is the PPO line. However, it has no signal line. So every marker on our TradingView charts is a zero-line cross, and the signal-line results come only from the MT4 data.
All results are before spread, swap and commission. Our full method is on the editorial testing policy page.
PPO settings and parameters
The defaults copy the MACD: 12, 26 and 9. The table lists each input, what we used, and what changing it does.
| Input | Default we used | What it controls | Effect of a change |
|---|---|---|---|
| Short length | 12 | Fast EMA period | Lower reacts sooner and crosses more often |
| Long length | 26 | Slow EMA period, also the divisor | Higher smooths the line and delays crosses |
| Source | Close | Price fed into both EMAs | High, low or typical price shift values slightly |
| Exponential | On | EMA instead of SMA (TradingView) | Off gives a simple-average oscillator, not the classic PPO |
| Signal length | 9 (MT4 test only) | EMA of the PPO | Lower gives more signal crosses and more noise |
If Exponential is unticked in TradingView, you get a different indicator, so check that box first. The best MACD settings guide covers period choices, and they apply here unchanged.
Reading the PPO indicator on a chart
The PPO sits in its own pane under price. Above zero, the fast EMA is above the slow one. The further from zero, the wider the gap as a share of price.
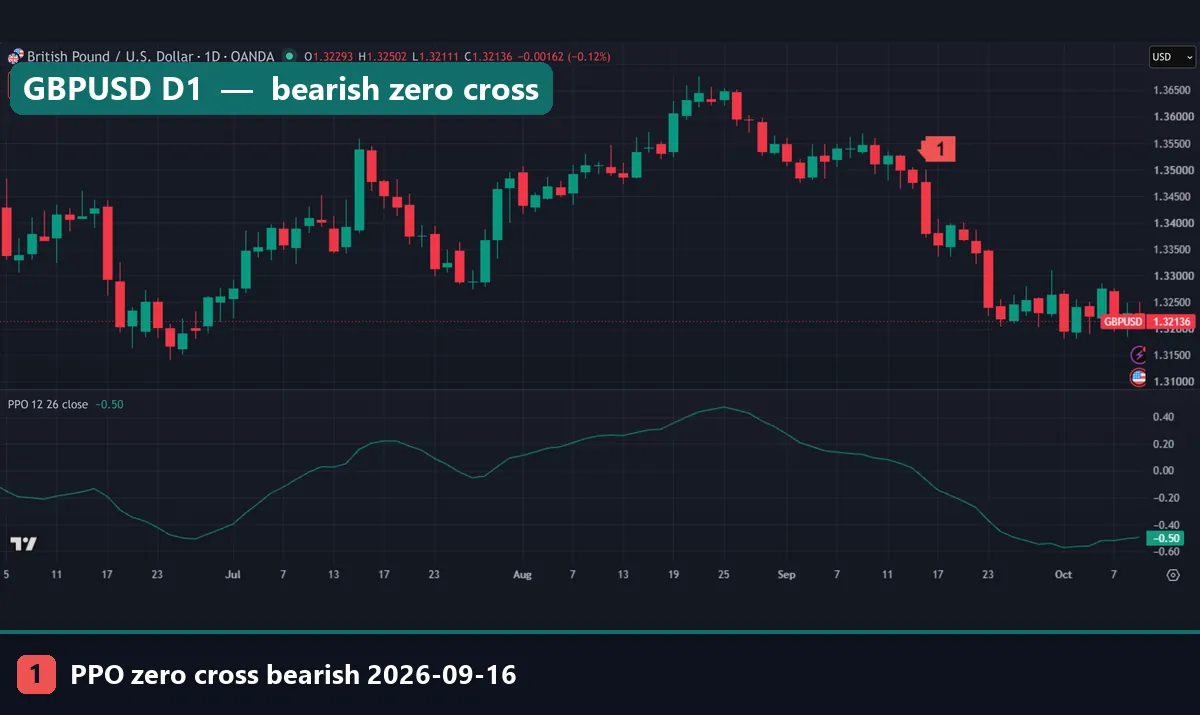
Our GBPUSD daily chart shows the usual reading. The line climbed through July and August and peaked just under 0.50 in late August. Then it rolled over while price stalled. Marker 1 is the bearish zero-line cross on 16 September 2026, when GBPUSD closed at 1.33804. After that the pane kept falling, and it read -0.50 when we took the shot.
Look at late July on the same chart, though. The line dipped just under zero and came straight back. That is the problem with zero crosses near a flat line, and we come back to it in the failure section.
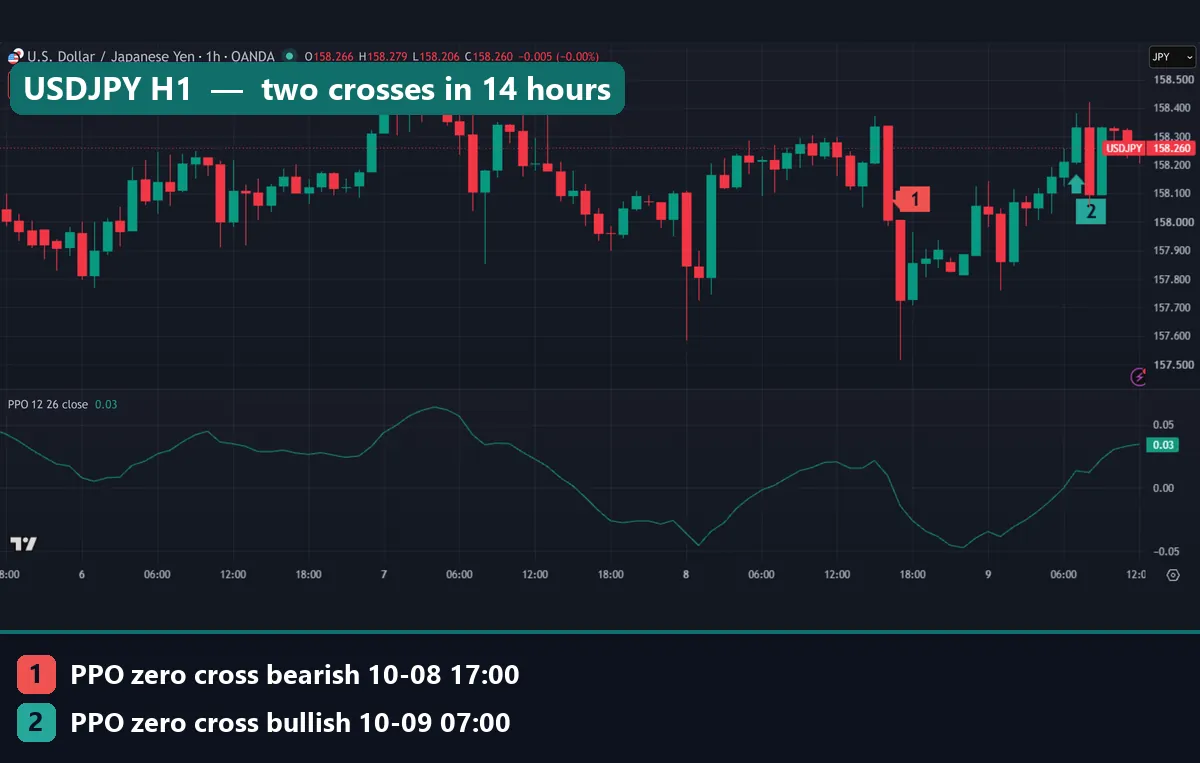
On USDJPY one-hour, the values are tiny. The pane scale runs from about -0.05 to 0.05, because an hourly EMA gap is a small slice of price. Marker 1 is a bearish zero cross at 17:00 UTC on 8 October 2026, with a close at 157.727. Marker 2 is a bullish cross at 07:00 UTC on 9 October, with a close at 158.332. So the line flipped twice in 14 hours.
Worked example: two zero crosses on EURUSD
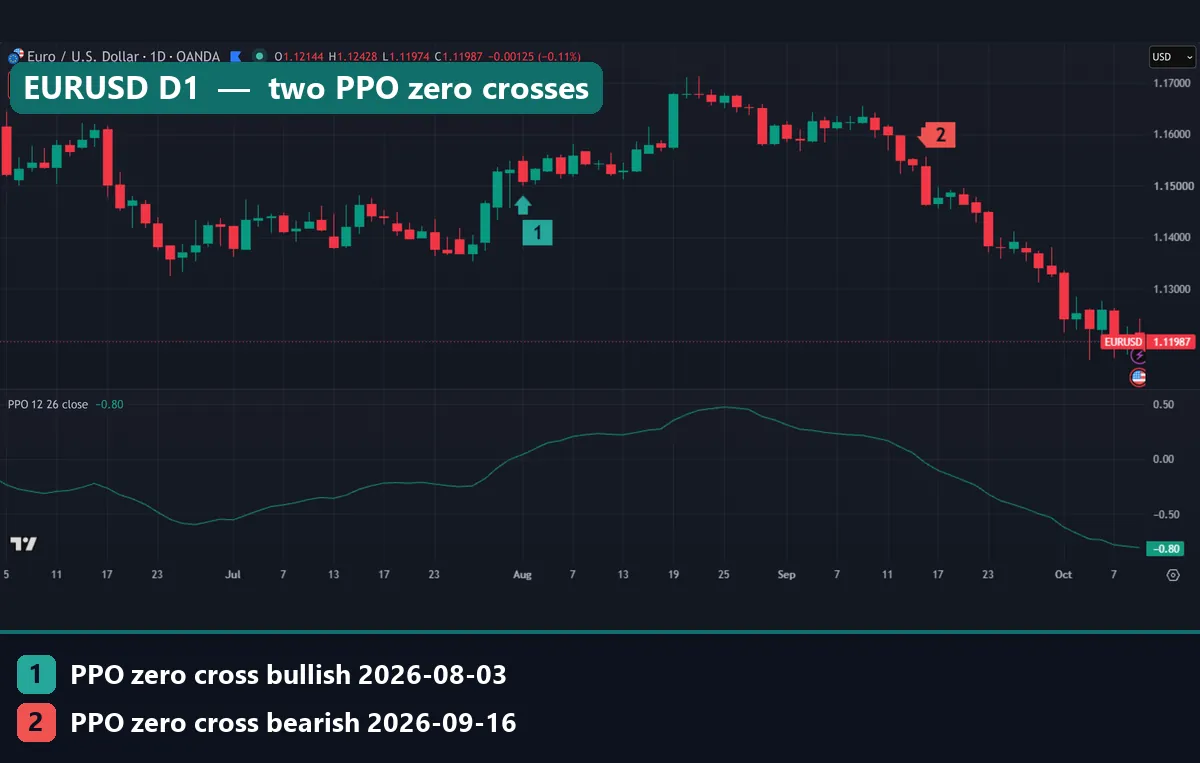
The first chart in this guide, EURUSD daily, holds one full round trip of zero-line crosses.
Marker 1 is the bullish cross on 3 August 2026. EURUSD closed at 1.15084 that day. Next, price rallied to near 1.1700 by late August on the chart, and the PPO peaked just under 0.50. But the line was slow to give that back. Marker 2 is the bearish cross on 16 September 2026, with a close at 1.14638.
Now do the arithmetic. A trader who bought the first cross and sold the second would have exited 44.6 pips below the entry close, before costs. The rally in between was lost to the lag of two moving averages.
The other side of the trade looks better. After the 16 September cross, EURUSD kept falling, and it closed at 1.11987 on the day we captured the chart. That is 265 pips below the cross close. The PPO read -0.80 at the same time. So one rule gave a late exit and then a well-timed short within six weeks. One example proves nothing, which is why we ran the larger test.
What our PPO crossover test found
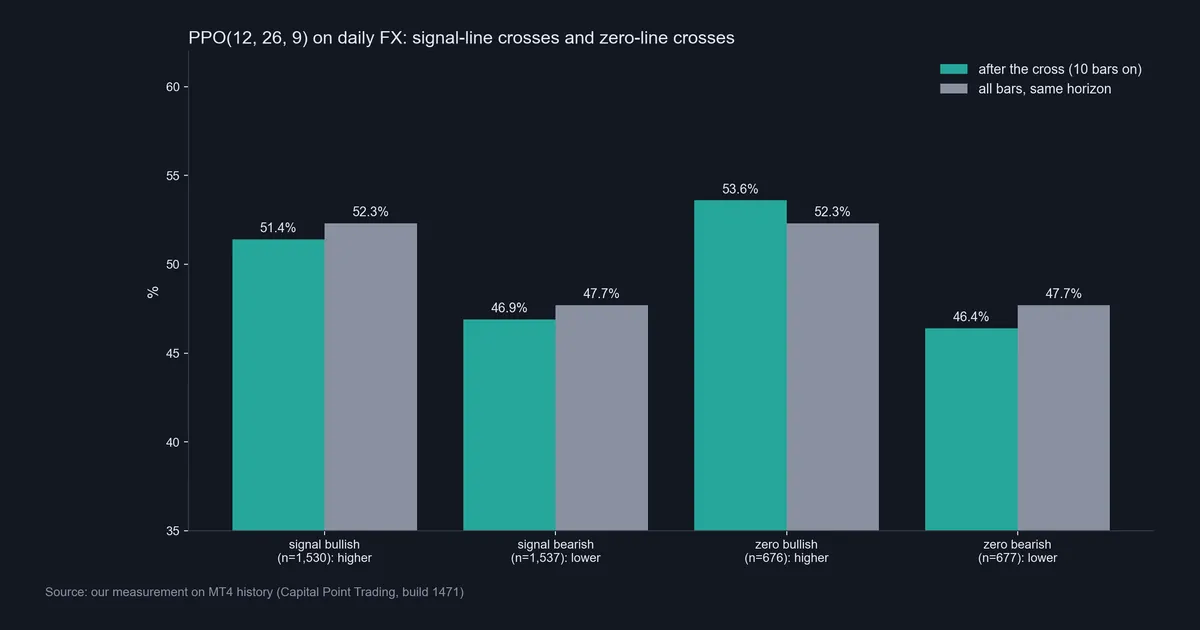
The bar chart above sums up 3,067 signal-line crosses and 1,353 zero-line crosses on daily data. Each teal bar is the share of crosses that moved the expected way after 10 days. Each grey bar is the base rate for all days.
- Bullish signal-line crosses (1,530): 51.4% closed higher 10 days later, against a base of 52.3%.
- Bearish signal-line crosses (1,537): 46.9% closed lower, against a base of 47.7%.
- Bullish zero-line crosses (676): 53.6% closed higher, against 52.3%.
- Bearish zero-line crosses (677): 46.4% closed lower, against 47.7%.
In short, none of the four beat a coin flip weighted by the base rate in a way that matters. Signal-line crosses did slightly worse than doing nothing. The bullish zero cross came out 1.3 points ahead, but bearish zero crosses came out 1.3 points behind. That looks like noise, not an edge.
Frequency matters too. Signal-line crosses fired about 1.76 times per pair per month. Zero-line crosses fired about 0.78 times. So the signal line gives you more than twice as many trades, and none of them carry more information. For more on why a few thousand cases can still mislead, see our note on backtest sample size.
Why the percentage scale matters
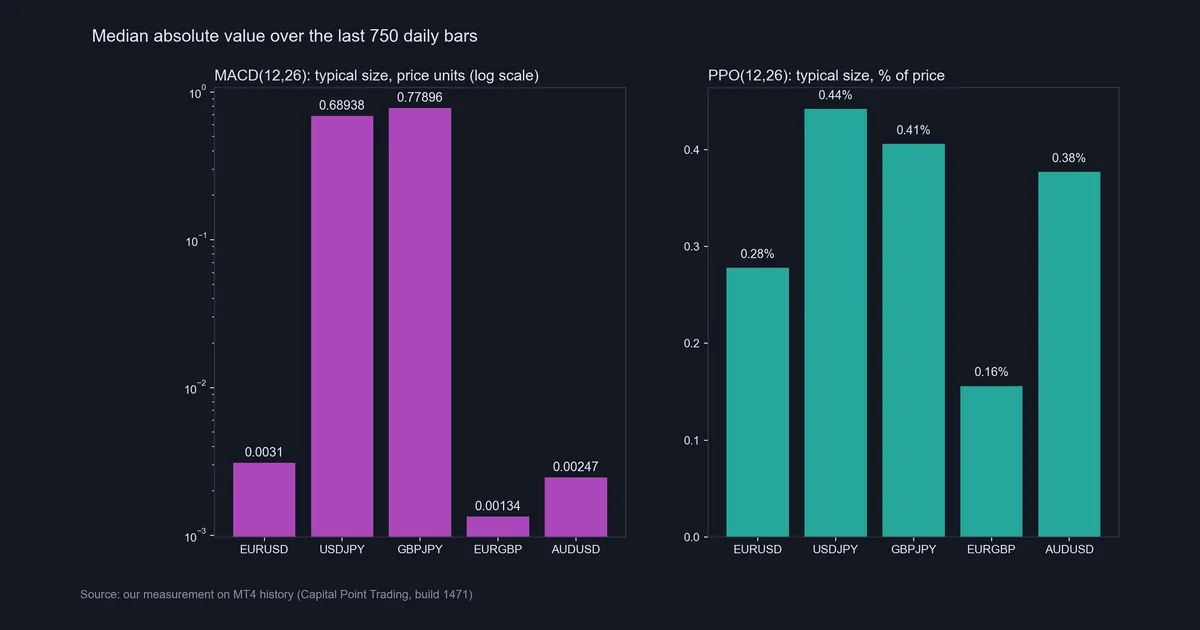
This is where the PPO earns its place. The chart above shows the median absolute value of each line over the last 750 daily bars.
On the left, MACD in price units. EURGBP typically read 0.00134 and EURUSD 0.0031. Meanwhile USDJPY read 0.68938 and GBPJPY 0.77896. The yen pairs print values hundreds of times larger, purely because of their quote size.
On the right, the PPO in percent. EURGBP typically read 0.156%, EURUSD 0.278%, AUDUSD 0.377%, GBPJPY 0.406% and USDJPY 0.442%. Now the bars sit on one plain scale and reflect how far each pair trends relative to its price.
So the practical use is ranking and filtering. For example, you can set one threshold, such as “PPO beyond 0.40”, and apply it to every pair in a scanner. The normalized MACD indicator is another take on the same scaling problem, if you prefer to work in MT4.
Download the complete indicator database
Put these concepts on your charts. One email unlocks the full library of 1,380+ indicators with compiled MT4 and MT5 files, plus my TradingView scripts. No paywall, no spam, unsubscribe any time.
Get free access to my indicator database
One email unlocks 1,380+ free MT4, MT5 and TradingView indicators — the complete library. No single-tool download; you get the whole database.
Where it fails
The PPO has the same weak spots as the MACD, because it is the MACD with a divisor.
- No edge on crosses. Our 4,420 daily crosses landed within about 1.3 points of the base rate. A cross by itself did not tell us the next 10 days.
- Lag. Two EMAs must turn before the line turns. In the EURUSD example, that lag gave back an entire rally and still closed 44.6 pips under the entry.
- Whipsaws near zero. GBPUSD daily crossed below zero on 27 July 2026 at 1.32882. Then it crossed back above on 30 July at 1.34644. A short on the first cross faced 176 pips against it in three days.
- Short timeframes. On USDJPY H1 the line flipped twice in 14 hours. More crosses mean more spread paid, and our test showed no reason to expect each one to pay its way.
- Percent is not volatility. A 0.40% reading can be a calm trend on one pair and routine noise on another.
Also remember that every result here ignores costs. Our guide to backtesting transaction costs shows how quickly spread erodes a frequent-signal rule.
Setting up the PPO and checking it against MACD
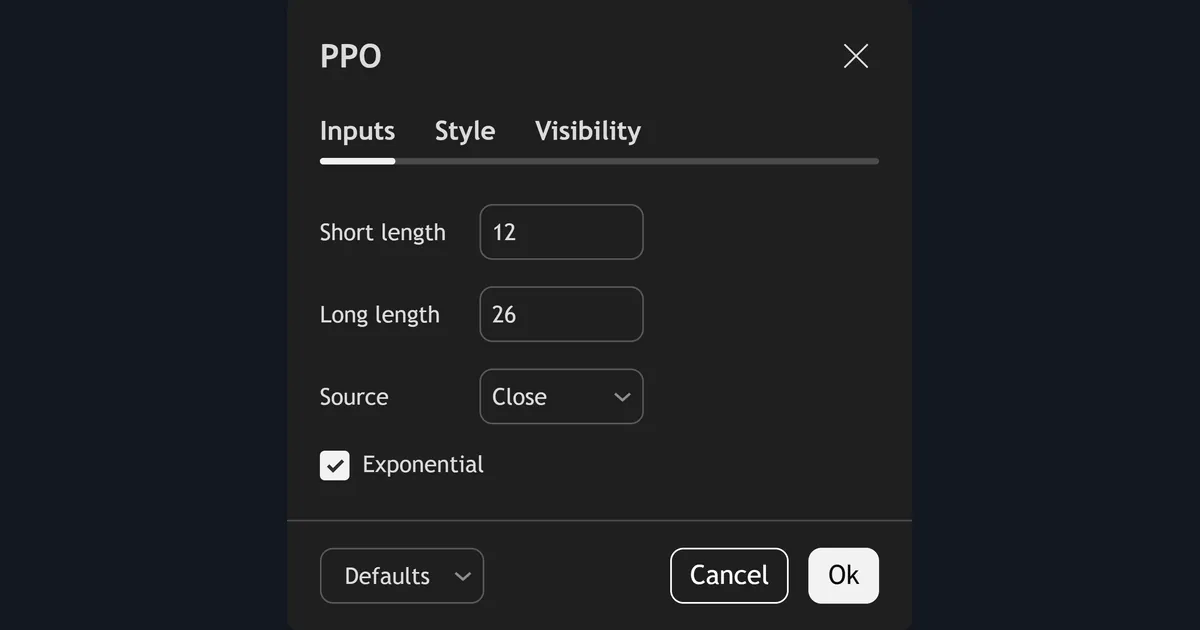
On TradingView, add “Price Oscillator” from the indicators list. Then open its settings. Our dialog shows the four inputs: Short length 12, Long length 26, Source Close, and the Exponential box ticked. The pane title then reads “PPO 12 26 close”. The built-in tool draws no signal line.
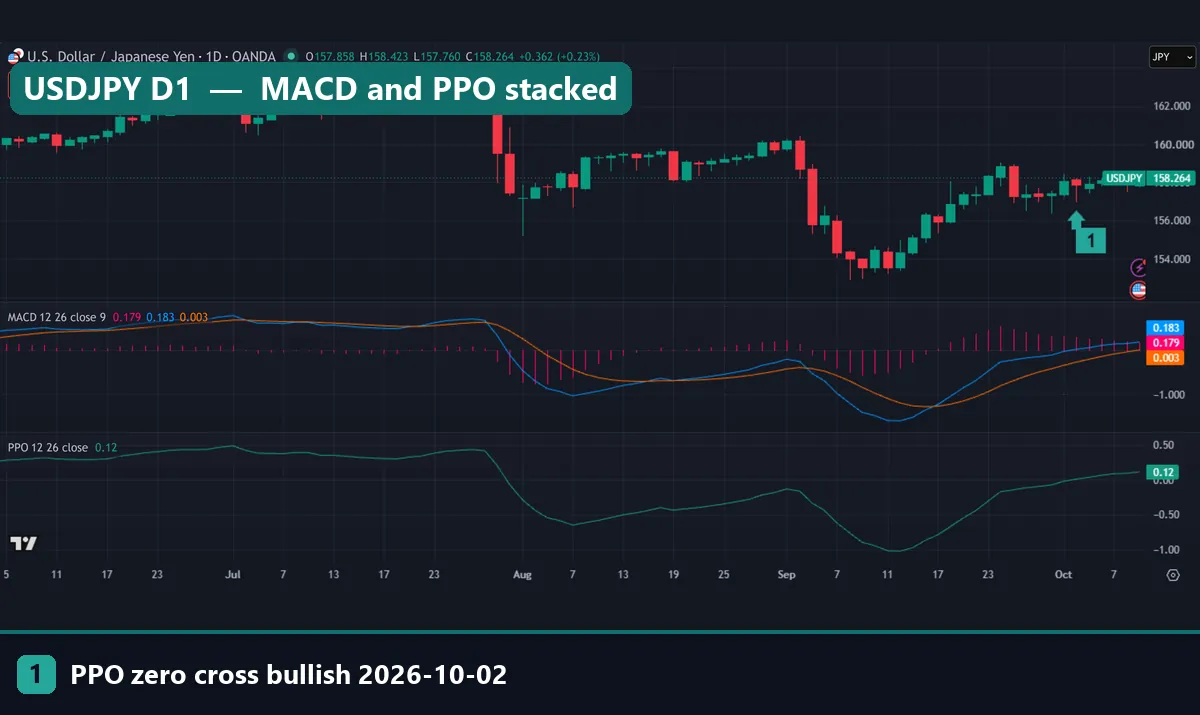
Our USDJPY daily chart carries MACD in the middle pane and PPO below it. The shapes match bar for bar; only the scale differs. MACD read 0.183 in yen at capture, while PPO read 0.12 in percent. Marker 1 is the bullish zero cross on 2 October 2026, with a close at 157.874. Notice that the MACD line crossed zero on the same bar, as the formula says it must.
So if you trade one pair at a time, the two tools give the same signals. The PPO only adds value once you compare across pairs or across long stretches of history, where the price level itself changes.
Common mistakes with the PPO
- Treating it as a new signal. The PPO is the MACD rescaled. If a MACD rule did not work for you, the PPO version will behave the same way on that pair.
- Comparing MACD values across pairs. This is the mistake the PPO exists to fix. A MACD of 0.68 on USDJPY and 0.003 on EURUSD are not “strong” and “weak”. Use percent instead.
- Acting on every cross. Our test found no edge in raw crosses on daily data. Add a filter and test it yourself.
- Reading divergence as a timing tool. A falling PPO against rising price says momentum is fading. It does not say when price will turn. Our guide to divergence in trading explains how long those warnings can run.
Where to go next
If you want the parent indicator first, start with MACD explained. Then read our test of the MACD zero line, which uses the same crossing logic. For context on momentum tools side by side, see MACD vs RSI. The moving averages explained guide covers the EMAs underneath it all.
On MetaTrader, the MACD crossing zero level indicator marks the same zero crosses we tested. Our install guide for MT4 and MT5 indicators walks through setup. For the bigger picture, see trend-following trading. Also, do not confuse momentum oscillators with similar names: the Relative Vigor Index is a different tool.
For outside reading, Investopedia has a short Percentage Price Oscillator definition at Investopedia.
FAQ about the PPO indicator
What does PPO stand for?
PPO stands for Percentage Price Oscillator. It shows the gap between a 12 and a 26 EMA as a percentage of the slower one.
Is the PPO the same as the MACD?
The shape is the same, but the scale differs. MACD prints the EMA gap in price units, while the PPO divides it by the 26 EMA and prints percent. So zero crosses land on the same bar.
What are the default PPO settings?
The usual defaults are 12, 26 and 9, on the close. TradingView’s built-in Price Oscillator takes Short length 12, Long length 26, Source Close and the Exponential box, but it draws no signal line.
Did PPO crosses beat the base rate in your test?
No. Across 23 pairs from June 2018 to August 2026, bullish signal crosses closed higher 10 days later 51.4% of the time against a 52.3% base. Zero crosses sat within 1.3 points of the base rate too.
Why use the PPO instead of the MACD?
Use it when you compare pairs or scan many symbols with one threshold. For example, typical daily MACD was 0.68938 on USDJPY but 0.00134 on EURGBP, while PPO was 0.442% and 0.156%.
Does the PPO work on hourly charts?
Yes, but values get very small and crosses come often. On our USDJPY H1 chart the line crossed zero twice in 14 hours, so costs weigh much more.
Does the PPO use volume?
No. The PPO uses only price, by default the close.
Can I trade PPO crosses on their own?
Our daily test found no edge in raw crosses, before spread, swap and commission. If you use them, add your own filter and test it on your pairs first. As with any indicator, results are not guaranteed; past performance is not indicative of future results.
Last updated: 9 October 2026.

About the author
Written by Dominic Walsh, a Forex trader and MT4/MT5 indicator, Expert Advisor and script developer. Every tool on forexmt4systems.com is tested on live charts before release and ships with ready-to-use compiled MT4 (.ex4) and MT5 (.ex5) files. Learn more about the trader and developer behind this site.
How we build, test and correct every tool: Editorial & Testing Policy. Trading carries risk; see the disclaimer.