
The relative vigor index (RVI) asks one plain question of every bar: did it close nearer its high or its low, compared with where it opened? This guide settles what the indicator measures, how the 1-2-2-1 weighting works, and what its signal-line crosses did on 23 currency pairs. The short answer from our data: the crosses carried no edge. We still show where the line is useful, and where it misleads.
What the relative vigor index is
The RVI is a momentum oscillator. It compares the body of each candle (close minus open) with the full range of that candle (high minus low). So a bar that opens at its low and closes at its high scores close to +1. A bar that does the opposite scores close to -1. A doji scores near zero.
The idea is usually credited to John Ehlers. In rising markets, closes tend to sit above opens, and in falling markets below them. So the “vigor” of a move shows up in where each bar ends.
On TradingView the built-in study is called “Relative Vigor Index”, and its legend reads RVGI. MetaTrader 4 and MetaTrader 5 also ship a built-in version named Relative Vigor Index. All three draw two lines in a separate pane: the RVI itself and a signal line. In our captures the RVI line is green and the signal line is red.
It belongs to the same family as the stochastic oscillator. The stochastic places the close inside the recent high-low range. The RVI, by contrast, measures the close against the open. That makes it a body-versus-range tool, not a location tool.
How the relative vigor index is calculated
The raw idea for a single bar is (close - open) / (high - low). That number jumps around too much to read, so the indicator smooths it twice.
First, the numerator and the denominator each get a 4-bar weighted average. Then each weighted series is summed over the length setting, which is 10 bars by default. Finally, the RVI is the summed numerator divided by the summed denominator.
num(t) = [ (C-O)t + 2(C-O)t-1 + 2(C-O)t-2 + (C-O)t-3 ] / 6
den(t) = [ (H-L)t + 2(H-L)t-1 + 2(H-L)t-2 + (H-L)t-3 ] / 6
RVI    = sum of num over 10 bars / sum of den over 10 bars
Signal = [ RVI + 2 RVI(t-1) + 2 RVI(t-2) + RVI(t-3) ] / 6
Because both sums cover the same bars, the result stays between -1 and +1. In practice it rarely gets near either end. On our charts the line mostly lives between -0.4 and +0.3.
Why the 4-bar weighting is 1-2-2-1
The 4-bar weighting is a symmetric moving average. The two middle bars count double, and the two outer bars count once. The weights add to 6, so the result is divided by 6.
This shape is a cheap low-pass filter. It removes a lot of bar-to-bar jitter, but it adds about one and a half bars of delay. The signal line then uses the same 1-2-2-1 weights on the RVI values. So the signal line is simply the RVI, smoothed again and pushed back in time.
That detail explains every cross on the chart. A cross only means the RVI has turned faster than its own smoothed copy. It does not mean a new trend has started. For a broader look at that delay, see our guide to leading vs lagging indicators.
How we tested the RVI
We ran a statistical check on MetaTrader 4 history, then read live TradingView charts.
- History test: MetaTrader 4, build 1471 (Capital Point Trading terminal history, read from .hst files). Daily bars on 23 FX pairs, from 12 June 2018 to 24 August 2026. We also ran the same rule on H1 bars for four symbols.
- Rule: RVI length 10, signal from the 1-2-2-1 weights. A bullish cross is the RVI closing above its signal line; a bearish cross is the reverse.
- Outcome: was price higher (after a bullish cross) or lower (after a bearish cross) 10 bars later? Then we compared that with all bars over the same 10-bar horizon.
- Chart reads: TradingView web chart, OANDA data, built-in Relative Vigor Index at length 10. We used EURUSD D1, GBPUSD H1, XAUUSD D1, USDJPY H1 and AUDUSD D1. Shots were taken on 9 October 2026.
All results are before spread, swap and commission. Our method follows the site’s editorial testing policy.
RVI settings and parameters
TradingView has two inputs and MetaTrader one. The formula fixes everything else.
| Parameter | Default | What it does | Effect of changing it |
|---|---|---|---|
| Length (TradingView) / Period (MetaTrader) | 10 | Number of bars summed in the numerator and denominator | Lower values react faster and cross more often; higher values smooth more and lag more |
| Offset (TradingView) | 0 | Shifts the plot left or right on the chart | Cosmetic only; a positive offset hides nothing but can confuse reads |
| Signal weighting | 1-2-2-1 over 4 bars | Smooths the RVI into the signal line | Not editable on the built-in study |
| Price inputs | Open, high, low, close | Body and range of each bar | Not editable; there is no “source” input |
The MetaTrader 5 help page calls 10 the best period. A shorter length simply produces more crosses.
Reading the RVI on a chart
There are three things to read. First, the side of zero: above zero means bodies have been closing up on balance over the window. Second, the slope of the green line. Third, whether green sits above or below red.
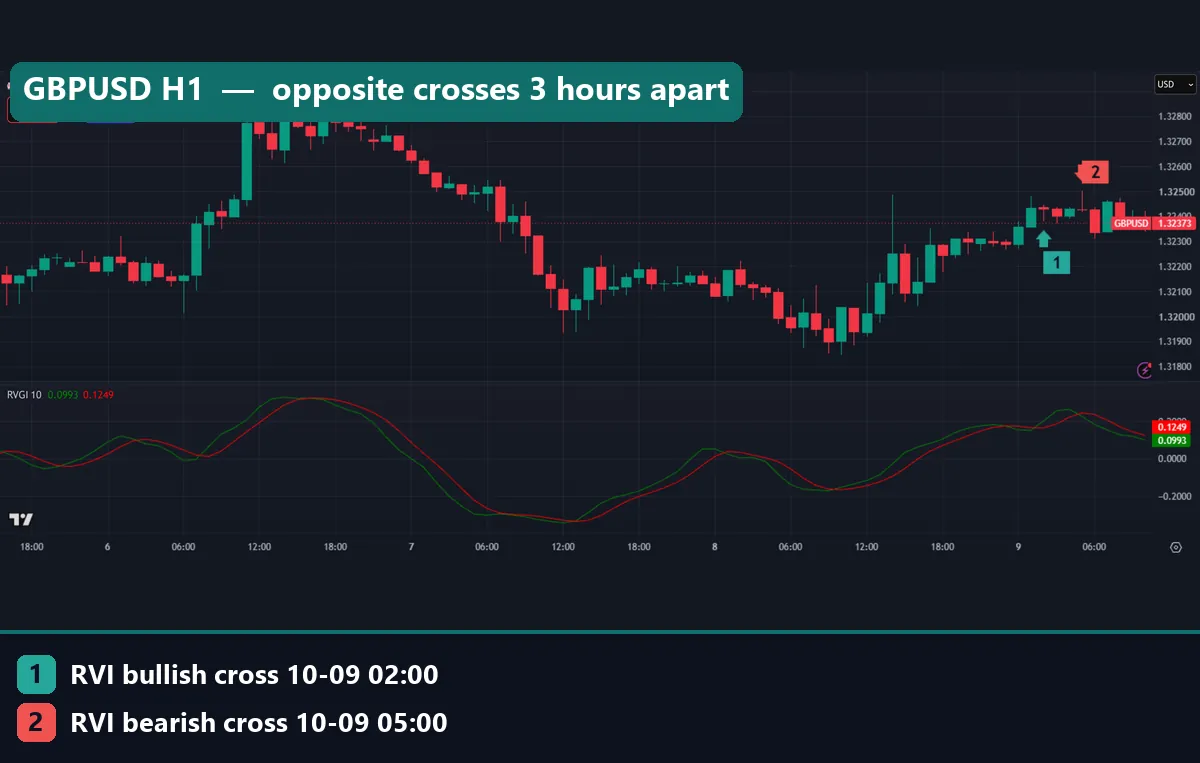
The GBPUSD H1 chart shows the usual problem on fast charts. Marker 1 is a bullish cross on the 02:00 UTC bar of 9 October. Marker 2 is a bearish cross on the 05:00 UTC bar, just three hours later. The 02:00 bar closed at 1.32432 and the 05:00 bar at 1.32428. So price moved 0.4 pips between two opposite signals. At capture, the RVGI read 0.0993 and the signal 0.1249. Both lines were flat and close together, which is when crosses cluster.
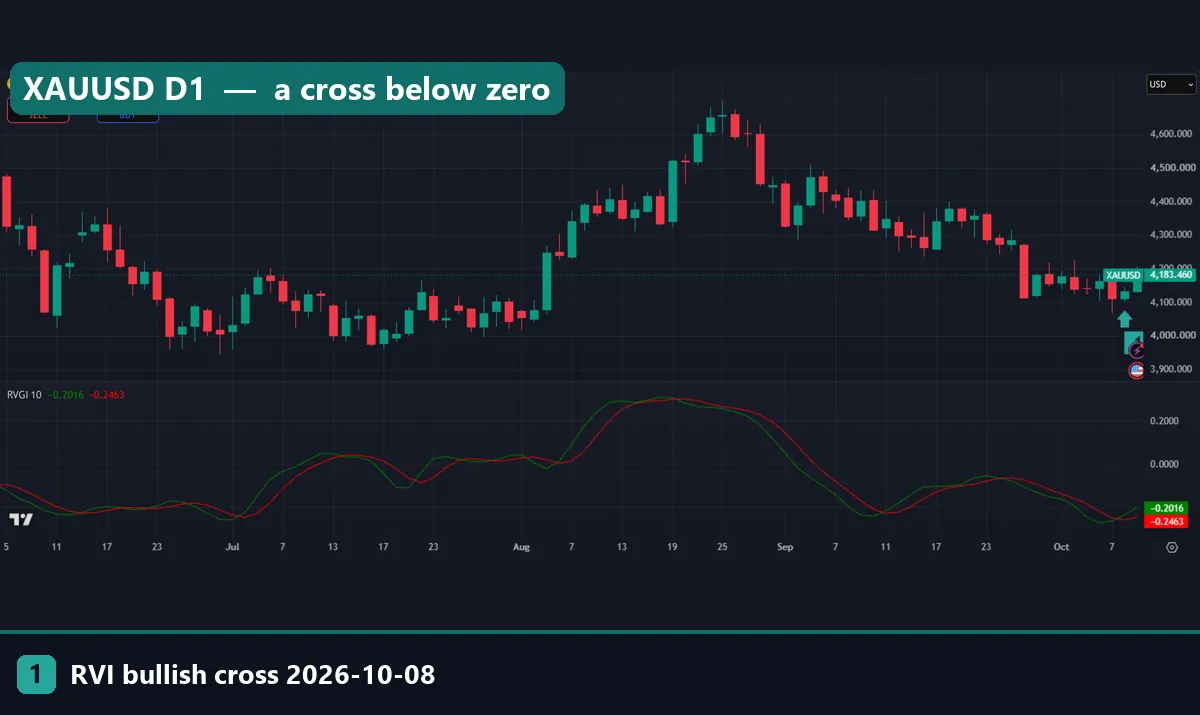
Gold on the daily chart shows a cross from deep below zero. Marker 1 is the bullish cross on 8 October 2026. That bar opened at $4,112.73 and closed at $4,133.69, a $20.96 body inside a $42.68 range. However, both lines were still well below zero. At capture they read -0.2016 and -0.2463. A cross down there says the selling pressure is easing. It does not say buyers are in control.
Worked example: EURUSD daily, October 2026
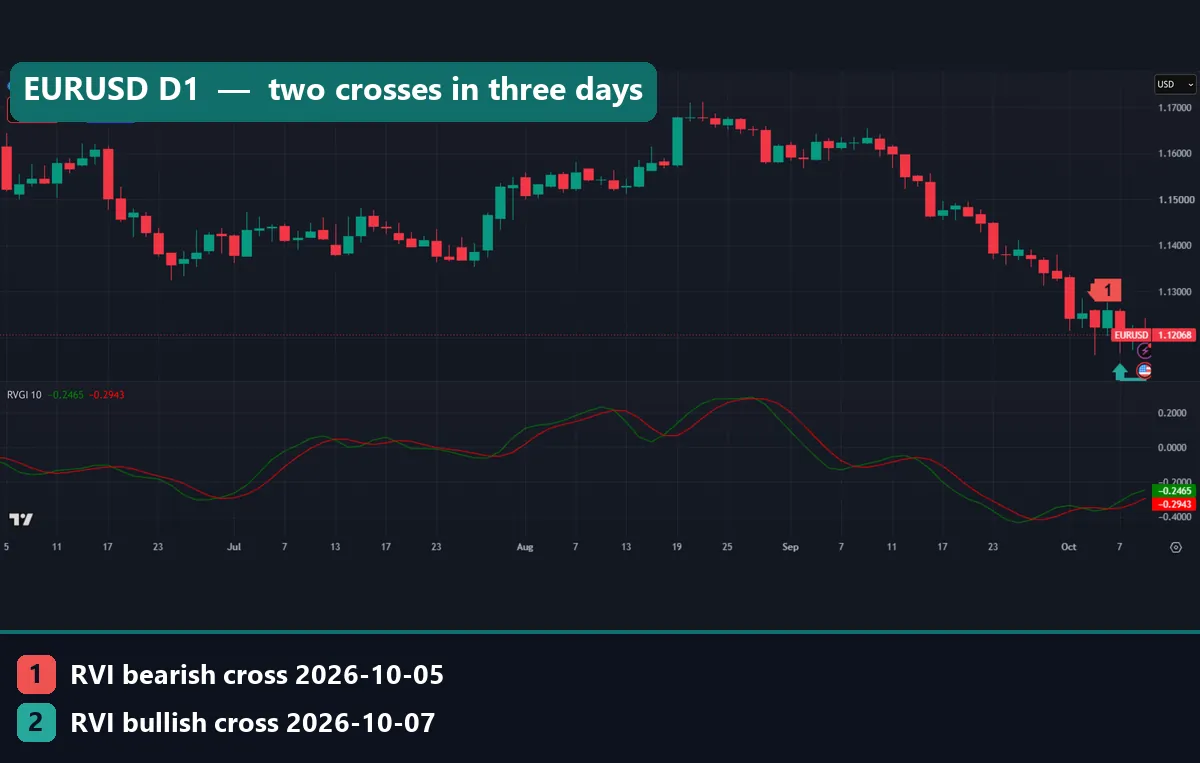
Look back at the EURUSD daily chart at the top. Marker 1 is a bearish cross on 5 October 2026. Marker 2 is a bullish cross two days later, on 7 October (its number box sits off the bottom of the frame, below the green arrow).
Here are the two bars from our data:
- 5 October (bearish cross): open 1.12596, high 1.12614, low 1.11612, close 1.12232. Body -36.4 pips, range 100.2 pips, so the single-bar ratio is about -0.36.
- 7 October (bullish cross): open 1.12576, high 1.12632, low 1.11646, close 1.11959. Body -61.7 pips, range 98.6 pips, so the single-bar ratio is about -0.63.
Now the surprise. The bullish cross printed on a red day with a larger bearish body than the bearish-cross day. That is not a bug. The RVI is a 10-bar ratio of sums, and the signal lags it, so the line can fall and still end above a signal that fell faster.
At capture, the RVGI read -0.2452 and the signal -0.2941. The pair closed the 9 October bar at 1.12133. That is 17.4 pips above the 7 October close, but two bars prove nothing. The cross said the downswing had slowed, nothing more. For more context on this pair, our EURUSD technical analysis guide covers the daily structure.
What 6,553 daily crosses did
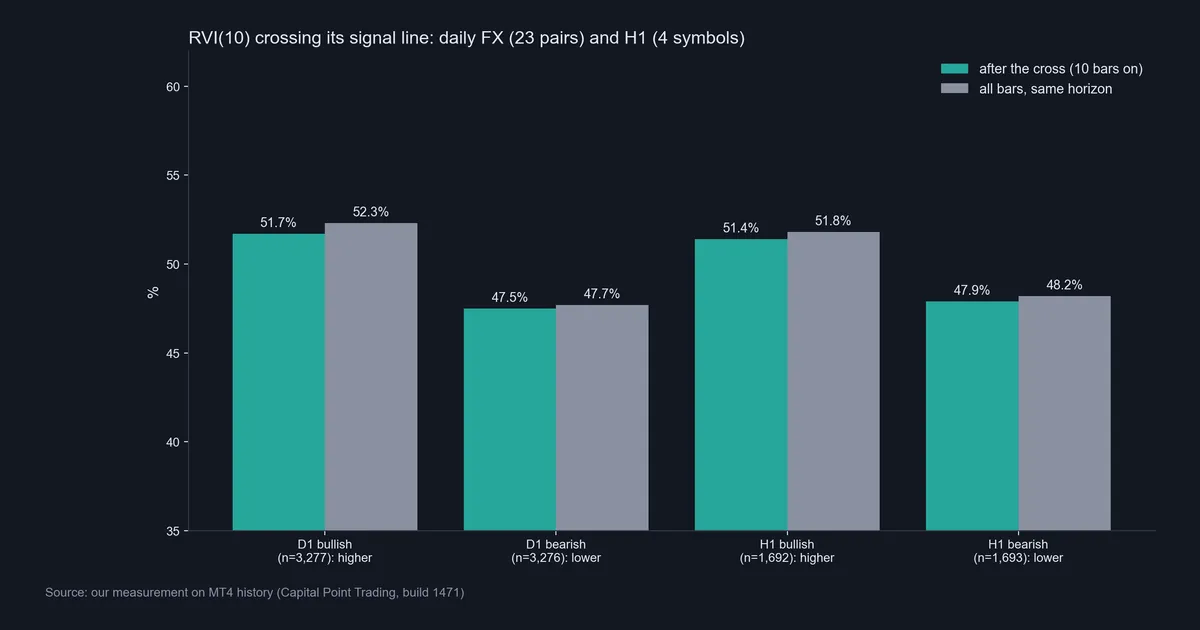
Our history test found 3,277 bullish and 3,276 bearish crosses on the daily charts of 23 pairs. Ten days after a bullish cross, price was higher 51.7% of the time. But across all bars, price was higher after 10 days 52.3% of the time. So the bullish cross did slightly worse than picking a random day.
Bearish crosses were no better. Price was lower 10 days later 47.5% of the time, against 47.7% for all bars. On H1, the four symbols gave the same picture: 51.4% after 1,692 bullish crosses versus 51.8% for all bars, and 47.9% after 1,693 bearish crosses versus 48.2%.
In short, the signal-line cross carried no edge in either direction, on either timeframe. Our guide on backtest sample size explains why a few thousand events is enough to judge that.
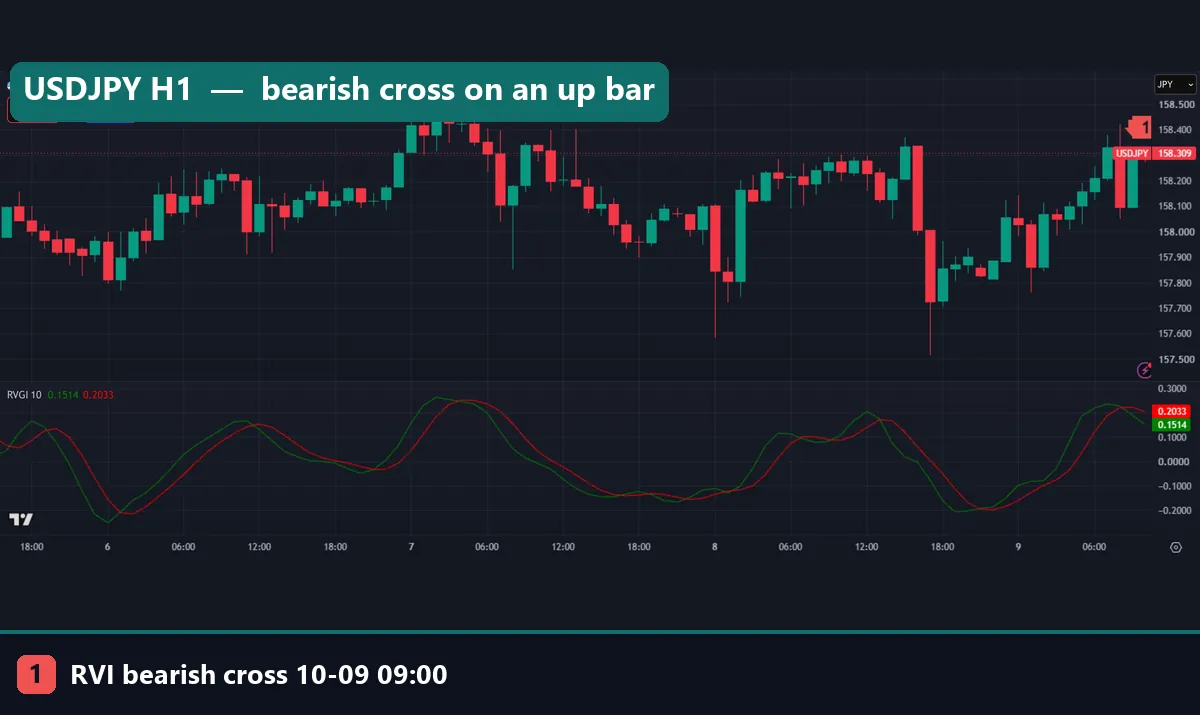
The USDJPY H1 chart shows how odd a single cross can look. Marker 1 is a bearish cross on the 09:00 UTC bar of 9 October. Yet that bar opened at 158.098 and closed at 158.332, a strong up candle. The cross happened because the window and the lag matter more than the latest bar. At capture, the RVGI read 0.1514 and the signal 0.2033.
Download the complete indicator database
Put these concepts on your charts. One email unlocks the full library of 1,380+ indicators with compiled MT4 and MT5 files, plus my TradingView scripts. No paywall, no spam, unsubscribe any time.
Get free access to my indicator database
One email unlocks 1,380+ free MT4, MT5 and TradingView indicators — the complete library. No single-tool download; you get the whole database.
Where it fails
The RVI has clear weak spots.
- No edge on crosses. On 6,553 daily crosses and 3,385 hourly crosses, the follow-through matched or trailed the base rate.
- Whipsaw in flat markets. When both lines hug each other, crosses flip within a few bars. The GBPUSD case had two opposite crosses 0.4 pips apart.
- Lag by design. The 1-2-2-1 weights, plus a 10-bar sum, plus a second smoothing for the signal, all delay the turn.
- Gaps and weekends. The formula uses each bar’s own open. A weekend gap does not count as vigor at all, because it sits between bars.
- Wide bars dominate. Since the RVI divides sums, one news candle can steer the reading for the full window.
Also, any rule built on frequent crosses pays the spread on every trade. Our note on backtesting transaction costs shows how quickly that adds up.
Setting up the RVI on TradingView and MT4
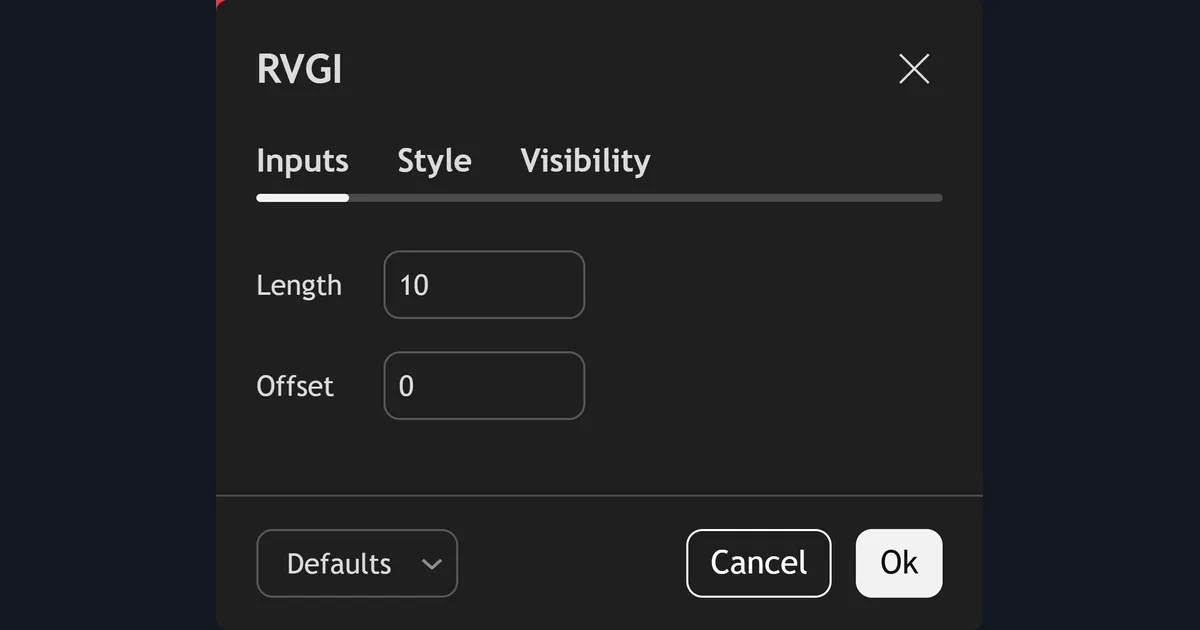
On TradingView, open Indicators and search for “Relative Vigor Index”. The settings box is titled RVGI and shows two inputs: Length 10 and Offset 0. The Style tab only changes colours and line widths.
In MetaTrader 4, the same study sits under Insert, Indicators, Oscillators, Relative Vigor Index. It has one period input. The MetaTrader help notes that the signal line is a 4-period symmetrically weighted average, the same 1-2-2-1 shape described above.
If you change the length, test the new value on a different period of data. Otherwise you are fitting noise, a trap covered in our guide to curve fitting in trading.
A daily cross on AUDUSD
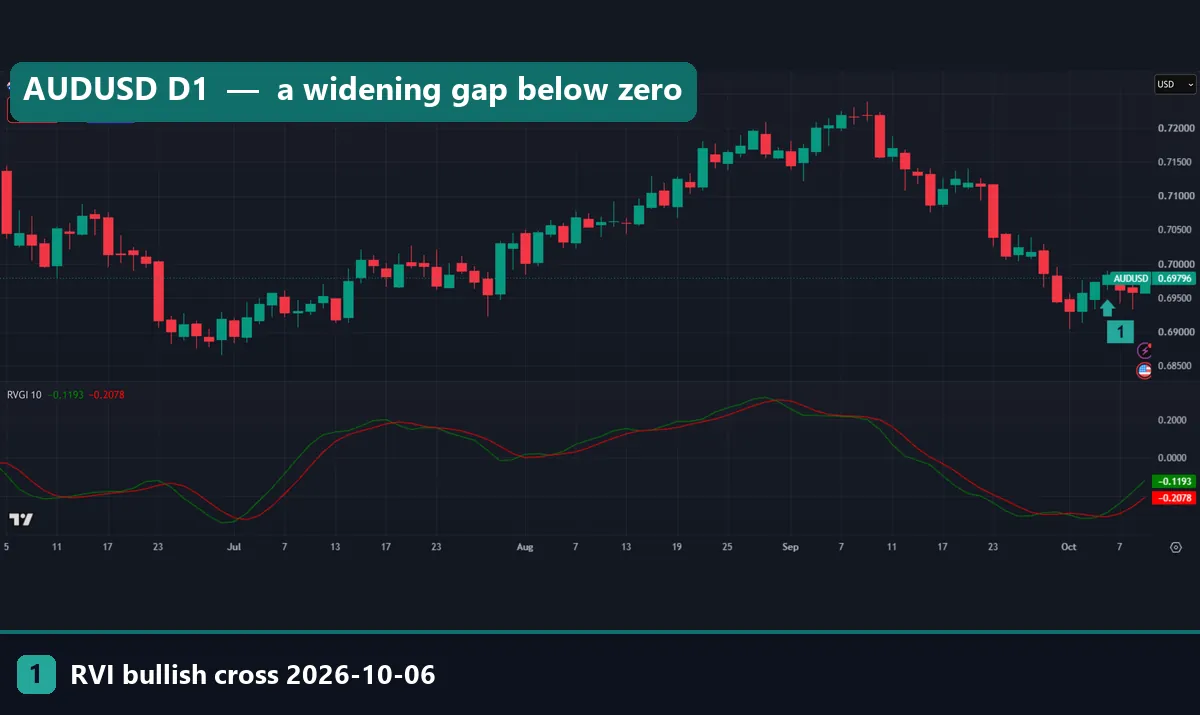
The AUDUSD daily chart shows a calmer case. Marker 1 is a bullish cross on 6 October 2026. That bar opened at 0.69704 and closed at 0.69838, a 13.4-pip body inside a 28.4-pip range. So it was a firm up day, with the close in the upper part of the bar.
At capture, the RVGI read -0.1193 and the signal -0.2078, and the gap between them was widening. Still, both lines sat below zero after a September slide. This is a reasonable way to use the tool: as a description of what the last ten bars did. It is not a forecast of the next ten.
Four common mistakes with the RVI
- Trading every cross. Our data shows crosses alone did no better than random days. A cross is a description, not a trigger.
- Ignoring the zero line. A bullish cross at -0.25 is a different event from one at +0.15. The first says selling has slowed; the second says buying is still in charge.
- Reading the latest candle into the line. As the USDJPY and EURUSD cases show, the cross can point the opposite way to the bar it prints on.
- Stacking it with look-alikes. Adding MACD or a stochastic on top of the RVI repeats the same momentum read. Agreement between similar tools is not independent confirmation.
Divergence is a separate idea and needs its own testing. Our page on what divergence in trading means explains the concept, though we did not test RVI divergence here.
Where to go next
Compare the RVI with these related tools, and test any combined rule before you trust it.
- Our moving average crossover strategy guide, for the trend side of the same lag problem.
- The stochastic momentum index, another close-versus-range oscillator.
- Our multi-timeframe analysis guide, for reading a daily line against an hourly one.
- The daily forex pips study, to see how wide a normal day is before you set a stop.
For primary references, read the Relative Vigor Index page in TradingView’s help center and the RVI calculation in the MetaTrader 5 help. Coders can check the iRVI function in the MQL5 reference. For a short general summary, see the relative vigor index entry at Investopedia.
FAQ: relative vigor index
What does the relative vigor index measure?
It compares each bar’s close-minus-open with its full range, smoothed over 10 bars. Positive values mean closes tended to sit above opens.
What is the default RVI setting?
The default length is 10 on TradingView and the default period is 10 in MetaTrader. TradingView also has an Offset input, set to 0.
What is the RVI signal line?
It is the RVI smoothed with 1-2-2-1 weights over four bars, so it is a lagged copy of the RVI line.
Do RVI crosses predict direction?
Not in our test. After 3,277 bullish daily crosses, price was higher 10 days later 51.7% of the time, against 52.3% for all days. Bearish crosses gave 47.5% against 47.7%.
Why did a bullish cross appear on a red candle?
Because the signal line lags, the RVI can fall on a red day and still end above a signal that fell faster.
Is the RVI the same as the relative volatility index?
No. They share the RVI initials, but the relative volatility index measures the direction of volatility. The relative vigor index compares close with open.
Does the RVI repaint?
Closed-bar values do not change. However, the current bar moves until it closes, so a cross can appear and vanish intrabar.
Can I build a strategy on the RVI alone?
Our data does not support it: the crosses showed no edge on daily or hourly charts, even before costs. Any rule needs its own out-of-sample test, and results are not guaranteed; past performance is not indicative of future results.
Last updated: 9 October 2026.

About the author
Written by Dominic Walsh, a Forex trader and MT4/MT5 indicator, Expert Advisor and script developer. Every tool on forexmt4systems.com is tested on live charts before release and ships with ready-to-use compiled MT4 (.ex4) and MT5 (.ex5) files. Learn more about the trader and developer behind this site.
How we build, test and correct every tool: Editorial & Testing Policy. Trading carries risk; see the disclaimer.