
The MACD zero line is the level where the MACD line changes sign, because the 12-period EMA has crossed the 26-period EMA. This guide settles one question with data: does a cross of that line tell you anything useful about the next two weeks on daily forex charts? We counted 1,353 zero-line crosses on 23 pairs over eight years. The short answer is: barely, and the details below show where the idea helps and where it does not.
What the MACD zero line is
MACD stands for moving average convergence divergence. Gerald Appel built it in the late 1970s, and the MACD article on Wikipedia covers the history. The study plots three things in its own pane: the MACD line, a signal line, and a histogram. The zero line is simply the horizontal level at 0.
So what does it mean when the MACD line sits above zero? It means the fast average is above the slow average. Below zero, the fast average is below the slow one. The zero line is not a support level.
Still, traders watch it for a reason. A cross of zero marks a change in the medium-term trend reading, while a cross of the signal line marks a shorter swing in momentum. If you are new to the study, our MACD explainer covers all three parts. Here we stay on the zero line only.
How the MACD zero line is calculated
The math is short. With the default inputs it reads like this:
MACD line  = EMA(close, 12) - EMA(close, 26)
Signal     = EMA(MACD line, 9)
Histogram  = MACD line - Signal
Now look at the first line again. The MACD line is zero only when both EMAs are equal. So a bullish zero-line cross is exactly the bar where the 12 EMA closes above the 26 EMA. In other words, it is a plain moving average crossover drawn in a different pane.
That fact has two effects. First, the zero cross is slow, because both averages must turn. Second, the signal-line settings cannot change when it happens. Only the fast length, the slow length and the price source can. StockCharts ChartSchool’s MACD article walks through the same steps with a sample table.
The histogram has its own zero line, too. It crosses zero when MACD crosses its signal line. Many traders mix the two up, so keep them apart: the histogram flipping colour is a signal-line event, not a zero-line event.
How we tested
We measured two rules on daily candles from a MetaTrader 4 terminal, build 1471, using Capital Point Trading history. The sample covers 23 FX pairs from 12 June 2018 to 24 August 2026, a total of 37,748 daily candles. No gold or indices went into the statistics.
- Cross study: for each MACD(12, 26) zero-line cross, we checked whether price was higher or lower 10 daily bars later. We did the same for crosses of the 9 EMA signal line. Then we compared both with the base rate across all bars.
- Always-in system: long while MACD is above zero, short while it is below. The position flips at the next daily open after a cross.
Results are percent of price, summed per pair. They are also before spread, swap and commission, because this terminal’s history holds no usable spread data. So every figure below flatters the rule.
The chart examples come from the TradingView web chart with OANDA data, captured on 7 October 2026. They show EURUSD, GBPUSD and XAUUSD on the daily chart and USDJPY on the hourly chart. The cross dates come from our own pass over those bars. Our general method is in the editorial testing policy.
MACD settings used in this guide
TradingView’s built-in MACD has six inputs. Only three of them can move a zero-line cross. The table maps each one.
| Input | Default | Moves the zero cross? | What we used |
|---|---|---|---|
| Fast length | 12 | Yes. Shorter means earlier, more frequent crosses. | 12 |
| Slow length | 26 | Yes. Longer means later, rarer crosses. | 26 |
| Source | Close | Yes, slightly. | Close |
| Signal smoothing | 9 | No. It only moves the signal line and histogram. | 9 |
| Simple ma (oscillator) | Off | Yes. On, the two EMAs become simple averages. | Off |
| Simple ma (signal line) | Off | No. | Off |
We did not test other lengths, so this guide makes no claim about them. For tested alternatives, see our best MACD settings guide. Swing traders can also compare the MACD setting for swing trading notes.
Reading the MACD zero line on a chart
On TradingView’s default MACD, the blue line is MACD and the orange line is the signal. The histogram bars sit around the zero level. The header “MACD 12 26 close 9” lists the inputs, then the histogram, MACD and signal values.
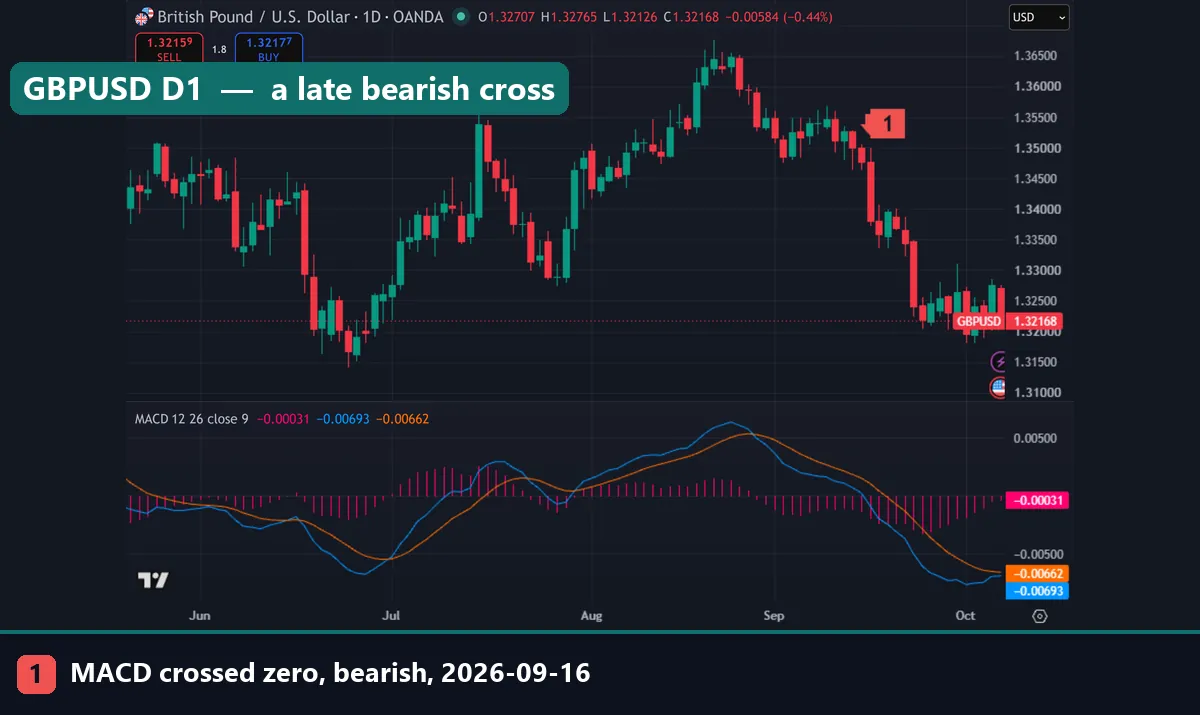
In the GBPUSD daily chart below, marker 1 sits on the 16 September 2026 bar. That day the blue MACD line closed below zero, a bearish zero cross. The pair closed at 1.33804 on that bar and showed 1.32202 at capture, about 160 pips lower. But notice the timing. The peak near 1.365 came in late August, weeks earlier. By the zero cross, much of the drop had already happened.
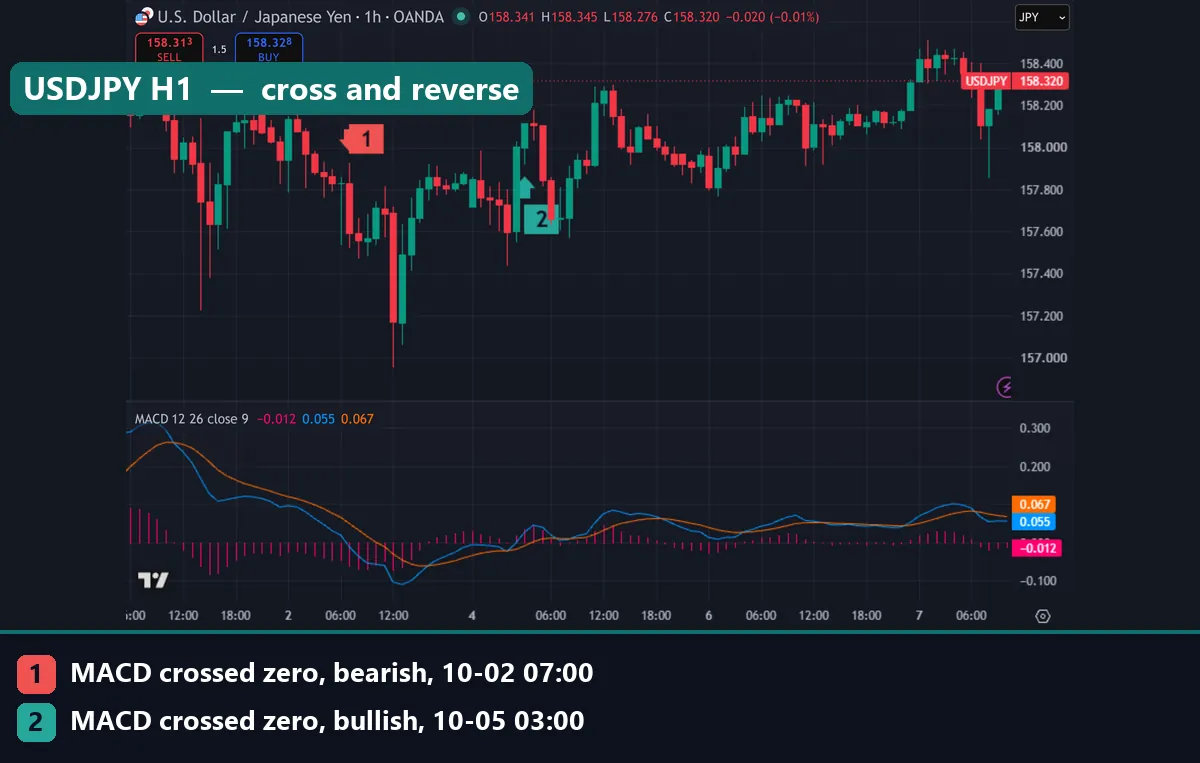
The hourly USDJPY chart shows the same idea on a faster clock. Marker 1 is a bearish cross at 07:00 UTC on 2 October, with a close of 157.590. Marker 2 is the bullish cross at 03:00 UTC on 5 October, with a close of 158.115. In between, price dipped toward 157.00, and then it climbed back. So a short taken at marker 1 and closed at marker 2 lost 52.5 pips on close prices.
In short, the zero line confirms a move. It does not call the turn.
Worked example: EURUSD daily, August to October 2026
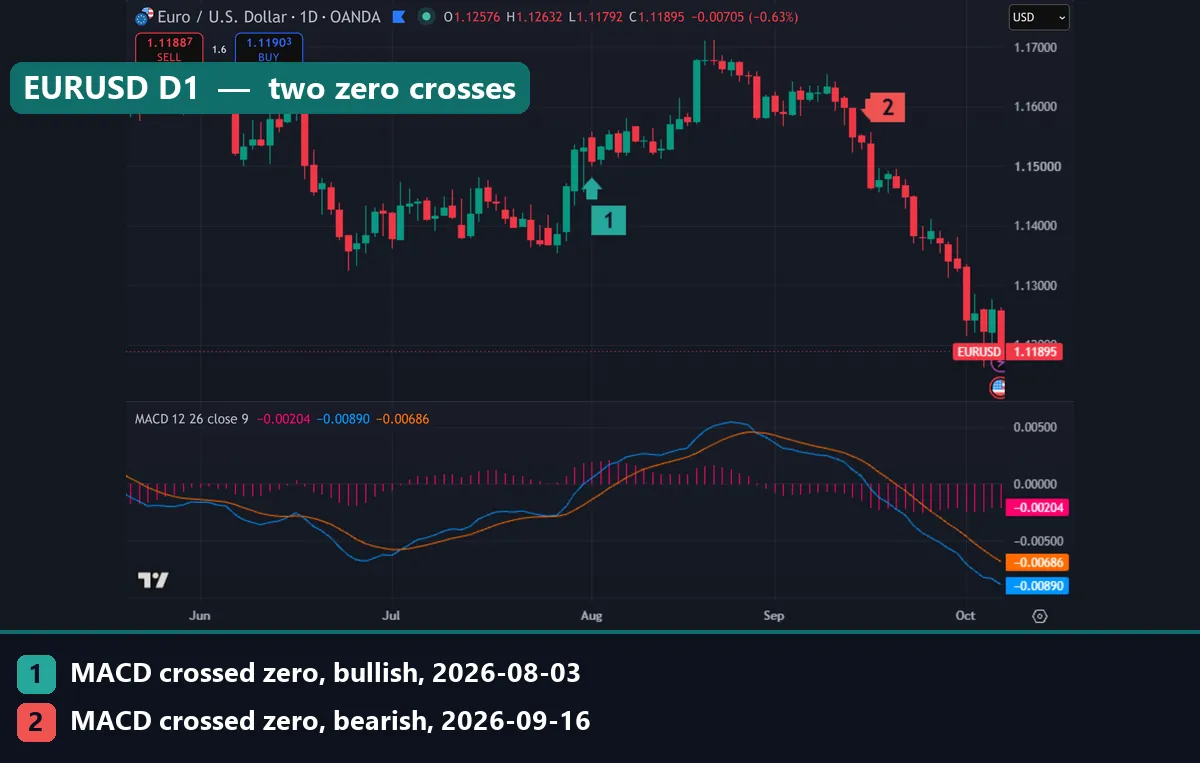
The first chart in this guide holds two marked zero crosses. Here is the arithmetic at the cross-bar closes. Our test entered at the next open, so real fills would differ slightly.
- 3 August 2026, bullish cross. EURUSD closed at 1.15084. The always-in rule turns long.
- Mid to late August. Price rallied to near 1.17000. Then, on 28 August, MACD crossed below its signal line at a close of 1.15821. Yet MACD stayed above zero, so the zero-line rule held the long.
- 16 September 2026, bearish cross. EURUSD closed at 1.14638. The rule flips short. Close to close, the long leg lost about 45 pips, even though price had been over 150 pips higher at the peak.
- 7 October 2026, capture. EURUSD showed 1.11902, about 274 pips below the bearish cross close.
That is the typical shape of a zero-line system. It gave back the whole August rally on the way out. Then it caught a good part of the September fall. One example proves nothing, though.
What 1,353 zero-line crosses showed
We counted 676 bullish and 677 bearish zero crosses across the 23 pairs. That works out to 0.78 crosses per pair per month, so fewer than one a month on a daily chart. Signal-line crosses came about twice as often, at 1.74 per pair per month.
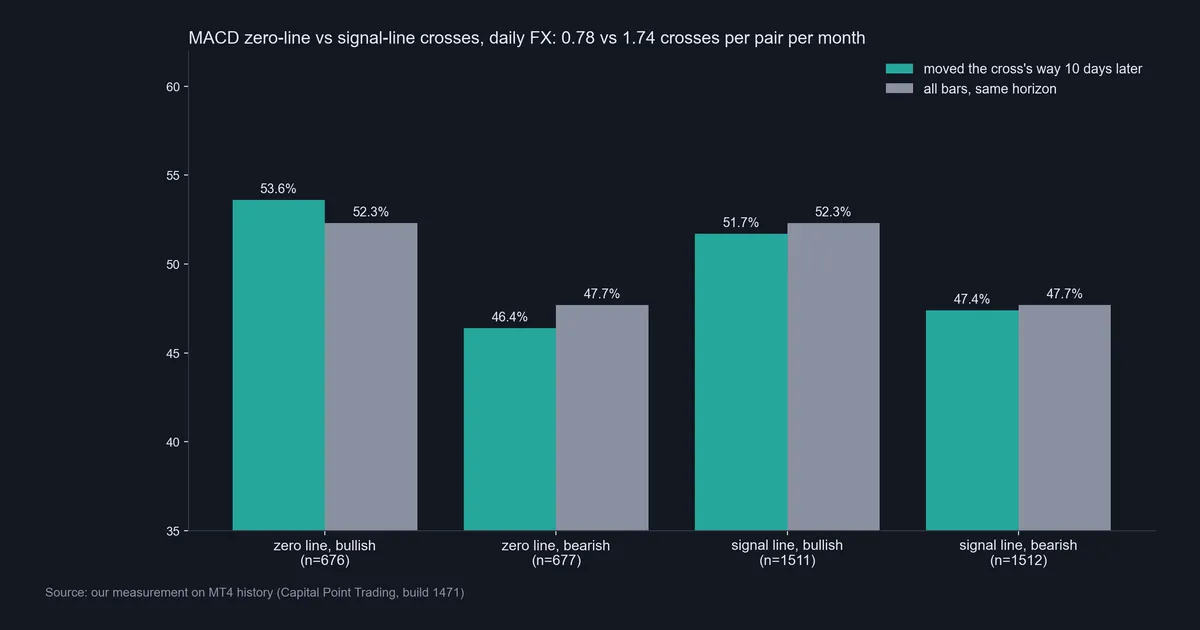
Ten days after a bullish zero cross, price was higher 53.6% of the time. However, across all bars the same 10-day horizon was higher 52.3% of the time. That gap is 1.3 points. After a bearish zero cross, price was lower only 46.4% of the time, against a base of 47.7%. So the bearish cross did slightly worse than doing nothing.
The signal line did no better. Bullish signal crosses led to higher prices 51.7% of the time, and bearish ones to lower prices 47.4% of the time. Both sit just under the base rate. In short, neither cross told us much about the next 10 days on its own.
The always-in system: long above zero, short below
A 10-day test may be too short for a trend tool. So we also ran the always-in system, which holds each position until the next zero cross.
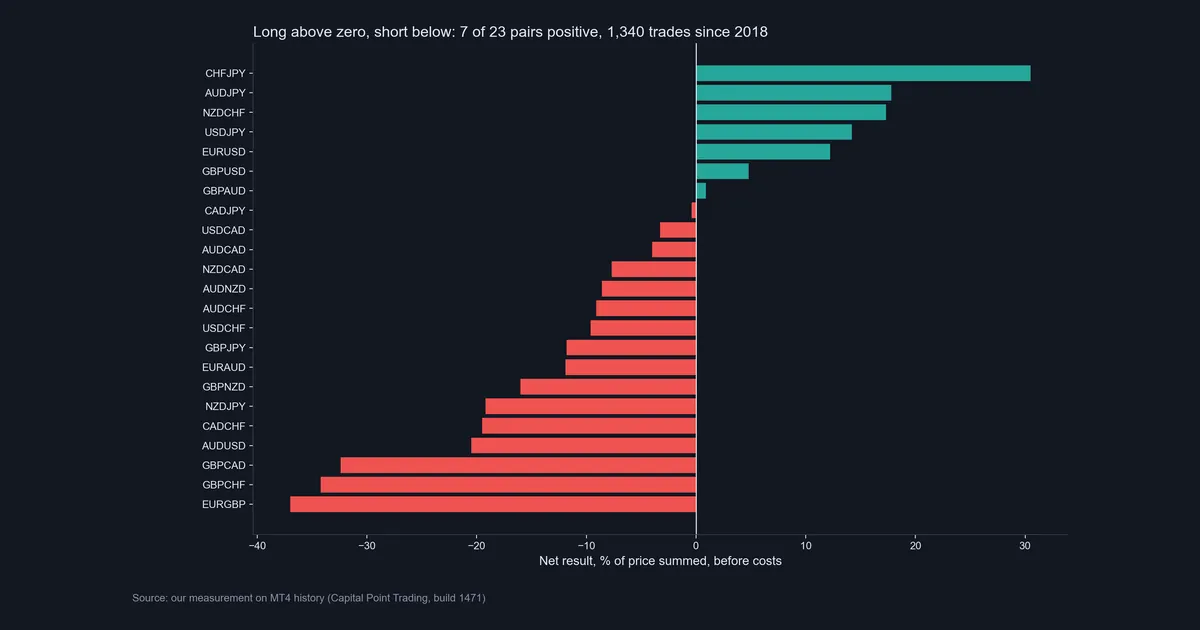
It made 1,340 trades in total. Only 7 of 23 pairs finished positive before costs, and the median pair lost 8.6% of price. CHFJPY did best at +30.5% over 45 trades. EURGBP did worst at -37.0% over 68 trades. EURUSD made +12.2% over 47 trades, while GBPUSD made +4.8%.
Look at the share of trades that made money, too. It ran from 18.5% on GBPCHF to 40.4% on EURUSD. Most pairs sat between 25% and 35%. That is normal for trend following: many small losses, then a few long trends that pay for them. When the long trends do not come, the small losses simply add up. Also note the samples: NZDCAD had only 11 trades and AUDCAD 15. A handful of trades is far too few to judge a pair, as our note on backtest sample size explains.
Download the complete indicator database
Put these concepts on your charts. One email unlocks the full library of 1,380+ indicators with compiled MT4 and MT5 files, plus my TradingView scripts. No paywall, no spam, unsubscribe any time.
Get free access to my indicator database
One email unlocks 1,380+ free MT4, MT5 and TradingView indicators — the complete library. No single-tool download; you get the whole database.
Where it fails: limits of the MACD zero line
The first limit is lag. Both EMAs must turn before the line crosses, so the cross often lands after the bulk of a move. The GBPUSD chart above shows this: the top came weeks before the bearish cross.
The second limit is the range. When price goes sideways, the two EMAs converge, and MACD hugs zero. Then small bars flip it. GBPUSD did exactly that in July 2026. MACD crossed below zero on 27 July at 1.32882 and back above on 30 July at 1.34644. A short in that window lost about 176 pips in three days, close to close.
The third limit is cost. A system that is always in the market pays spread on every flip and swap on every night. Our figures exclude both, so the real numbers would be worse. Our guide to backtesting transaction costs shows how quickly that adds up.
Finally, the result is in-sample only. We did not test it on fresh data or with a walk-forward split. CHFJPY may owe its result to a few big trends. So treat the seven positive pairs as a description of the past, not a shortlist.
Defaults and scale across symbols
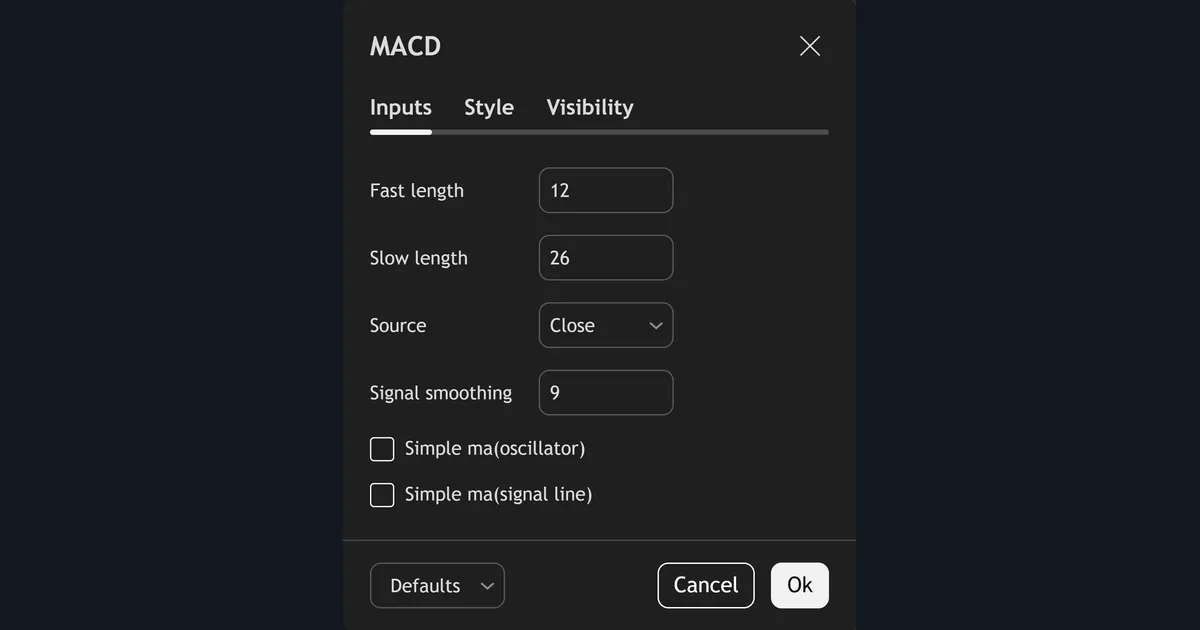
The TradingView settings dialog below shows the defaults we used: fast length 12, slow length 26, source Close, signal smoothing 9, and both “Simple ma” boxes unticked. Changing the first three, or ticking “Simple ma(oscillator)”, will move every zero cross on your chart. The signal smoothing will not.
Next, compare the values in the pane headers. On EURUSD the MACD line read -0.00889 at capture. On gold it read -61.470. That is because MACD is measured in price units. So a level like 0.002 means nothing on gold, and a level like 50 means nothing on a currency pair. The zero line is the one level that means the same thing on every chart.
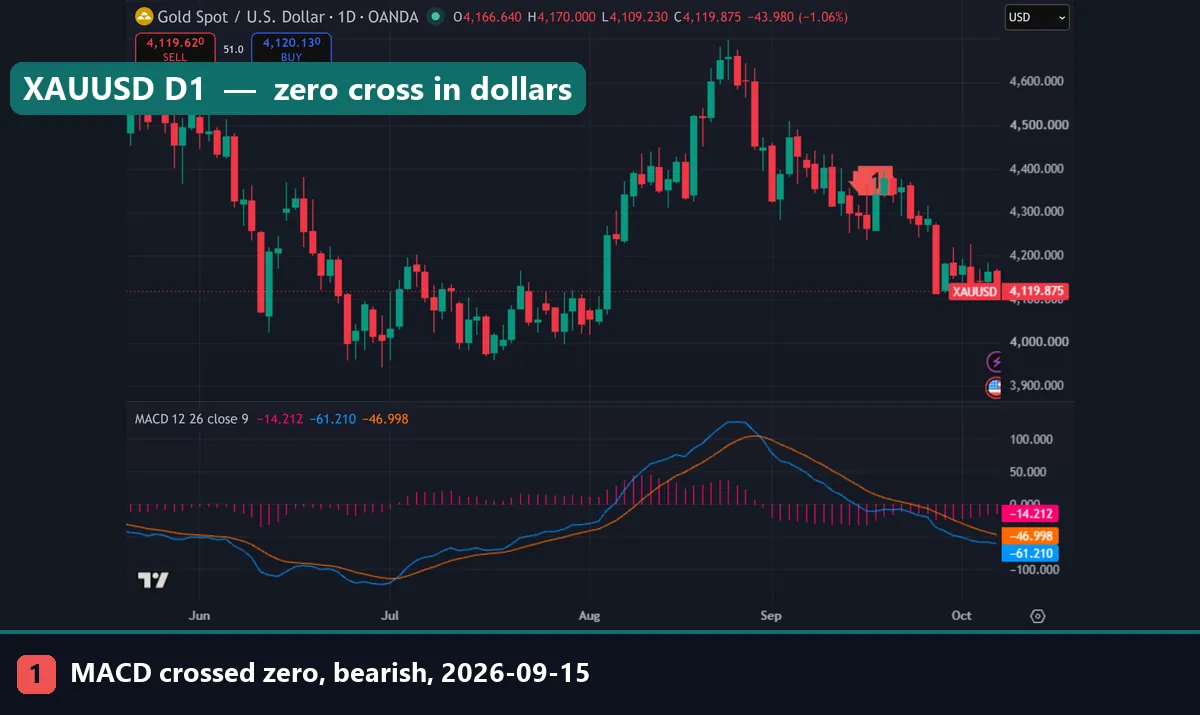
The XAUUSD daily chart marks the bearish zero cross of 15 September 2026, at a close of $4,293.89. The previous bullish cross came on 6 August at $4,240.75. In between, gold traded above $4,600. So the long leg kept only about $53 of that rise. After the bearish cross, gold fell to $4,116.61 at capture, about $177 lower.
Zero line vs signal line: which to watch
They answer different questions. The zero line asks whether the fast average sits above the slow one. The signal line asks whether momentum is speeding up or slowing down. Because of this, the signal line crosses twice as often and reacts sooner, but it also flips on noise.
In our data neither cross beat the base rate by a useful margin. So the choice is about pace, not accuracy. Some traders use the zero line as a direction filter and the signal line for timing. We did not test that combination, so we make no claim about it. For a side-by-side with another oscillator, see MACD vs stochastic. Our leading vs lagging indicators page explains why both crosses arrive late.
On MetaTrader 4, note one platform difference. The built-in MACD draws the MACD line as a histogram and smooths its signal line with a simple average, as the iMACD reference in the MQL4 documentation shows. The zero cross is still the same, because it does not use the signal line.
Common mistakes with the zero line
- Treating zero as support. MACD bouncing off zero is just the two EMAs staying apart. It is not price support, and the chart level can sit far away.
- Confusing the two zero lines. The histogram crosses zero on signal-line crosses. Only the MACD line crossing zero is a zero-line cross.
- Acting on the live bar. On an open bar MACD moves with price, so a cross can appear and vanish before the close. Wait for the bar to close.
- Judging it by one chart. The EURUSD example looks fine after September. The full sample shows 16 of 23 pairs losing money before costs.
Where to go next
- For an alert on this exact event in MetaTrader, see the MACD crossing zero level indicator. The download contains compiled files only.
- For the standard study, see our MACD indicator for MT4 and MT5.
- For faster charts, read the MACD scalping settings guide.
- Trend traders can read our page on trend following trading.
- Before you trust any test, read about walk-forward analysis.
- TradingView’s MACD help page on TradingView lists the built-in study’s inputs and calculation.
FAQ: MACD zero line questions
What does the MACD zero line mean?
It marks where the 12 EMA and the 26 EMA are equal. Above zero, the fast average is higher. Below zero, it is lower.
Is a MACD zero-line cross the same as an EMA crossover?
Yes. With default settings, a zero cross happens on the exact bar where the 12 EMA crosses the 26 EMA.
Does the signal line setting change the zero cross?
No. Signal smoothing only moves the signal line and histogram. The zero cross depends on the fast length, slow length and source.
How often does MACD cross zero on a daily chart?
In our 23-pair test from 2018 to 2026, it crossed 0.78 times per pair per month. Signal-line crosses came 1.74 times per month.
Does a bullish zero cross predict higher prices?
Barely. Price was higher 10 days later 53.6% of the time, against a 52.3% base rate across all bars.
Is the zero line better than the signal line?
It is slower and calmer, not more accurate. Both crosses landed within about 1.3 points of the base rate in our test.
Why are MACD values so different on gold and EURUSD?
MACD is measured in price units. Gold showed -61.470 and EURUSD -0.00889 at capture, so only the zero level compares across charts.
Can I trade the MACD zero line on its own?
Our data does not support it. The always-in rule finished positive on 7 of 23 pairs before costs. Test any rule on fresh data and keep risk small; results are not guaranteed; past performance is not indicative of future results.
Last updated: 7 October 2026.

About the author
Written by Dominic Walsh, a Forex trader and MT4/MT5 indicator, Expert Advisor and script developer. Every tool on forexmt4systems.com is tested on live charts before release and ships with ready-to-use compiled MT4 (.ex4) and MT5 (.ex5) files. Learn more about the trader and developer behind this site.
How we build, test and correct every tool: Editorial & Testing Policy. Trading carries risk; see the disclaimer.