
Pyramiding means adding to a trade that is already in profit, in planned steps, instead of opening the full size at the first signal. This guide settles one question with data: does it help a breakout system? We ran the Turtle System 1 rules on 23 FX pairs with one, two and four units. The extra units cut the average trade from -0.085R to -0.273R before costs, and the worst drawdown more than tripled.
What pyramiding means in trading
Pyramiding builds a position in pieces. You open a first unit on a signal. Then, only if price moves your way by a set distance, you add another. Each add needs the trade to prove itself again, so only trades that already work reach full size.
The name comes from the shape. Classic pyramiding adds smaller units as price rises, so the position is wide at the base and narrow at the top. The Turtles used a flatter version: every unit was sized the same way, from volatility, and one market could hold up to four.
Pyramiding is not averaging down. Averaging down adds to a losing trade, which is the logic behind martingale strategies in forex. Still, the two share one risk: both make the position bigger, so a reversal costs more than it would with one unit.
Platforms treat it as a setting too. In TradingView’s Pine Script strategies documentation, pyramiding is the maximum number of entries a strategy may hold in one direction, and the default is 1. In MetaTrader 4, each add is simply a new order with its own stop. For a short definition, see pyramiding at Investopedia.
How Turtle pyramiding works: a unit every 0.5 N
The Turtle rules size everything with N, the 20-day average true range. A break above the 20-day high opens unit 1 of a long. The stop sits 2N below that entry, and that distance is one R. From there, the position grows on a fixed ladder:
N          = (19 x previous N + today's true range) / 20
next unit  = last entry + 0.5 N  (minus for a short), up to 4 units
stop       = newest entry - 2 N  (one stop for every unit)
exit       = 10-day low for a long, 10-day high for a short, or the stop
The stop line is the one that matters. Each time you add a unit, the stop for all units moves to 2N from the newest entry. The Original Turtle Trading Rules PDF at Trading Blox sets out the same rule. So on a full four-unit long, unit 1 has only 0.5N of room left, while unit 4 has 2N.
Add up the room of all four units (0.5N, 1N, 1.5N and 2N) and the open risk is 5N, or 2.5R. A single unit risks 1R. The full pyramid also sits closer to trouble. After a run of 1.5N, its stop is 2N from the newest price, while a lone first unit would still have 3.5N of room.
How we tested pyramiding
We coded Turtle System 1 on MetaTrader 4, build 1471, with history from Capital Point Trading. The sample covers 23 FX pairs on the daily chart, from 12 June 2018 to 24 August 2026. We allowed one position per pair.
We then ran three versions. The first never adds, and the second adds one unit after a 0.5N gain. A third version adds a unit every 0.5N, up to four. Results are in R, where 1R is one unit’s first 2N risk, so a full position can lose more than 1R. All figures are before spread, swap and commission.
The chart examples come from the TradingView web chart with OANDA daily bars, pulled on 19 October 2026. Our script applied the same rules to those bars and marked each unit and the exit. Gold is not one of the 23 test pairs, so its chart only shows the mechanics. Our editorial testing policy describes how we collect and check data like this.
The settings we used
Only the unit cap and the add rule change between the three versions, so any gap in the results comes from pyramiding alone.
| Parameter | Turtle System 1 | Our three versions | What it controls |
|---|---|---|---|
| Entry | 20-day high or low | Same in all | Opens unit 1 |
| Exit | 10-day low or high | Same in all | Closes every unit at once |
| N | 20-day average true range | Same in all | Stop and add spacing |
| First stop | 2N from entry | Same in all | Defines 1R |
| Add spacing | 0.5N past the last entry | None / 0.5N / 0.5N | When the next unit goes on |
| Unit cap | 4 per market | 1 / 2 / 4 | How big the pyramid gets |
| Stop after an add | 2N from the newest entry | None / yes / yes | Room left for older units |
| Costs | Not in the rules | Left out | Real results would be lower |
If you size units as a share of the account, read our guide to position sizing first. The Turtles sized each unit from N, and our page on ATR position sizing shows that method.
Reading pyramided units on a Donchian chart
Our charts use a 20-day Donchian channel indicator. The blue lines track the 20-day high and low, and the grey line is their midpoint. Teal markers show long units, red markers show short units and the gold marker is the exit. Read the legend as well as the boxes: when units go on during the same candle, their markers stack and only the top number shows.
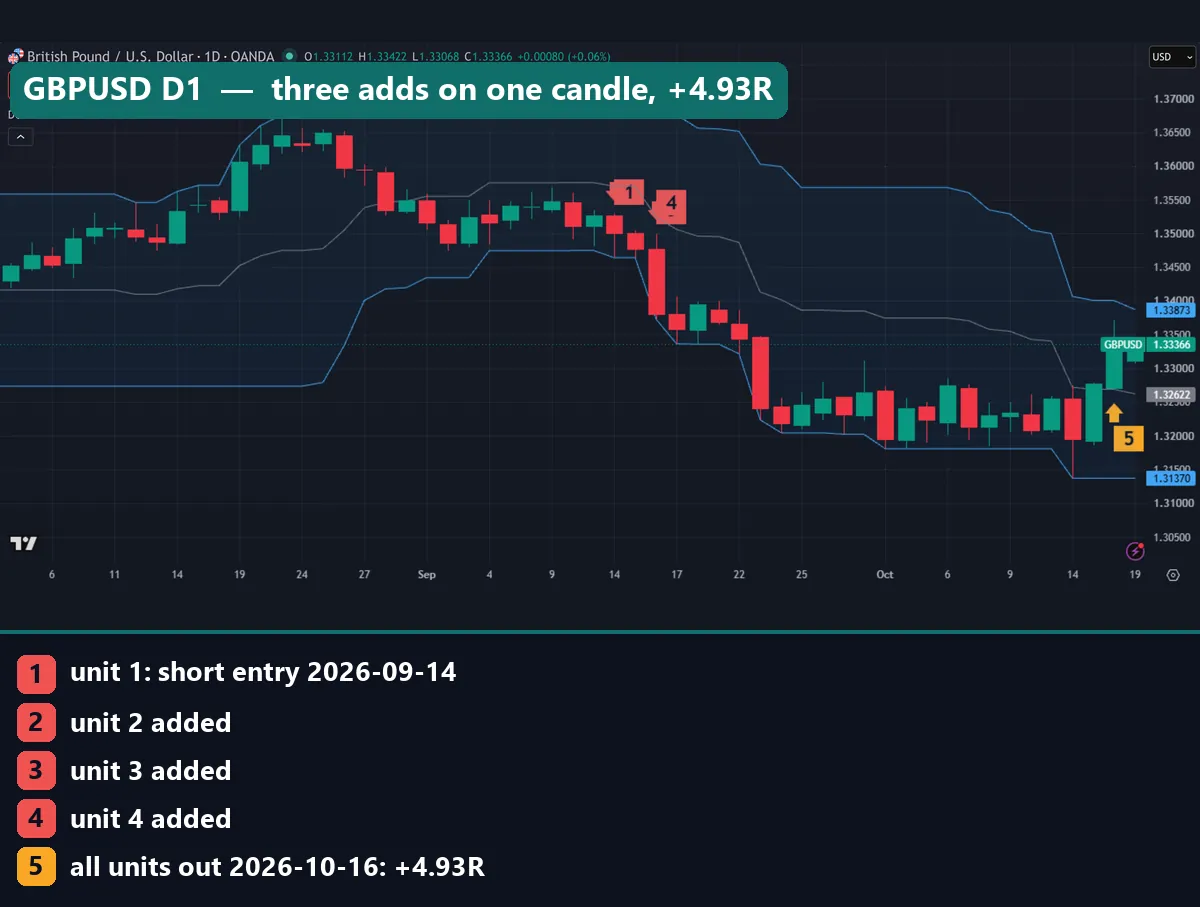
On GBPUSD the short opened on 14 September 2026 at 1.34746. Two days later, one wide red candle triggered units 2, 3 and 4 at 1.34452, 1.34159 and 1.33865. That is why marker 4 sits next to marker 1 with no 2 or 3 in sight. The trade closed on 16 October at 1.32857 for +4.93R. With one unit, the same exit would have paid 1.61R.
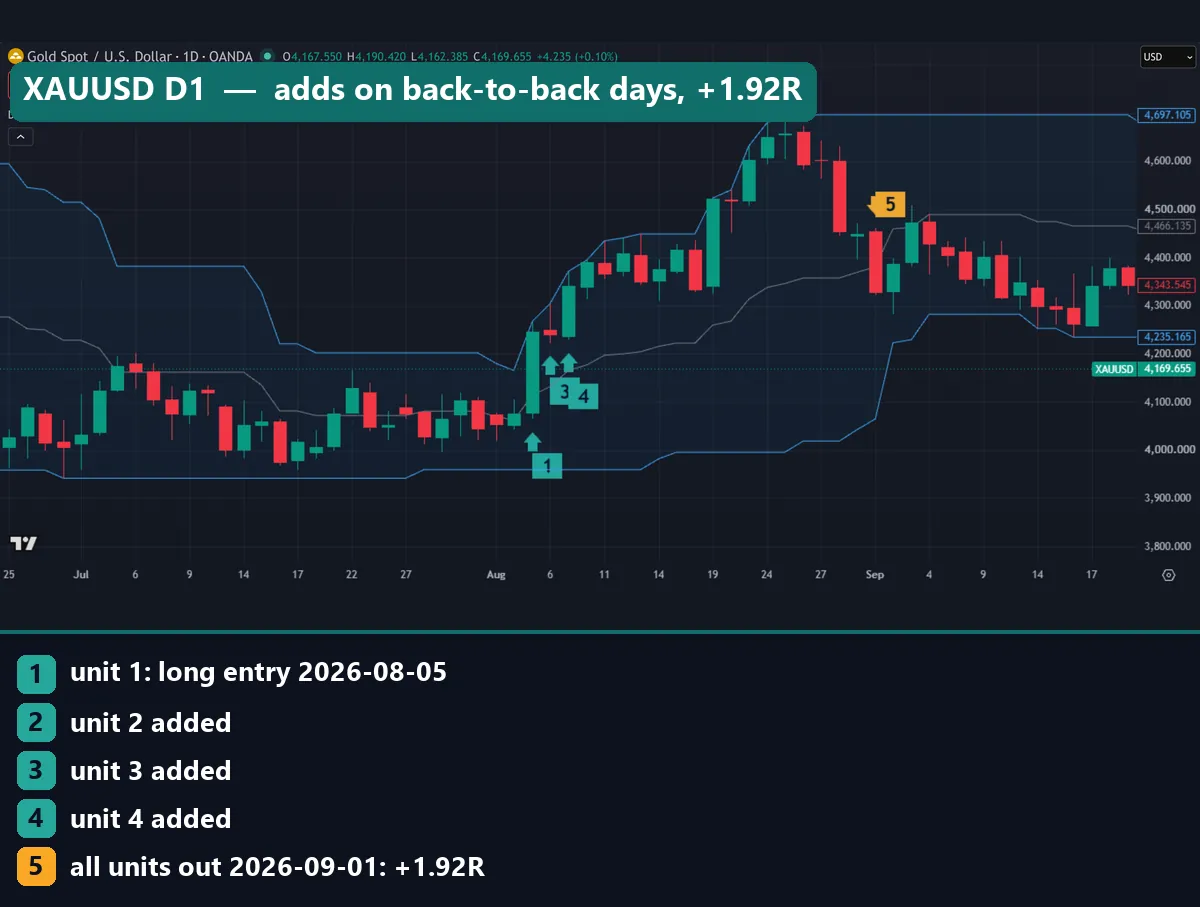
Gold shows adds on back-to-back days. The long opened on 5 August 2026 at 4,166.13 dollars. On 6 August two adds filled at 4,212.45 and 4,258.78, so marker 3 covers marker 2. The last unit came on 7 August at 4,305.10. All four closed on 1 September at 4,324.68 for +1.92R, against 0.86R for one unit.
Worked example: pyramiding EURUSD from July to September 2026
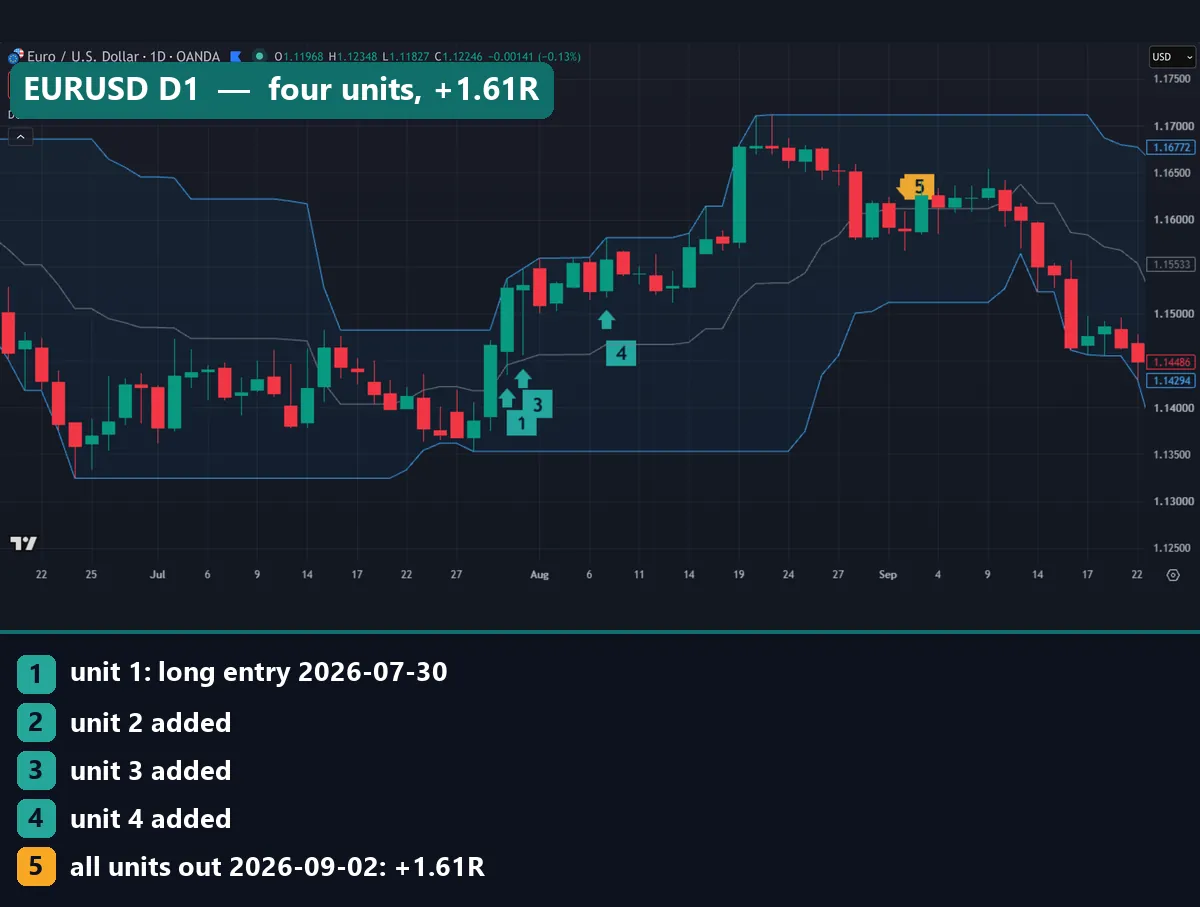
Here is the EURUSD trade from the first chart. N on the entry day was 0.00564, about 56.4 pips. So 0.5N was 28.2 pips, and 2N, one R, was 112.8 pips.
- 30 July 2026: price trades through the 20-day high. Unit 1 opens at 1.14824 with a stop at 1.13696.
- 31 July: one strong candle triggers two adds, at 1.15106 and 1.15388.
- 7 August: unit 4 fills at 1.15670. The stop for all four moves to 1.14542, 2N below unit 4.
- 2 September: price trades through the 10-day low, and every unit closes at 1.15702.
The four units gained 87.8, 59.6, 31.4 and 3.2 pips. That makes 182.0 pips in all, or 1.61R. A single unit would have kept only the first 87.8 pips, which is 0.78R. So on a trade that worked, the pyramid about doubled the result.
Now look at the stop. After the last add it sat at 1.14542, only 28.2 pips below unit 1. Price never traded back down to it, so the pyramid survived. If it had, all four units would have closed together for -2.5R.
What 23 pairs showed: more units, worse results
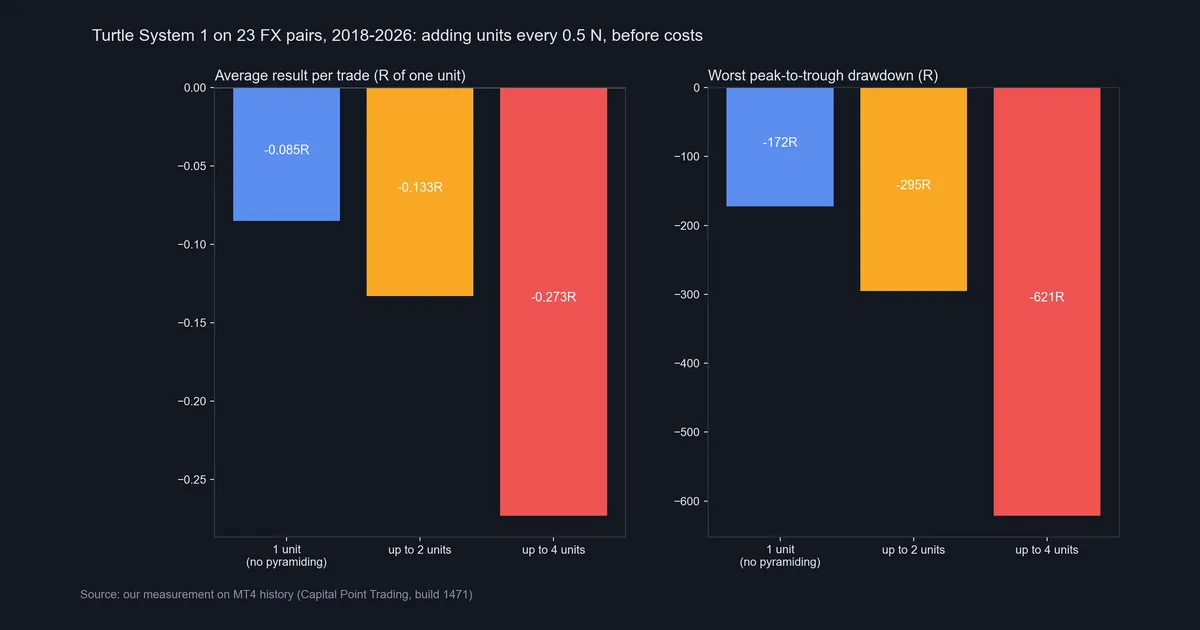
One good chart proves nothing, so here is the full sample. With one unit, System 1 took 1,715 trades and averaged -0.085R. Allowing a second unit pushed the average to -0.133R, and allowing four pushed it to -0.273R. The total went from -146.5R to -233.3R and then -496.6R.
Drawdown grew faster than the losses: -172.3R with one unit, -295.2R with two and -621.1R with four. The share of profitable trades fell from 32.9% to 28.3% and then 20.3%. To be fair, the largest winner rose from 9.5R to 18.8R and 36.7R. But the largest loser also grew, from -1.5R to -2.9R and -4.4R.
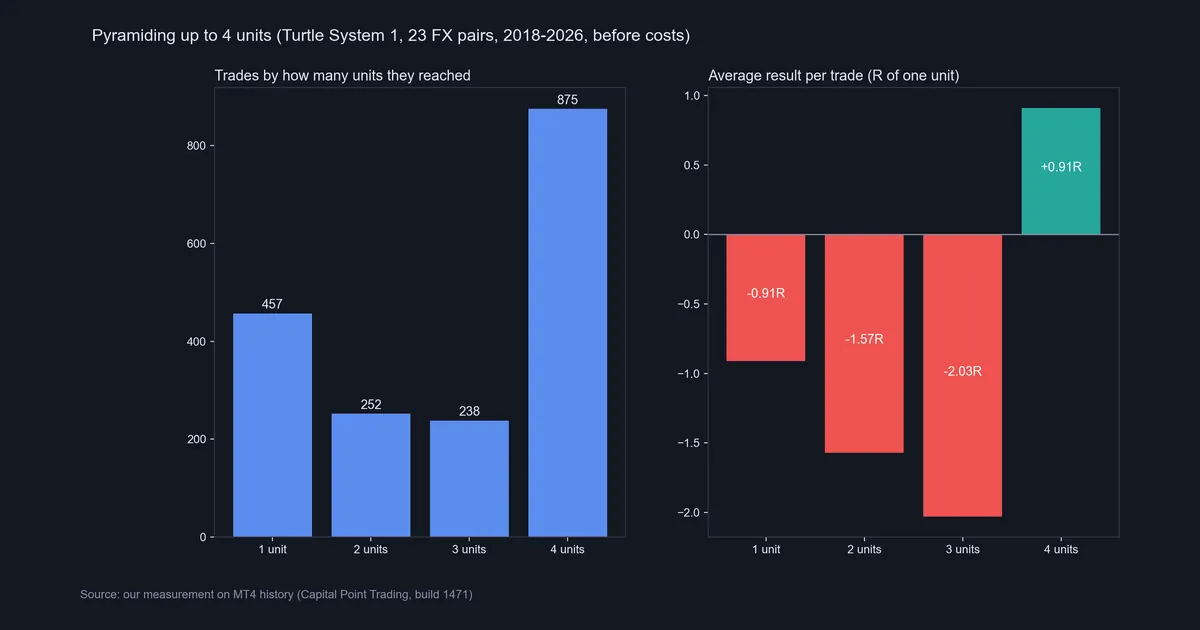
The second chart splits the four-unit test by how far each trade got. Of 1,822 trades, 875 reached four units and averaged +0.91R. The other 947 ended with fewer units: 457 at one unit (-0.91R), 252 at two (-1.57R) and 238 at three (-2.03R). So the trades that failed after two or three adds lost the most, because they took on size just before the breakout turned.
Why the added units hurt
The cause sits in the stop rule, not in bad luck. Each add drags the shared stop toward the first entry, so a normal pullback after a fast run closes everything. Then the size works against you. The adds arrive when a breakout has run 0.5N, 1N and 1.5N, and in our test 947 of 1,822 trades stalled before the fourth unit. A single unit that fails costs about 1R. A full pyramid that fails costs 2.5R before gaps.
In short, pyramiding scales up whatever the base system does. Here the base system lost money before costs, so the pyramid lost it faster. We did not test a system with a positive edge, so we cannot say what pyramiding adds there. Our guides to the R-multiple in trading and trading expectancy show how to check that edge first.
Download the complete indicator database
Put these concepts on your charts. One email unlocks the full library of 1,380+ indicators with compiled MT4 and MT5 files, plus my TradingView scripts. No paywall, no spam, unsubscribe any time.
Get free access to my indicator database
One email unlocks 1,380+ free MT4, MT5 and TradingView indicators — the complete library. No single-tool download; you get the whole database.
Where it fails
Pyramiding fails when a breakout triggers adds and then reverses. Our test shows five weak spots:
- A losing base system. With one unit, System 1 lost -0.085R per trade before costs. Adding units multiplied that loss.
- Full stop-outs. Two USDJPY trades in July and August 2026 reached four units, and each lost 2.5R. The worst trade lost 4.4R because price opened beyond the stop.
- Costs. Every add pays the spread again, and the four-unit version traded 1,822 times against 1,715. Read backtesting transaction costs before you trust any R figure.
- Correlated pairs. We set no cap across pairs. Pyramids on EURUSD and GBPUSD at once stack the same dollar risk, so track your portfolio heat.
- Daily-bar limits. A daily bar cannot show whether the high or the low came first, so fills on fast days are estimates.
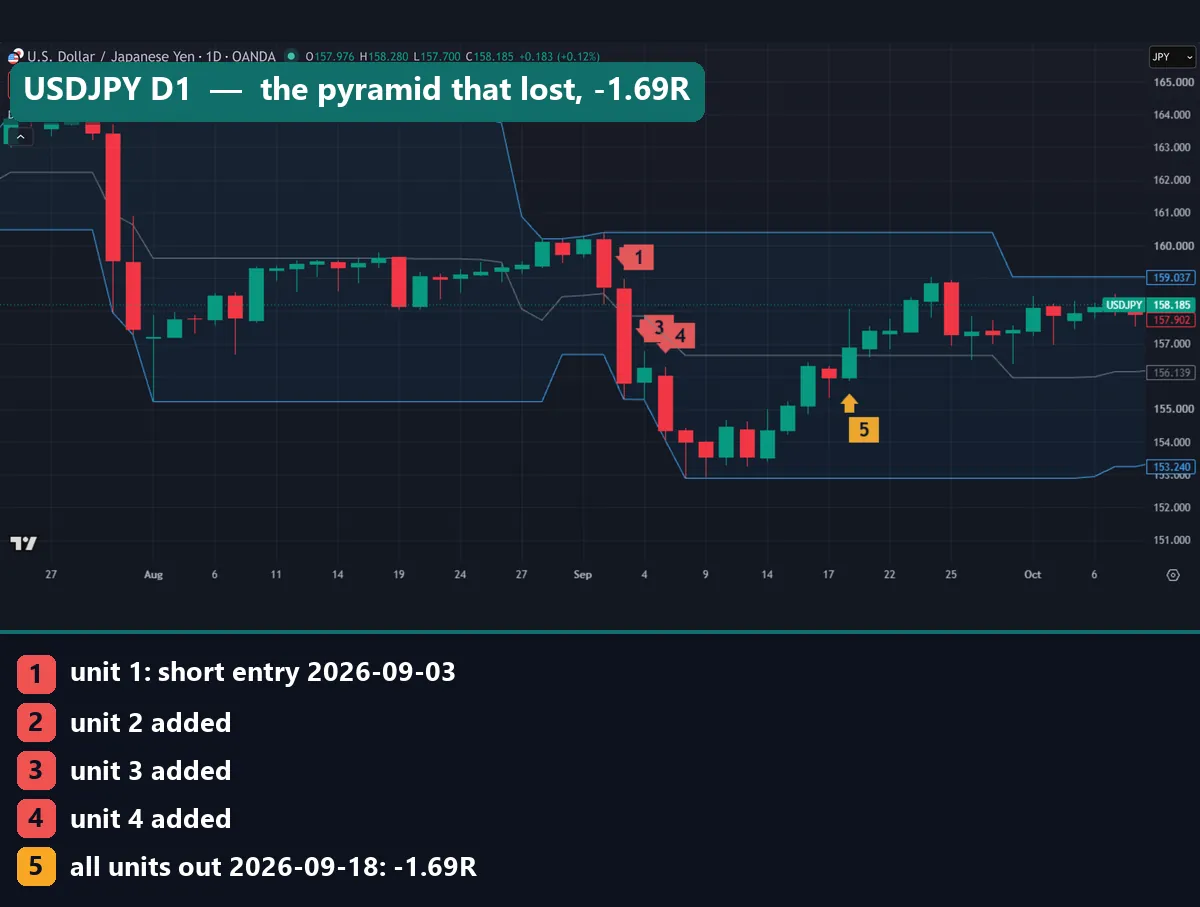
The USDJPY chart shows a quiet failure. The short opened on 3 September 2026 at 156.666. On 4 September two adds filled at 156.171 and 155.676, so marker 3 covers marker 2, and unit 4 followed on 7 September at 155.181. Then the drop stalled. On 18 September the 10-day high closed all four units at 156.762, for -1.69R. A single unit, closed at the same price, would have lost about 0.05R.
When the adds bunch up on one candle
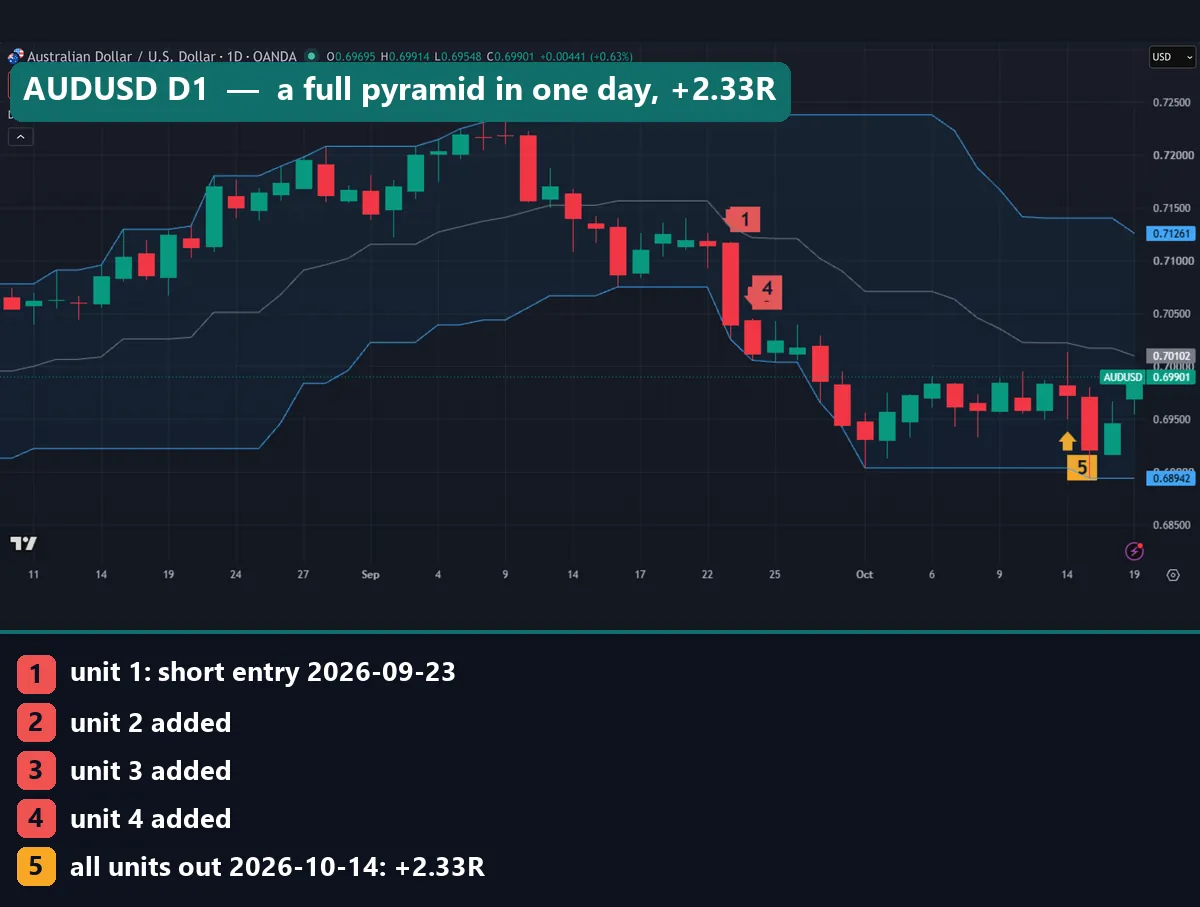
AUDUSD gives a winning trade with a hidden weakness. The short opened on 23 September 2026 at 0.70751. On 24 September a single candle filled units 2, 3 and 4 at 0.70543, 0.70335 and 0.70127, so marker 4 covers markers 2 and 3. In one day the open risk went from 1R to 2.5R.
This time the trend kept going, and the exit on 14 October at 0.69954 paid +2.33R, against 0.96R for one unit. But the add rule did no filtering here. All three adds came from one candle, so they gave no more proof than the first entry. If you want each add to confirm the last, your rule has to wait at least one more bar.
Common mistakes with pyramiding
1. Calling averaging down pyramiding. Adding to a losing trade raises risk when the trade is already wrong. Pyramiding adds only after price moves your way.
2. Sizing each add as a fresh trade. Count the whole position against your risk per trade limit, not each order. At four units, our Turtle position carried 2.5R.
3. Judging it by the best trades. The biggest four-unit winner made 36.7R, yet the same test lost -496.6R in total. Test the full sample, and check the backtest sample size you need.
4. Ignoring the drawdown. A worst run of -621.1R is more than three times the single-unit figure. Our page on drawdown in trading shows why deep holes take so long to climb out of.
Where to go next
Start with our Turtle trading strategy guide, which tests System 1 and System 2 without adds. The page on trend following trading explains why breakout systems lose often and rely on a few long runs. Before you add a second unit to anything, check your risk of ruin at the new size.
For a different view, read Richard Donchian’s trading guidelines at StockCharts ChartSchool. Donchian suggested adding after a one-day pullback in the trend, not on fresh strength. We have not tested that idea.
FAQ about pyramiding
What is pyramiding in trading?
It means adding to an open trade in planned steps as price moves in your favour. In our Turtle test, a new unit went on every 0.5N, up to four units.
Is pyramiding the same as averaging down?
No. Averaging down adds to a losing trade, while pyramiding adds to a winning one. Both grow the position, so both raise the cost of a reversal.
How did the Turtles pyramid?
They added one unit each time price moved 0.5N past the last entry, up to four units per market. Each add moved every stop to 2N from the newest entry.
Did pyramiding improve Turtle System 1 in your test?
No. On 23 FX pairs from 2018 to 2026, the average trade fell from -0.085R with one unit to -0.273R with up to four, before costs.
Why did the four-unit trades not rescue the results?
The 875 trades that reached four units averaged +0.91R. But 947 trades ended with fewer units, and those lost between 0.91R and 2.03R on average.
Where should the stop go after adding a unit?
The Turtle rule moves every stop to 2N from the newest entry. That keeps the newest unit’s risk at 1R but shrinks the room of older units. A wider stop gives more room but raises the loss when the trade fails.
Can I test pyramiding on TradingView?
Yes. A Pine Script strategy has a pyramiding setting, and its default is 1. Set it to 4 to allow four entries in one direction, then write your own entry and stop rules.
Should a beginner use pyramiding?
Only after the base system shows a positive result on its own, after costs. Count the risk of the whole position, and test on many pairs first. In our data, pyramiding made a losing system lose faster, and results are not guaranteed; past performance is not indicative of future results.
Last updated: 19 October 2026.

About the author
Written by Dominic Walsh, a Forex trader and MT4/MT5 indicator, Expert Advisor and script developer. Every tool on forexmt4systems.com is tested on live charts before release and ships with ready-to-use compiled MT4 (.ex4) and MT5 (.ex5) files. Learn more about the trader and developer behind this site.
How we build, test and correct every tool: Editorial & Testing Policy. Trading carries risk; see the disclaimer.