
A volume candlestick chart draws each candle with a width that grows with the volume traded in that bar, so price and activity sit in one picture. This guide settles three things. First, what the width really measures on a forex chart. Next, how to read wide and thin candles without fooling yourself. Last, what our own measurement on four symbols says the width is worth.
What a volume candlestick chart is
A normal candlestick shows four prices: open, high, low and close. Every candle has the same width, so a quiet bar and a busy bar look alike apart from their height. A volume candlestick chart keeps the four prices but adds a fifth piece of data. The width of each candle now tracks the volume of that bar.
So a busy bar draws as a fat candle and a quiet bar as a thin one. You no longer have to match bars against a separate volume pane by eye. TradingView lists this as its own chart type, “Volume candles”. Its volume candle help page at TradingView says the candles “vary in thickness depending on the trading volume”. It also names the account plans that include the chart type.
The idea is older than TradingView. Richard Arms drew price boxes whose width came from volume and called them EquiVolume. Later, charting sites put candle bodies inside those boxes. StockCharts ChartSchool’s CandleVolume article explains that version. For a refresher on bodies and wicks, see our guide on how to read candlestick charts.
How the candle width is set
Height still comes from price, exactly as on a normal chart. Width comes from volume. In plain terms:
height = high - low, body = |close - open|, width ∝ volume of the bar
That said, TradingView does not publish its exact scaling formula. Its help page only says that more volume makes a wider candle. Because the screen has a fixed width, the widths behave as relative values. So a candle is wide compared with the other bars on screen, not in any absolute sense. Zoom out and every candle gets thinner, but the ratios between them stay.
Now the forex catch. Spot FX has no central exchange, so no one can count the real lots traded. Your chart receives tick volume instead: the number of price updates the feed sent during the bar. The iVolume reference in the MQL4 docs describes MT4’s volume as that same tick count. TradingView labels the OANDA volume pane “Vol · Ticks”, as our fifth image shows.
So on a forex chart, a wide candle means many quote changes in that bar. More quote changes usually mean more traders acting at once. Still, it is a proxy, not a count of money. For the hour-by-hour picture, read our guide to daily trading volume in forex.
How we tested volume candles
We did two kinds of work. First, we looked at the chart type itself on a TradingView web chart with OANDA data. We captured four symbols on 7 October 2026 with Volume candles switched on: EURUSD M15, GBPUSD H1, XAUUSD M15 and USDJPY H1. Each shot holds about 80 bars. We also took one EURUSD M15 shot with ordinary candles and the built-in Volume pane, so the two views compare bar for bar.
Second, we measured how volume relates to candle shape. For that we used MetaTrader 4, build 1471, with history from the Capital Point Trading terminal. We read M15 bars from June 2025 to August 2026 for EURUSD, GBPUSD, USDJPY and XAUUSD. Then we computed a Spearman rank correlation between tick volume and range (high minus low), and between tick volume and body size. We also compared the median range of the busiest 10% of bars with that of all bars.
All numbers are our own calculation. Gold comes in $0.10 steps in the raw data, so we convert it to dollars. No trades were placed, because we tested a chart type, not a strategy. Our method is set out in the editorial testing policy.
Volume candle settings on TradingView
The chart type has few settings of its own. Most of what you control is the chart around it.
| Setting | What it does | What we used |
|---|---|---|
| Chart type | Switches plain candles to Volume candles from the chart type menu | Volume candles (plain candles for the comparison shot) |
| Color based on previous close | Colours a candle by its close against the prior close, not its own open | Left at default |
| Body, Borders, Wick | Colour and fill of each part of the candle | Default green up, red down |
| Timeframe | Sets how many ticks fall into each bar | M15 and H1 |
| Data feed | Decides whose tick volume you see | OANDA |
| Bars on screen | Widths are relative, so more bars means thinner candles | About 80 |
One setting deserves a note. With colour by previous close on, a candle can be red while its own close sits above its open. Our hollow candlestick chart guide covers the chart type built around that rule.
Reading a volume candlestick chart
Read the chart in two passes. First, scan for the wide candles only. They mark the bars where the feed was busiest. Then look at the shape of each wide candle: its body, its wicks, and where it closed.
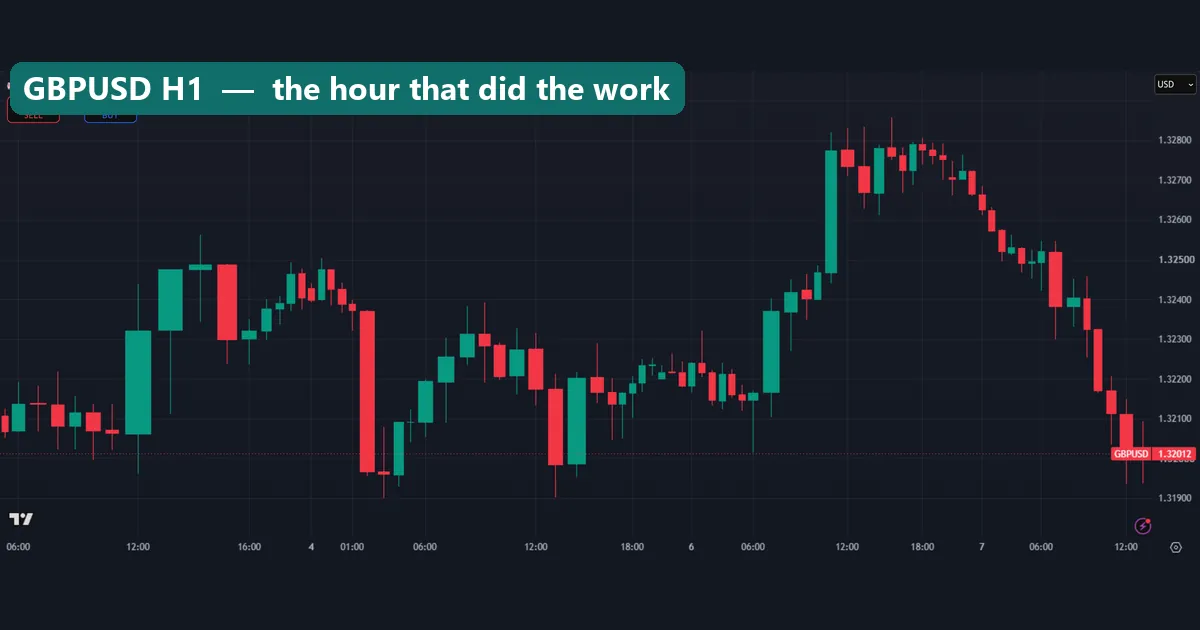
The GBPUSD hourly chart shows the pattern. On Friday 2 October, the bars around 12:00 are clearly wider than the morning bars. Then, around 11:00 on 6 October, one wide green candle lifts the pair from about 1.3245 to about 1.3277. The thin candles after it drift sideways near the top. So width picked out the hour that did the work, and the quiet hours that followed.
Next, check what the wide candle did with its body. A long body with short wicks means the busy bar also moved price one way. However, a small body with long wicks means heavy activity that went nowhere. Our page on what candlestick wicks mean covers that second shape.
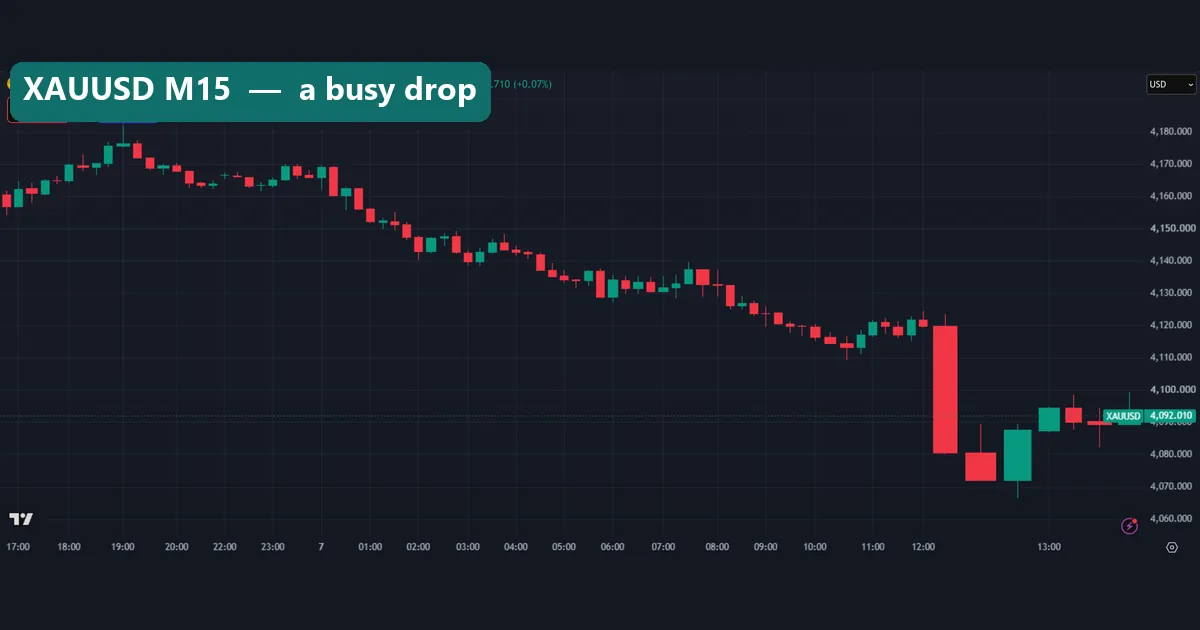
Gold makes the contrast sharper. On the XAUUSD M15 chart, most candles from 01:00 to 12:00 are thin. Then the 12:15 red candle is several times wider than its neighbours. Its body runs from about $4,120 down to about $4,080, roughly $40 in fifteen minutes. The two candles after it are also wide, so the activity lasted past the first bar. In short, this drop came with a burst of quotes, not on a thin feed.
Volume candlestick chart worked example: EURUSD on 7 October
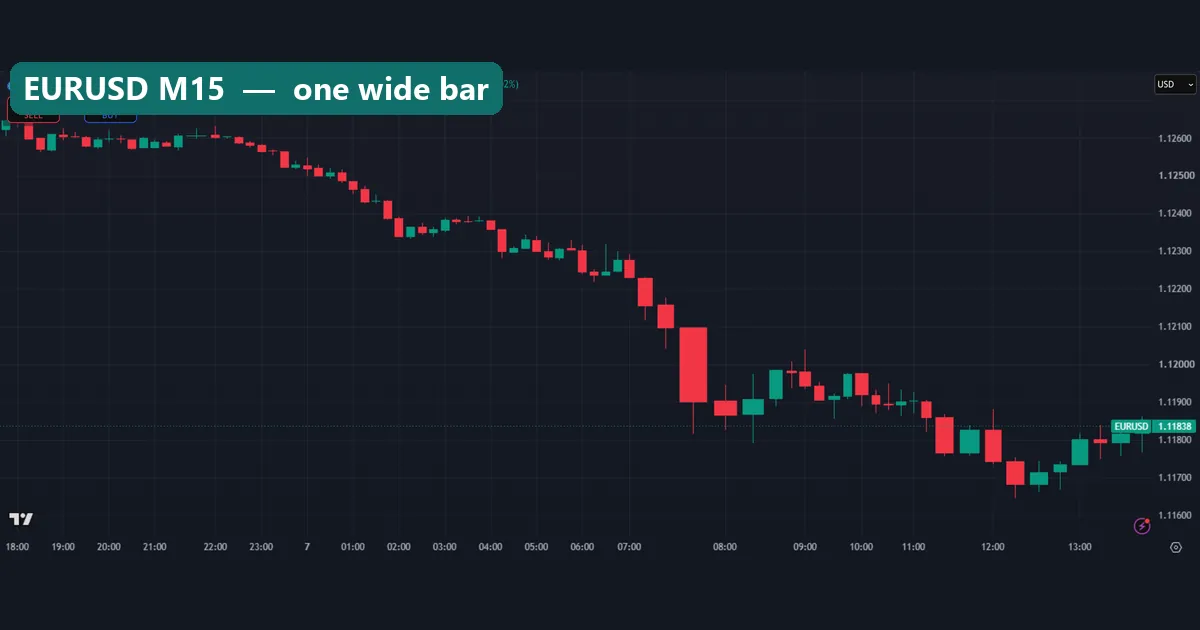
Here is one bar, read slowly. On the EURUSD M15 chart in our first image, the overnight candles are narrow. Then one red candle just before the 08:00 label is far wider than anything else. That is the 07:45 bar on 7 October 2026.
First, take its height from the price scale. The body runs from about 1.1210 down to about 1.1190, roughly 20 pips. The lower wick reaches about 1.1182, so the full range is close to 28 pips. Next, take its volume from the comparison shot. In the Volume pane, that bar is the tallest, at about 5K ticks. Most overnight bars sit below 1K.
Now compare our long-run numbers. Over June 2025 to August 2026, the median EURUSD M15 bar had a range of 4.7 pips. The busiest tenth of bars had a median range of 8.8 pips. So the 07:45 bar was an outlier even among busy bars, about six times a normal candle.
What does it teach? Width and height agreed here. But the next bars show the limit. Price paused near 1.1190 for the next hour while widths stayed above the overnight level. So width told us the market was awake. It did not tell us where the next bar would go.
What our measurement found
One example proves little, so we checked thousands of bars. The question was plain: when a candle is wide, is it also tall?
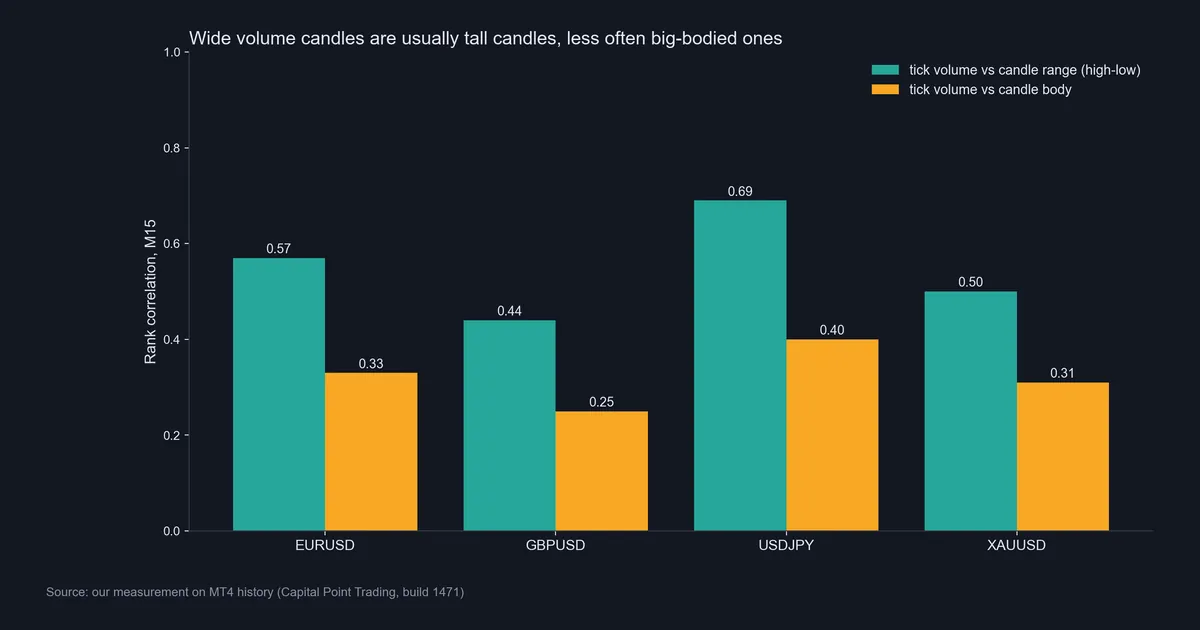
On all four symbols, tick volume tracked range more closely than body. For EURUSD the rank correlation with range was 0.57, against 0.33 with the body. GBPUSD showed 0.44 against 0.25. USDJPY was the strongest at 0.69 against 0.40. Gold came in at 0.50 against 0.31.
A rank correlation runs from -1 to 1, and these values are moderate. So wide candles are usually tall, but plenty of wide candles are short. The body link is weaker still, because busy bars often swing both ways and leave long wicks.
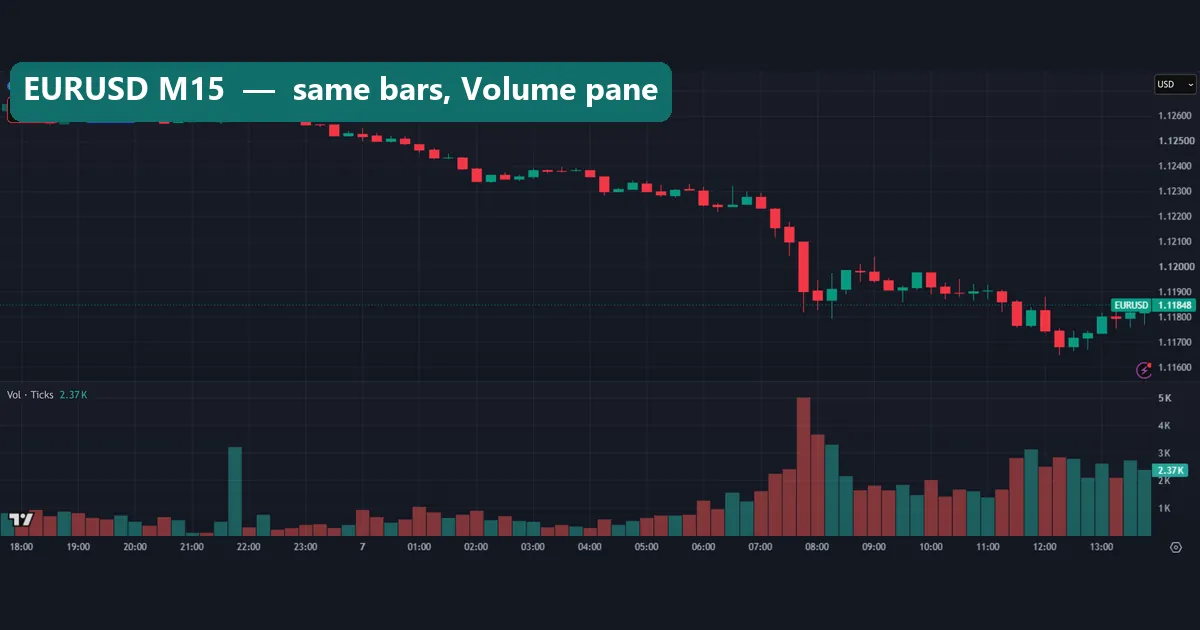
The comparison shot shows why the chart type helps. With ordinary candles, the 07:45 bar looks tall but no wider than the rest. Its weight only shows up in the Volume pane. On the volume candlestick chart, that fact sits inside the candle itself. Still, the pane gives an exact tick count and a scale, which width never does.
Download the complete indicator database
Put these concepts on your charts. One email unlocks the full library of 1,380+ indicators with compiled MT4 and MT5 files, plus my TradingView scripts. No paywall, no spam, unsubscribe any time.
Get free access to my indicator database
One email unlocks 1,380+ free MT4, MT5 and TradingView indicators — the complete library. No single-tool download; you get the whole database.
Where it fails
- Tick volume is not traded volume. A wide candle means many quote updates on one feed, not big money. The BIS Triennial FX Survey is the main source on real FX turnover, and it reports totals only once every three years.
- Feeds disagree. OANDA, your MT4 broker and other vendors each count their own ticks. So the same hour can look wide on one chart and average on another.
- Widths have no scale. You cannot read a tick count off a candle, and the same bar looks thinner when you zoom out.
- Session rhythm drives most of the width. In our M15 data across nine symbols, the 14:00 UTC hour had a median range 3.4 times a typical M15 bar, against 1.42 times at 04:00 UTC. So a wide candle at 14:00 is normal, not news.
- Rollover spikes. Our comparison shot shows a tick spike near 21:45 that drew a wide candle with almost no body. Bursts like that come from the feed, not from a move.
- Crowded charts. Very wide candles squeeze their neighbours, so small bodies get hard to see on low timeframes.
Wide does not mean direction
This is the limit that misleads readers most. Width measures activity. It carries no sign.
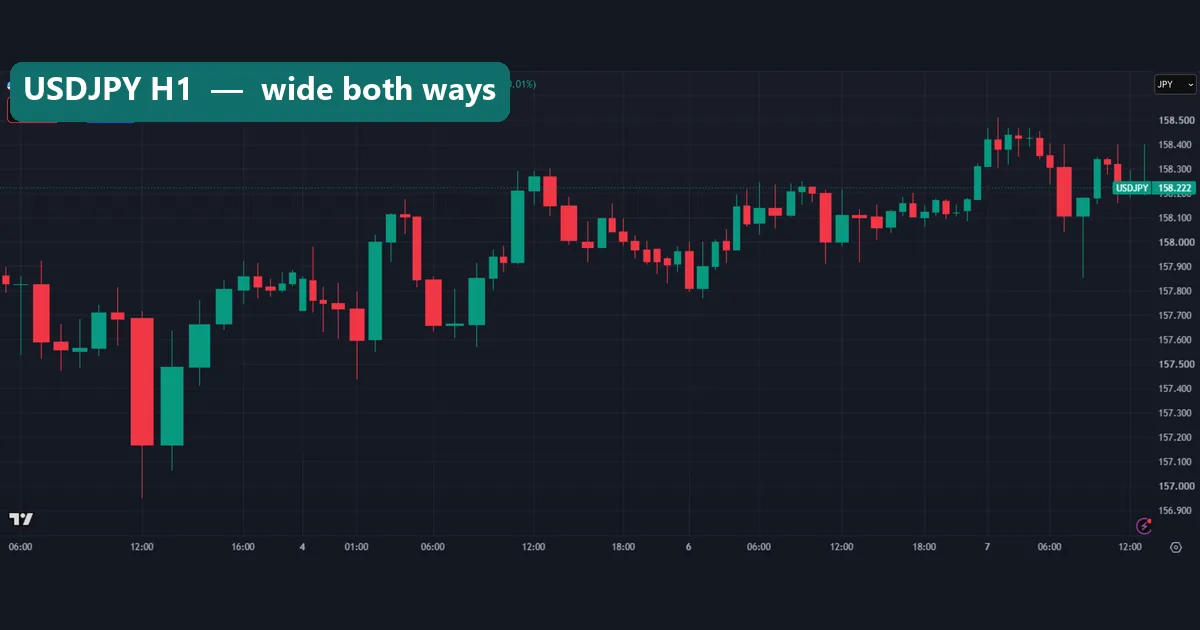
The USDJPY hourly chart shows it plainly. At 12:00 on Friday 2 October, a wide red candle drops from about 157.70 to about 157.17, with a wick near 156.95. Then the next candle is just as wide and green, and it climbs back to about 157.49. Two busy hours, two opposite moves.
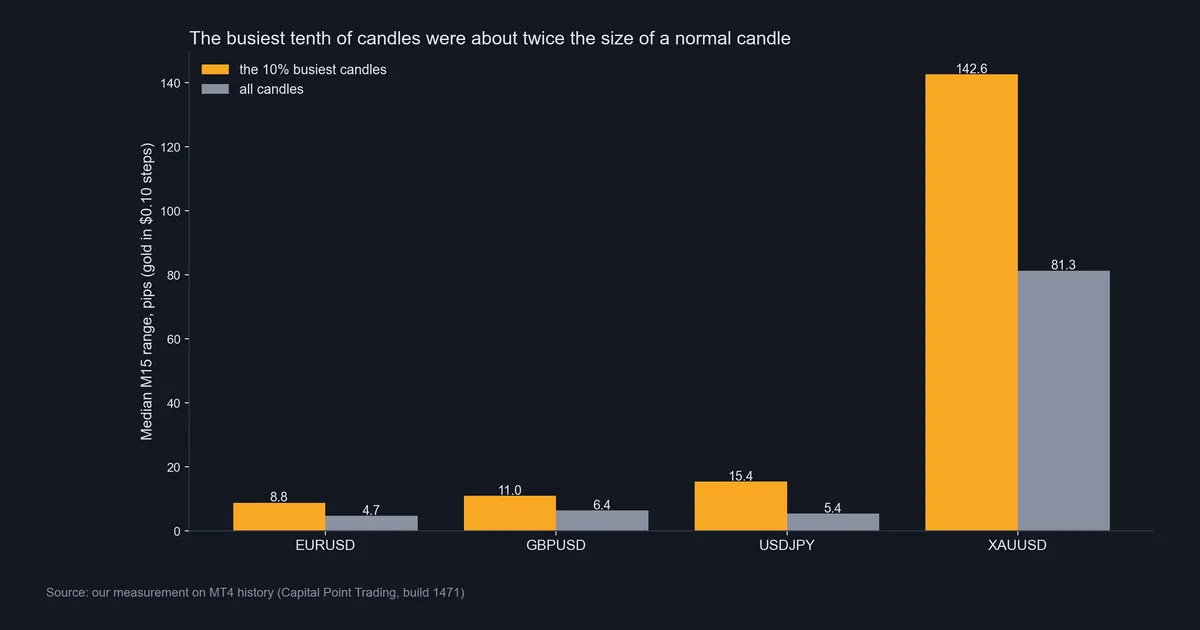
Our size measurement points the same way. Across the four symbols, the busiest tenth of M15 candles were about twice the size of a normal candle. EURUSD went from 4.7 to 8.8 pips, and GBPUSD from 6.4 to 11.0 pips. USDJPY nearly tripled, from 5.4 to 15.4 pips. Gold moved from $8.13 to $14.26. So a wide candle tells you to expect a bigger bar, not which way it goes. For a size measure with a scale, see what ATR means in trading.
Common mistakes with volume candles
- Treating width as buying or selling pressure. Width has no direction, as the USDJPY chart shows. Read the body and the close for direction, and use width only as context.
- Comparing widths across charts. Widths are relative to one screen and one feed. A wide candle on OANDA and a wide candle on your broker’s chart are not the same amount of activity.
- Forgetting the clock. London and New York hours are wide almost every day. So compare a candle with the same hour on earlier days. Our forex trading sessions guide lists those hours.
- Stacking patterns on top. Some traders demand that a hammer or engulfing candle also be wide. That cuts the sample and adds no tested edge. Our review of whether candlestick patterns work shows how thin that edge already is.
Where to go next
If volume is the part you care about, a pane with a scale may serve you better than widths. Our guide to the best volume indicator for day trading tests Volume, OBV and VWAP on the same tick data. Then our volume spread analysis guide reads width and height together. For MetaTrader, see our list of volume indicators for MT4.
Also, if you want a chart that changes prices rather than widths, our Heikin Ashi vs candlestick comparison explains that trade-off. Volume candles are the gentler change: prices stay true, and you only gain a cue for activity.
FAQ
What does a wide candle mean on a volume candlestick chart?
That bar had more volume than the other bars on screen. In forex that is tick volume, so the bar saw more quote updates. It says nothing about direction.
Is volume in forex real volume?
No. Spot FX has no central exchange, so charts show tick volume, the number of price changes your feed sent. It is a rough proxy for activity, not a count of lots.
How do I turn on volume candles in TradingView?
Open the chart type menu on the top toolbar and pick “Volume candles”. TradingView’s help page lists which plans include it.
Are wide candles also big candles?
Usually. In our M15 data, the rank correlation between tick volume and range ran from 0.44 on GBPUSD to 0.69 on USDJPY. The link with body size was weaker.
Can I use candle width to time entries?
Not by itself. Busy bars move both ways, as our USDJPY example shows.
Does the timeframe change the widths?
Yes. Widths are relative to the bars on screen, so timeframe and zoom both change them. Compare candles only within one chart.
Can MT4 draw volume candles?
MT4 has no built-in volume candle chart type. It shows tick volume in a separate Volumes pane instead.
Will volume candles improve my trading results?
They make busy bars easier to spot, but they add no tested edge on their own, and results are not guaranteed; past performance is not indicative of future results.
Last updated: 8 October 2026.

About the author
Written by Dominic Walsh, a Forex trader and MT4/MT5 indicator, Expert Advisor and script developer. Every tool on forexmt4systems.com is tested on live charts before release and ships with ready-to-use compiled MT4 (.ex4) and MT5 (.ex5) files. Learn more about the trader and developer behind this site.
How we build, test and correct every tool: Editorial & Testing Policy. Trading carries risk; see the disclaimer.