
A hollow candlestick chart draws each candle with two answers instead of one: the fill tells you how price moved inside the bar, and the colour tells you how the close compares with the previous close. This guide settles what each of the four candle states means, why one of them almost never shows up on daily forex charts, and what the extra detail can and cannot tell you.
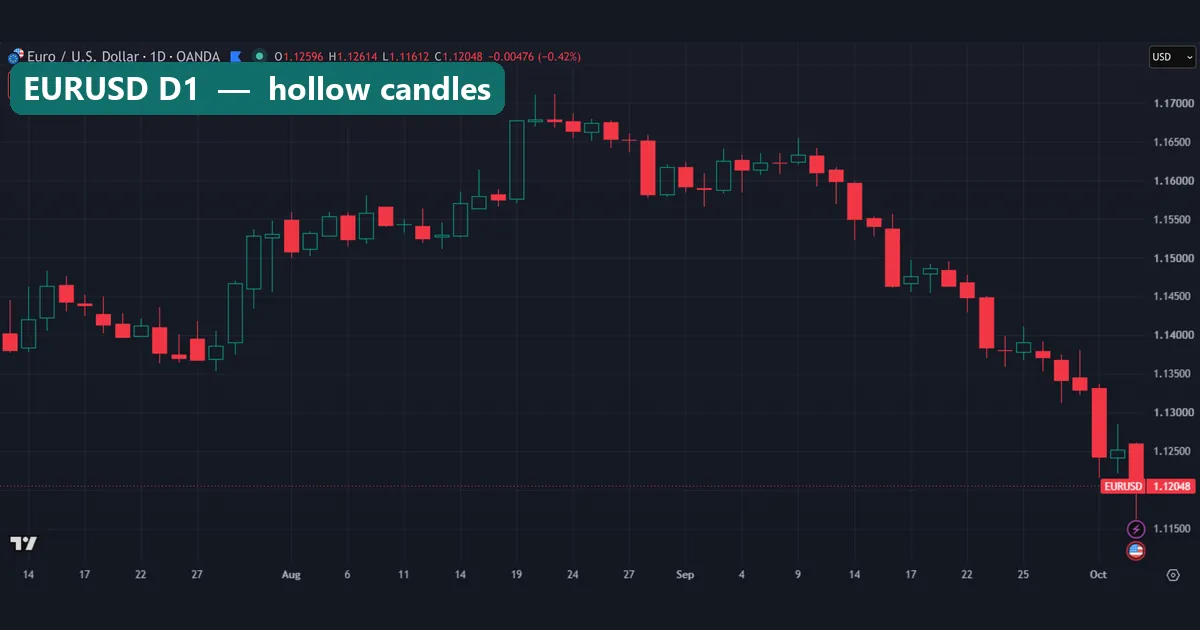
What a hollow candlestick chart is
A normal candlestick asks one question. Did the bar close above or below its own open? A green or white body says above, and a red or black body says below. For the basics, see our guide on how to read candlestick charts.
A hollow candle adds a second question. So the body carries two signals at once. First, the fill: an empty body means the close sat above the open, and a solid body means it sat below. Second, the colour: green means the close beat the previous bar’s close, and red means it fell short. TradingView spells out the same four states in its hollow candle charts explained page on TradingView.
The candlestick chart article on Wikipedia traces candles back to Japanese rice trading. Hollow candles just colour the same four prices in a newer way.
How the fill and colour rules work
Each candle runs through two tests. The high and low only shape the wicks.
- Fill test:
hollow if Close > Open, filled if Close < Open - Colour test:
green if Close > Close[1], red if Close < Close[1]
Here Close[1] is the close of the bar before. Put the two tests together and you get four states:
- Hollow green: closed above its open and above the prior close.
- Filled green: closed below its open, but still above the prior close.
- Hollow red: closed above its open, but still below the prior close.
- Filled red: closed below its open and below the prior close.
The two plain states match a normal chart. The mixed ones are the point: a filled green candle fell during its own session yet finished above the day before, and a hollow red one rallied yet finished lower.
Why a filled green candle needs a gap
Look at the filled green rule again. It needs Close[1] < Close < Open. That can only happen if the bar opened above the prior close. In other words, a filled green candle needs a gap up, and then the close has to land inside that gap. Hollow red is the mirror image: it needs a gap down and a close inside it.
On forex this is rare, because one bar usually opens right next to where the last one closed. Spot FX is an over-the-counter market quoted by many dealers around the clock on weekdays, as the BIS Triennial Survey of FX and OTC derivatives markets shows. So there is no opening auction to create a jump. The main gaps come at the weekend, which our weekend gap guide covers in depth. Across 7,409 weekends in our data, the median gap was only 0.133 of a 14-day ATR.
How we tested
We used two sources. First, we read daily history for 23 FX pairs from a MetaTrader 4 terminal (Capital Point Trading, MetaTrader 4, build 1471). The file runs from 12 June 2018 to 24 August 2026 and holds 37,748 daily candles. Then we sorted each candle into one of the four states with the two tests above.
The first candle of each pair has no previous close, so it drops out. That leaves exactly 37,725 candles, which is the base for every percentage below. Gold was not part of this count.
Next, we took screenshots on a TradingView web chart on 5 October 2026, using OANDA data for EURUSD, GBPUSD, USDJPY and XAUUSD, and Bitstamp data for BTCUSD. Timeframes were daily, one hour and 15 minutes.
Our full method rules are on the editorial testing policy page. We did not test any trading rule built on hollow candles, so nothing here measures a trading edge.
Hollow candle settings on TradingView
A hollow chart has no period to tune, but a few choices change what you see. Our TradingView chart guide shows where the menus sit.
| Setting | What it decides | Where to change it |
|---|---|---|
| Chart type | Switches between normal candles and hollow candles | Chart type menu on the top toolbar |
| Up and down colours | The green and red used for the colour test | Chart settings, Symbol tab |
| Timeframe | Which open and prior close are compared | Interval menu on the top toolbar |
| Data feed | Sets the exact open and close, so it can flip a state | The symbol prefix, such as OANDA or Bitstamp |
| Session and day cut | Where one daily candle ends and the next starts | Depends on the feed and symbol |
MetaTrader 4 has no built-in hollow chart type. It offers bars, candlesticks and a line chart, and its candles only use the close versus open test.
Reading a hollow candlestick chart
Read the fill first: it tells you who won the bar. Then read the colour: it tells you where the close sits against the last one.
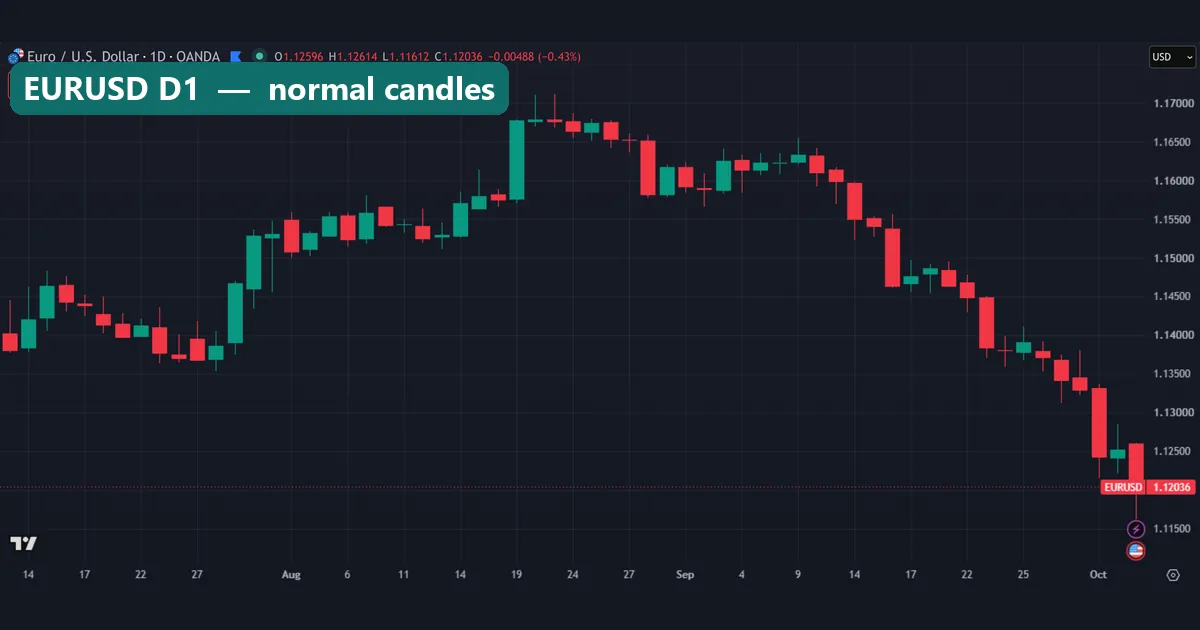
Compare the two EURUSD daily charts. They show the same window, from mid-July to 5 October 2026. On this window the two charts look almost the same. Every green candle in the hollow version is hollow, and every red one is filled. That is the normal result on daily forex, for the gap reason above. For example, the long candle on 19 August reads as a plain up day on both charts, from about 1.1575 to about 1.1675.
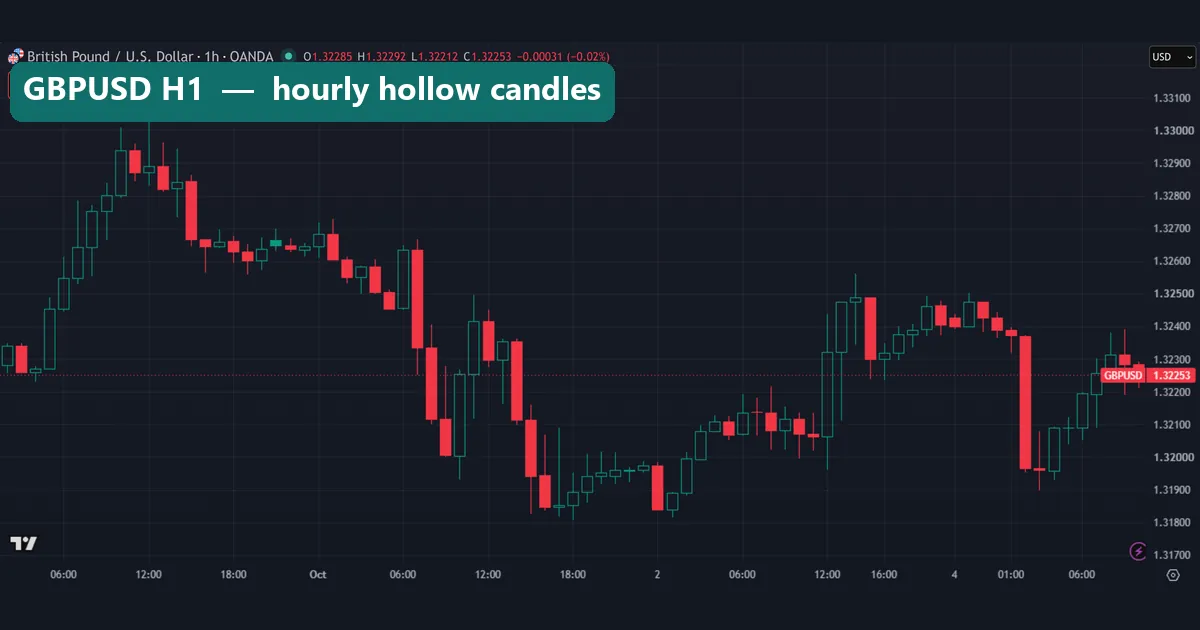
On the GBPUSD hourly chart, almost every body follows the plain pattern again. A couple of small solid green bodies appear around 30 September, near 1.3265. Those are filled green candles: each dipped below its own open but held above the prior close.
So treat the plain states as normal candles. When an off-colour body appears, look for the gap behind it.
Worked example: three candles from 5 October 2026
Each screenshot’s top line prints the latest bar’s prices and its change from the prior close. That is enough to work out the state by hand.
First, EURUSD daily. The candle opened at 1.12596 and stood at 1.12048, down 0.00476. So the prior close was 1.12524. The open sat 7.2 pips above that prior close: a small gap up after the weekend. Because the price then fell below both the open and the prior close, the candle is filled red. A filled green candle needed a close between 1.12524 and 1.12596. That band was just 7.2 pips wide.
Next, XAUUSD daily. Gold opened at 4,141.605 and stood at 4,157.215, up 16.695. The prior close was therefore 4,140.52. Here the gap was only about $1.09. Price closed above the open and the prior close, so the candle is hollow green.
Finally, USDJPY on 15 minutes. The bar opened at 157.902 and stood at 157.960, up 0.060. That puts the prior close at 157.900, only 0.2 pips below the open. The band for a filled green candle was 0.2 pips wide, which explains why intraday charts rarely show one.
All three bars were still forming when we took the shots, so their states could still change.
What 37,725 daily candles show
Our measurement puts real numbers on the four states.
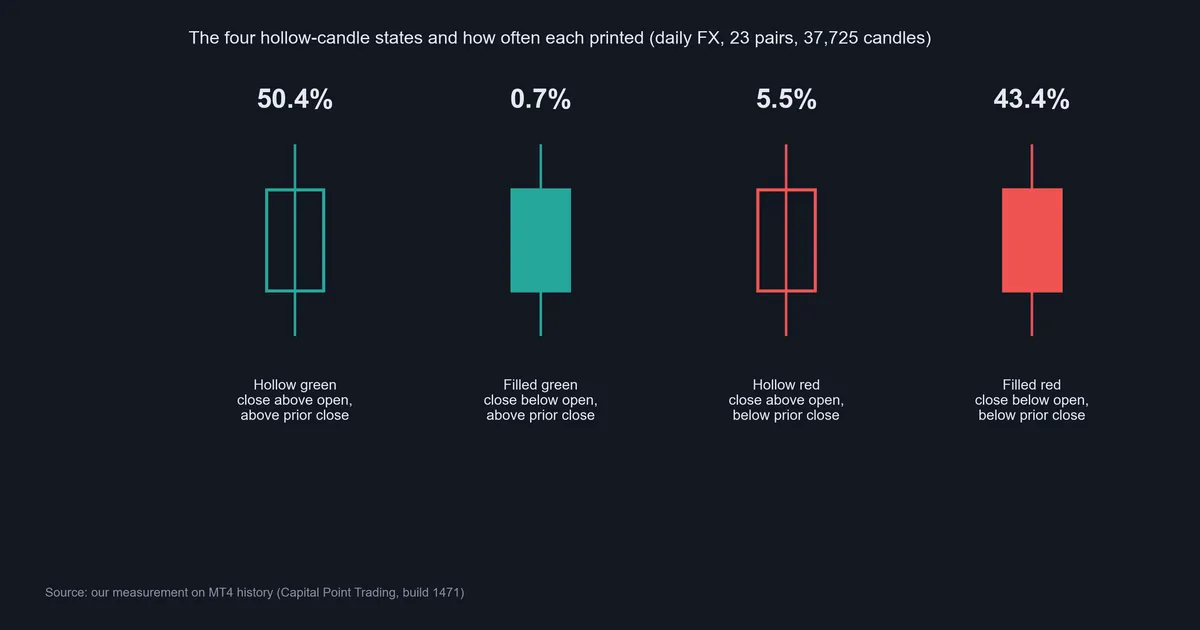
- Hollow green: 50.4%
- Filled red: 43.4%
- Hollow red: 5.5%
- Filled green: 0.7%
So 93.8% of daily candles look exactly as they would on a normal chart. Only 6.2% carry the extra information that hollow candles exist to show. Filled green was the rarest by far: about 260 candles across 23 pairs and eight years.
Hollow red, however, turned up almost eight times as often. We can only partly explain this. Our history uses bid prices, and spreads tend to widen around the daily rollover, as our page on why spreads widen explains. A wider spread can pull the first bid of a new day below the last bid of the old one. That would create small gaps down more often than gaps up. We did not test this directly, so treat it as a likely cause, not a proven one.
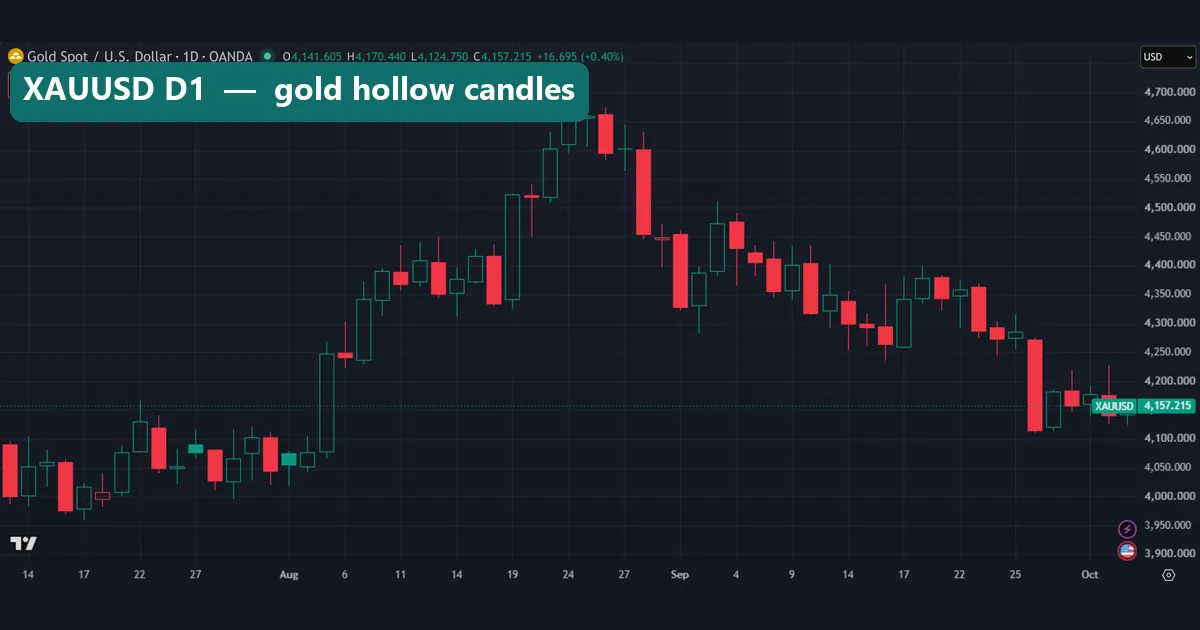
Gold looks a little different. On the XAUUSD daily chart we can see two solid green bodies, one near 27 July and one around the start of August. The EURUSD window shows none. Our 0.7% figure covers FX only.
Download the complete indicator database
Put these concepts on your charts. One email unlocks the full library of 1,380+ indicators with compiled MT4 and MT5 files, plus my TradingView scripts. No paywall, no spam, unsubscribe any time.
Get free access to my indicator database
One email unlocks 1,380+ free MT4, MT5 and TradingView indicators — the complete library. No single-tool download; you get the whole database.
Where it fails
A hollow candlestick chart adds no new data. It just shows the prior close inside the current candle. Here are its real limits.
- Most candles carry no extra detail. On daily FX, 93.8% of our candles matched a normal chart. The extra layer only helps in the other 6.2%.
- No tested edge. We did not find, and did not test, any proof that a filled green or hollow red candle forecasts the next move. With about 260 filled green candles over 23 pairs, each pair holds a small sample.
- The feed decides the state. Two brokers can cut the day at different times or quote a different first price. Then the same day can be hollow on one chart and filled on another.
- Monday candles are distorted. The weekend gap sets the colour test for the first daily bar of the week, not the trading on Monday itself.
- Intraday it fades out. On 15-minute charts, the open usually sits a fraction of a pip from the prior close. As a result, the chart behaves like normal candles.
Gaps and 24/7 markets on hollow candles
The two charts below show a market that stops at the weekend and one that never stops.
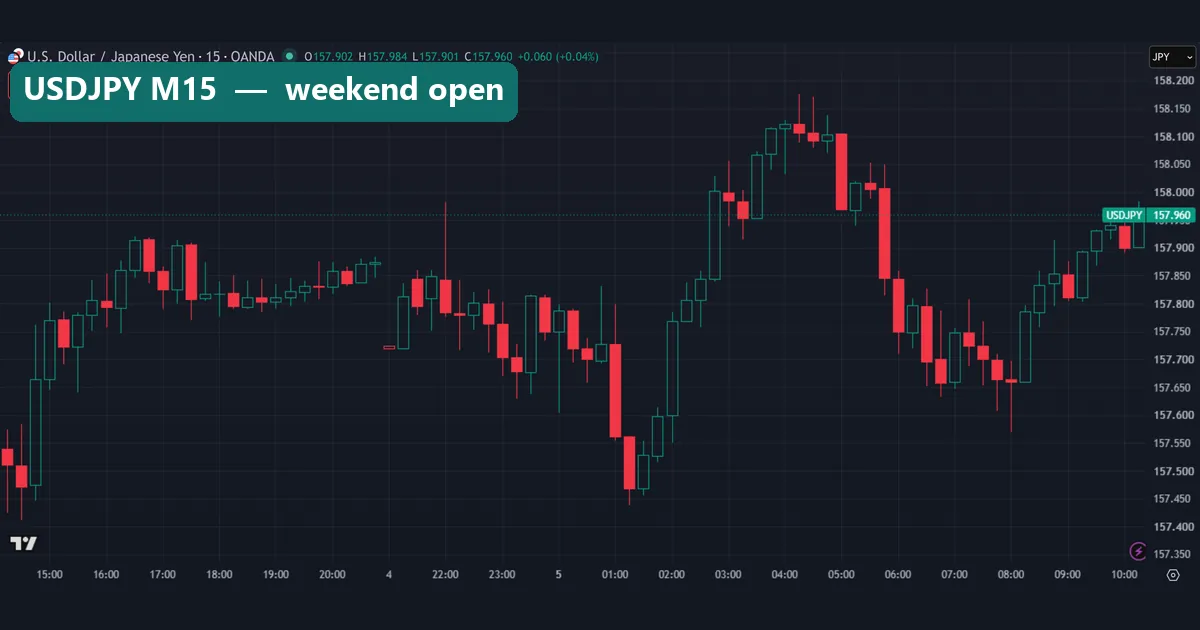
On the USDJPY 15-minute chart, look at the first candle after the weekend break near 157.72. It has a red outline and an empty body: a hollow red candle. Price opened below Friday’s last close, rose a little, and still finished below that close. This is the gap mechanism in a single bar.
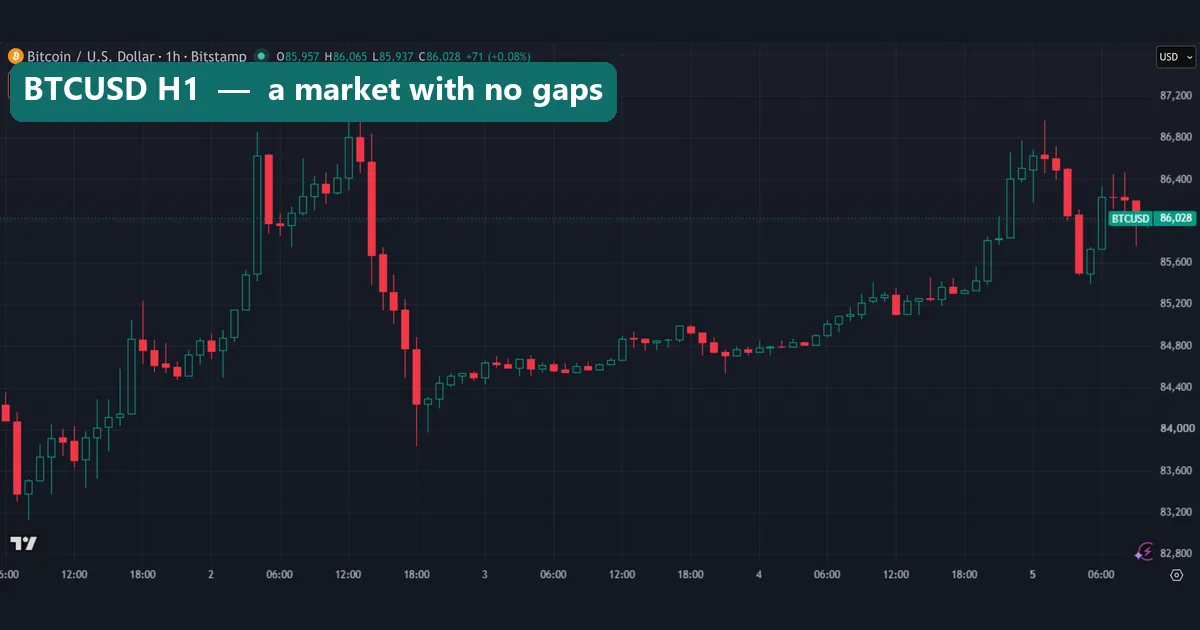
By contrast, Bitcoin on Bitstamp trades every hour of every day. In the screenshot the latest bar opened at 85,957, and the change line puts the prior close at the same 85,957. With no gap at all, a filled green or hollow red candle cannot form. See forex vs crypto trading for other differences.
Four common mistakes
1. Reading every green candle as a rising session. Green only means the close beat the prior close. Check the fill before you decide what happened inside the bar.
2. Treating off-colour candles as signals. A filled green candle looks unusual, so it feels important. But our data shows it is mostly a by-product of a small gap. We have no evidence it predicts anything.
3. Comparing charts from different feeds. An OANDA chart and a MetaTrader chart from another broker may not agree on the open. Then the states will not agree either. Compare like with like.
4. Trusting the live candle. Our EURUSD screenshots show the point well. The hollow chart printed a close of 1.12048, and the normal chart a moment later printed 1.12036. Wait for the close before you read the state.
Hollow candles next to other chart types
Hollow candles sit between a plain candle chart and smoothed charts. The chart types overview at StockCharts ChartSchool lays out the main families side by side.
- Normal candles: one test, close versus open. Our candlestick patterns explained page builds on these.
- Bar charts: the same four prices drawn as ticks. See bar chart vs candlestick.
- Heikin Ashi: averaged candles that hide the real open and close. Our Heikin Ashi vs candlestick guide compares them.
- Line charts: closes only, so no body at all. See line charts in forex.
Unlike Heikin Ashi, a hollow chart keeps the real prices, so known patterns read the same way.
Where to go next
If you want to use hollow candles with patterns, start with single-candle shapes. Our pages on the doji candle and the marubozu candlestick explain two body shapes that hollow colouring does not change. Then check do candlestick patterns work for a measured view of pattern results.
For gaps, read our page on the types of gaps in forex. For a printable reference, the Japanese candlestick cheat sheet keeps the main shapes on one page.
FAQ: hollow candlestick chart
What does a hollow green candle mean?
It means the bar closed above its own open and above the prior close. On daily FX it was the most common state in our data, at 50.4% of 37,725 candles.
What does a filled green candle mean?
It closed below its own open but still above the prior close. That needs a gap up first, which is why it made up only 0.7% of our daily FX candles.
What does a hollow red candle mean?
It closed above its own open but still below the prior close. In other words, it opened with a gap down and recovered part of it. It made up 5.5% of our daily FX candles.
Is a hollow candlestick chart better than normal candles?
It shows slightly more. But on daily FX the extra detail changed only 6.2% of our candles, so the gain is small.
Can I use hollow candles in MetaTrader 4?
Not as a built-in chart type. MetaTrader 4 offers bars, candlesticks and a line chart, and its candles only compare the close with the open.
Why do I see almost no filled green candles on forex charts?
Because forex bars usually open right at the prior close. With no gap there is no room for a close above the prior close but below the open.
Do hollow candles work on crypto charts?
They display fine, but a market that trades every hour rarely gaps. On our Bitcoin hourly chart the latest bar opened exactly at the prior close, so the chart behaved like normal candles.
Can hollow candles predict the next move?
We have no evidence that they can, and we did not test a trading rule built on them. Treat them as a display choice, not a signal; results are not guaranteed; past performance is not indicative of future results.
Last updated: 5 October 2026.

About the author
Written by Dominic Walsh, a Forex trader and MT4/MT5 indicator, Expert Advisor and script developer. Every tool on forexmt4systems.com is tested on live charts before release and ships with ready-to-use compiled MT4 (.ex4) and MT5 (.ex5) files. Learn more about the trader and developer behind this site.
How we build, test and correct every tool: Editorial & Testing Policy. Trading carries risk; see the disclaimer.