
An evening star candlestick chart pattern is three candles that are said to mark the end of a rally: a strong up candle, a small pause candle, then a strong down candle. This guide settles one question with our own data. We counted the pattern on 37,748 daily FX candles and on 85,399 fifteen-minute candles, then checked what price did next. The short answer is uncomfortable. On daily FX it led to lower prices less often than a random candle did.
What the evening star pattern is
The evening star is a bearish reversal pattern from Japanese candlestick charting. It needs three candles in a row. First comes a large bullish candle that shows buyers in control. Next comes a small candle, the “star”, where the push stalls. Its colour does not matter. Then a large bearish candle closes deep into the body of the first candle.
The name comes from the evening star in the sky, seen just before dark. Its mirror is the morning star, a bullish pattern that forms after a decline. We cover that one in our morning star pattern guide, and the two are compared side by side in morning star vs evening star.
Stock textbooks often want a gap between the candles. But FX trades around the clock, so each day opens near the prior close. Most FX traders drop the gap rule, and so did we.
How the three candles work
The story is simple. In candle one, buyers lift price with ease. In candle two, they push again but make little progress. Then in candle three, sellers erase at least half of candle one’s gain. That close below the midpoint is the key test.
The midpoint rule has a plain formula. Take the first candle’s open and close and average them:
midpoint = (Open1 + Close1) / 2
The pattern is complete only if Close3 < midpoint and candle three is bearish. For example, if candle one opened at 1.1000 and closed at 1.1040, the midpoint is 1.1020. Candle three must then close below 1.1020.
“Large” and “small” also need numbers. We size them with the Average True Range (ATR), a typical candle’s range, as our ATR explainer shows. So a 30-pip candle can be large on a quiet pair but small on a busy one.
How we tested the evening star
We ran two tests. First, we read daily candles for 23 FX pairs from our MetaTrader 4 terminal history (Capital Point Trading, MetaTrader 4, build 1471). The window runs from 12 June 2018 to 24 August 2026, which gives 37,748 daily candles. We left out pairs whose history files were short or broken. Second, we read 15-minute candles for 14 symbols, including gold, from 2 June 2025 to 26 August 2026. That set holds 85,399 candles.
For each pattern we asked one question. Did price close lower after a fixed number of bars than it did at the close of candle three? On daily bars we checked 1, 3 and 5 days later. On 15-minute bars we checked 1, 4 and 8 bars later.
Then we compared each result with a base rate: how often any candle at all was followed by a lower close over the same horizon. Spread and commission were not part of this test.
The chart images come from a separate source: the TradingView web chart with the OANDA feed, using bars up to 1 October 2026. Our full method is set out in the editorial testing policy.
Our exact rule and its settings
This table is the exact rule our counting script used, so you can copy it into your own scanner.
| Part | Our setting | Why |
|---|---|---|
| Candle 1 | Bullish, body larger than 0.5 x ATR(14) | Shows a real push up |
| Candle 2 | Any colour, body smaller than 0.3 x ATR(14) | Shows the stall |
| Candle 3 | Bearish, close below (Open1 + Close1) / 2 | Sellers erase half of candle 1 |
| Gap | Not required | FX rarely gaps between days |
| Trend filter | None | We tested the bare pattern |
| ATR | 14-bar simple average of true range | Scales size to each pair |
| Horizons | 1, 3, 5 daily bars; 1, 4, 8 bars on M15 | Short follow-through only |
| Success | Close at the horizon below candle 3’s close | Simple and easy to check |
Note what the rule leaves out. It does not ask where the pattern forms, so a “top” inside a range still counts. That is deliberate, because most scanners use the bare shape too.
What 123,147 candles told us
On daily FX the evening star appeared 898 times, about 23.8 times per 1,000 candles. Three days later, price had closed lower only 44.5% of the time. But any daily candle at all was followed by a lower close 48.4% of the time over three days. So the pattern did about four points worse than chance. In plain terms, about 400 of the 898 patterns worked, and the rest did not.
The other horizons told the same story. After one day the pattern closed lower 47.9% of the time against a base of 49.0%. After five days it was 45.6% against 48.4%. Also, the median five-day move went the wrong way: price rose by about 0.14 ATR.
The 15-minute data looked no better. The pattern formed 1,538 times. One bar later it closed lower 46.8% of the time, against a base of 49.9%. Eight bars later it was 48.0% against 49.2%.
| Pattern and data | Count | Follow-through | Base rate |
|---|---|---|---|
| Evening star, D1, 3 days | 898 | 44.5% | 48.4% |
| Evening star, M15, 4 bars | 1,538 | 47.6% | 49.6% |
| Morning star, D1, 3 days | 587 | 52.0% | 51.6% |
| Morning star, D1, 5 days | 587 | 54.4% | 51.6% |
| Morning star, M15, 4 bars | 1,498 | 48.4% | 50.4% |
The mirror pattern is the contrast. On daily FX the morning star did slightly better than chance, but on 15-minute bars it fell below its base rate too.
Reading an evening star candlestick chart
On a live chart, you read the three candles from left to right. First check that candle one is clearly larger than its neighbours. Then check that candle two is small. Finally, check that candle three closes below the middle of candle one’s body, not just below its open.
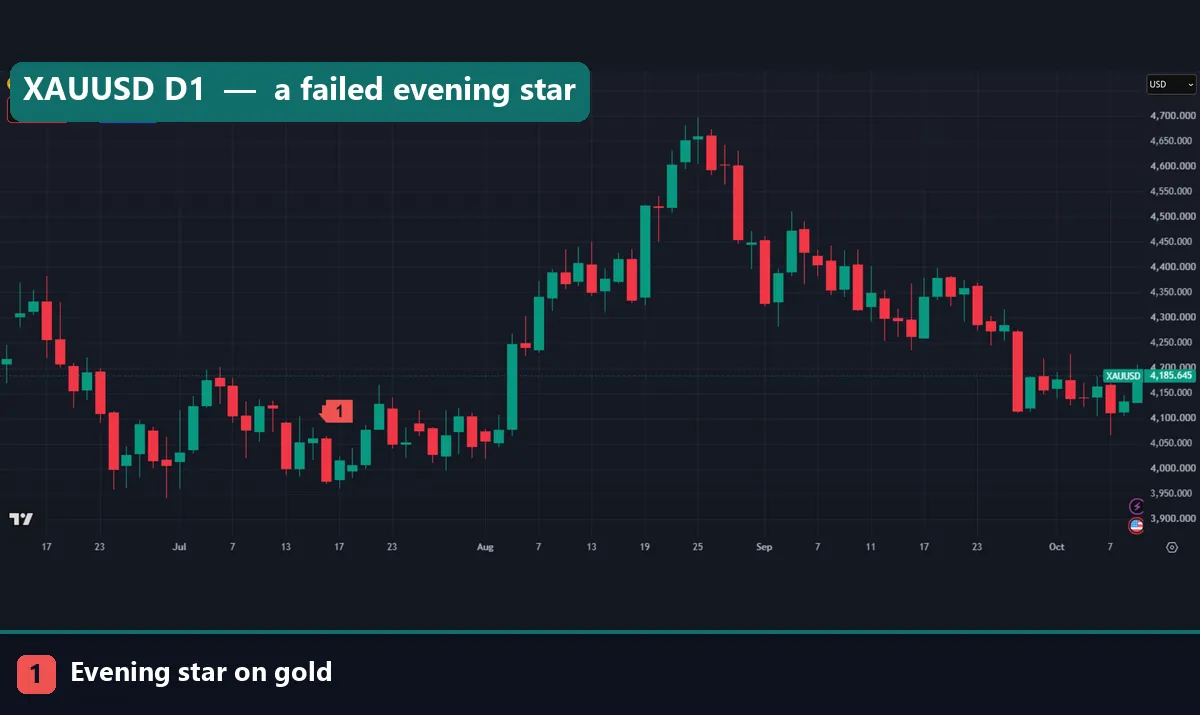
Our gold daily chart shows how the bare shape can mislead. The marked pattern ended on 16 July 2026. Its third candle opened at 4,060.64 and closed at 3,976.58, a drop of about 84 dollars. That looks bearish. However, the next day closed higher, and price spent the rest of July between roughly 3,950 and 4,100. Then gold rallied to near 4,690 in late August. So the pattern sat in a range, not at a top, and it failed.
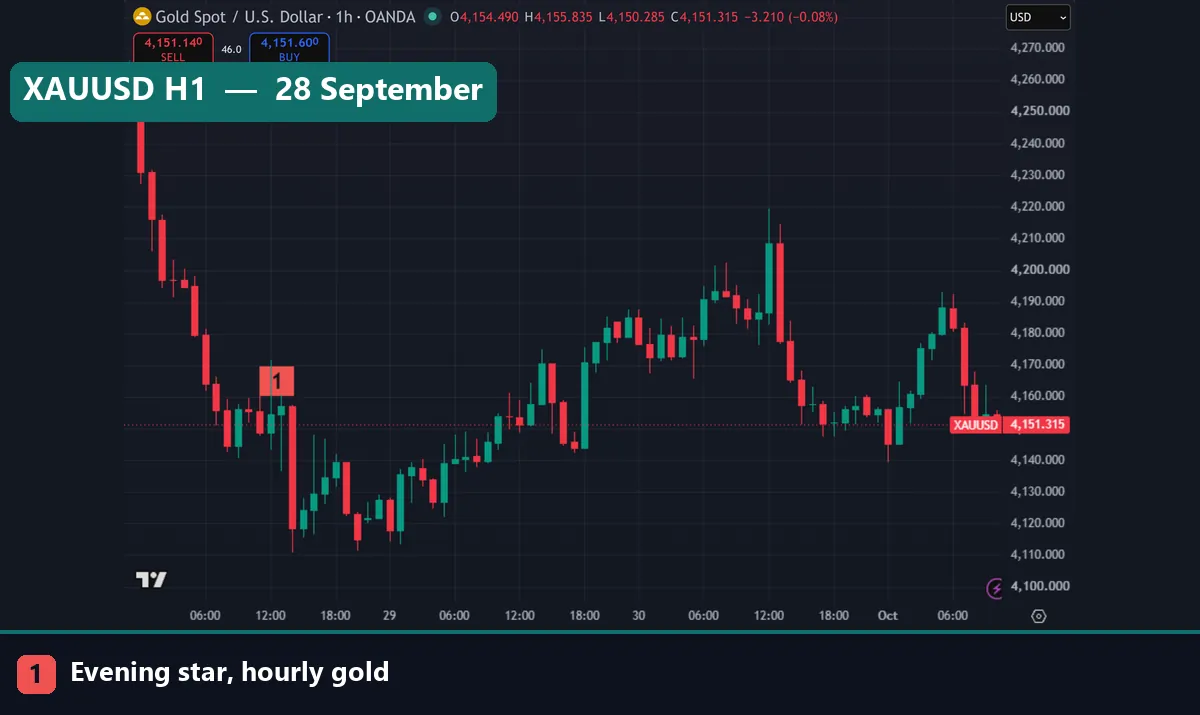
The hourly gold chart tells a different story. The marked pattern ended at 11:00 UTC on 28 September 2026, with candle three closing at 4,148.855. Price drifted up for two hours first. Then a long red candle fell to near 4,110. So by our three-bar test this one worked, but it needed patience and a wide stop.
Worked example: EURUSD daily, 1 July 2026
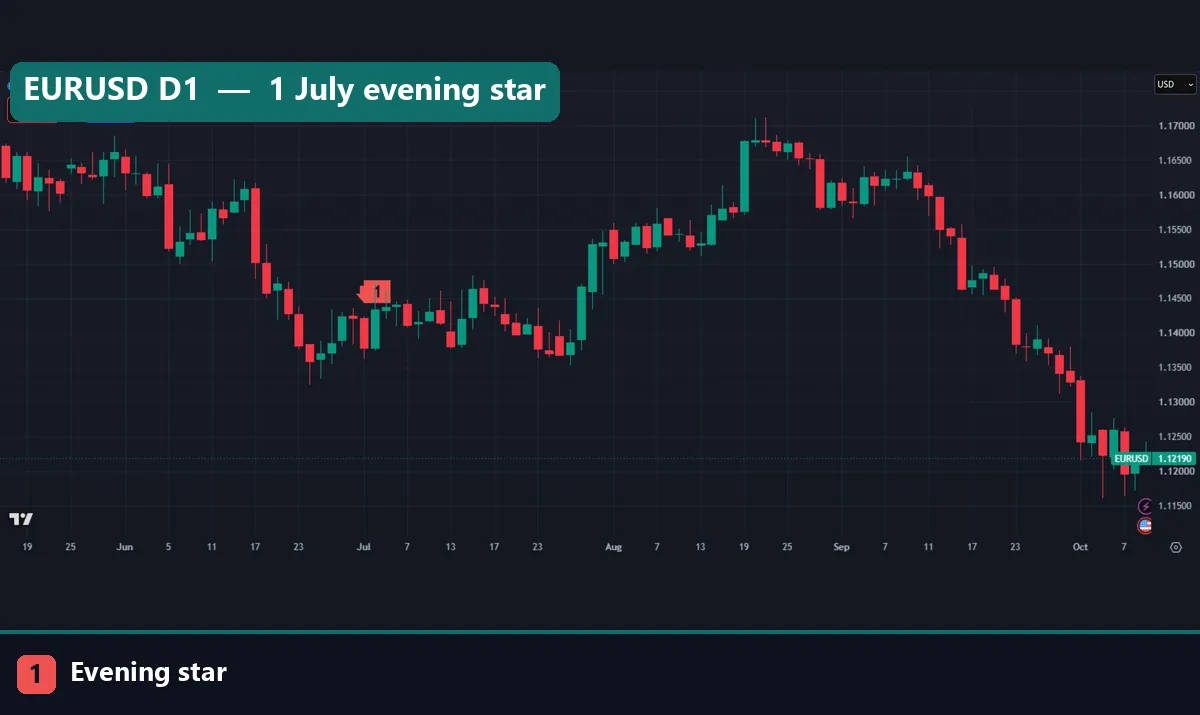
Here is the first chart, step by step. On the OANDA daily feed, the pattern completed on 1 July 2026. Candle three opened at 1.14219, reached a high of 1.14233, fell to 1.13618 and closed at 1.13782. That is a bearish body of about 44 pips inside a range of about 62 pips. It also closed below the midpoint of the bullish candle two days earlier, so it passed our rule.
Now look at what came next in the first image. The next daily candle was green and closed back above the open of candle three. Then EURUSD drifted sideways, roughly between 1.135 and 1.147, for about three weeks. After that it rallied above 1.170 by mid-August.
By our three-day test, this pattern failed. There was also a clue on the chart beforehand. The pattern formed after a short bounce from late-June lows, not after a long advance into a clear high. In short, the shape was right but the location was wrong.
Daily candles also differ between feeds. OANDA’s daily candle closes at 5 pm New York time, while our MetaTrader 4 server day ends at midnight server time (UTC+3 in summer). So a pattern on one feed can be missing on another.
Two 15-minute evening stars
Short timeframes print the pattern often, so we picked two recent cases. On GBPUSD the marked pattern ended at 01:30 UTC on 1 October 2026, with candle three closing at 1.32676. Price slipped to near 1.3255 within the next hour. Then it drifted lower through the Asian session and fell hard after 07:00, to about 1.3193 by 10:00.
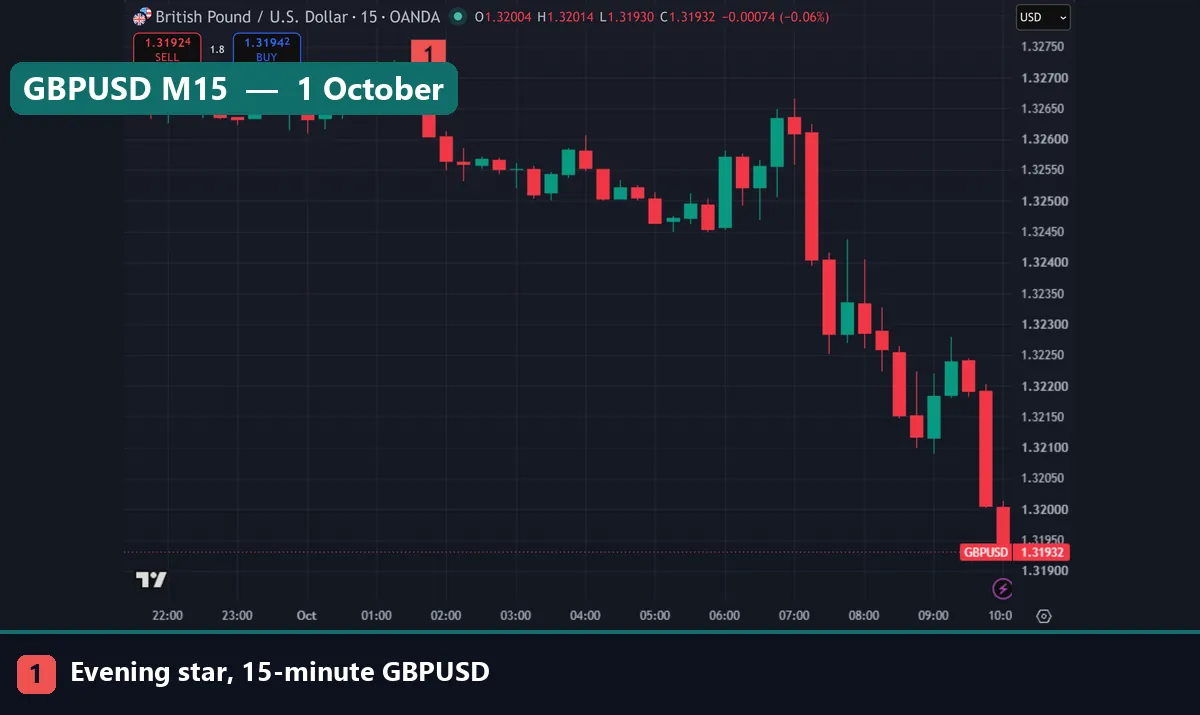
That looks like a clean call. Still, most of the drop came hours later, in London trade. So the pattern came before the move; it did not cause it.
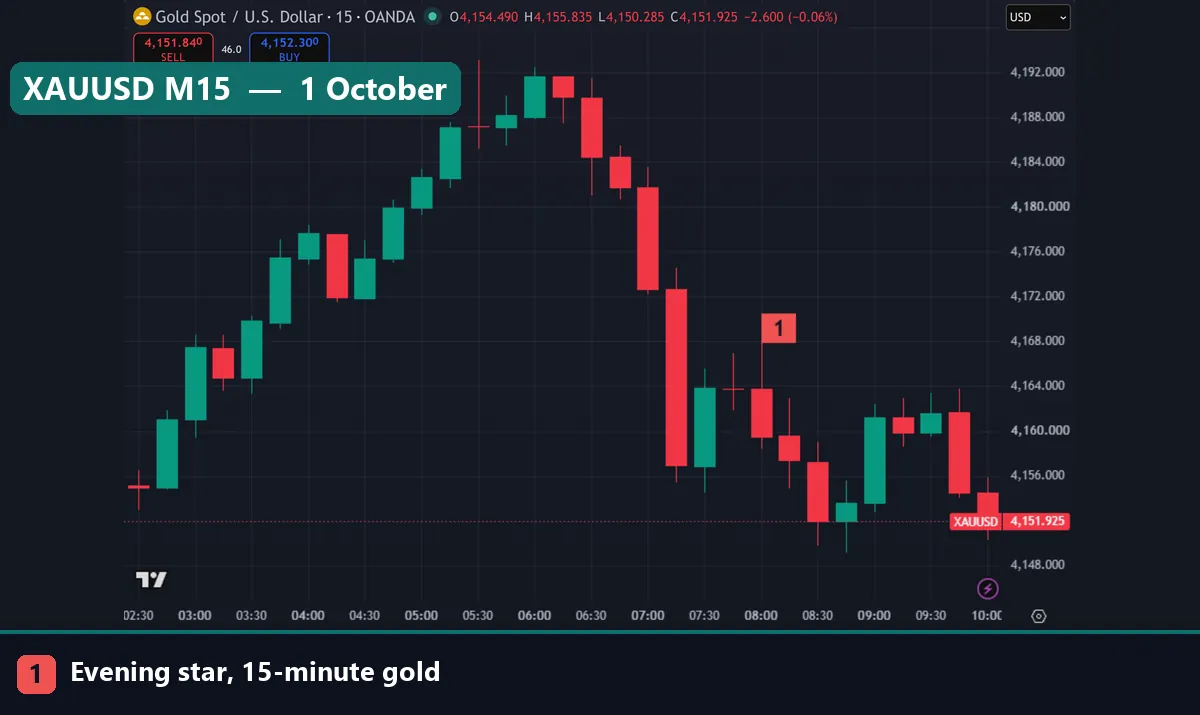
The gold case ended at 08:00 UTC on 1 October 2026. Candle three opened at 4,163.765 and closed at 4,159.525. Price fell to near 4,150 over the next three bars, then a green candle took most of it back. Notice also where it formed. It came after a sharp fall from about 4,192, so it was a bounce inside a decline rather than a top.
Download the complete indicator database
Put these concepts on your charts. One email unlocks the full library of 1,380+ indicators with compiled MT4 and MT5 files, plus my TradingView scripts. No paywall, no spam, unsubscribe any time.
Get free access to my indicator database
One email unlocks 1,380+ free MT4, MT5 and TradingView indicators — the complete library. No single-tool download; you get the whole database.
Where it fails
Our daily numbers say the bare evening star loses to chance on FX. That is the main failure. Here are the weak spots we saw.
- Ranges. In a sideways market the shape forms at random points. Both of our daily examples sat inside ranges, and both failed.
- Upward drift. Daily FX closes rose slightly more often than they fell in our sample. A bearish pattern starts with that headwind.
- Late signal. The pattern completes at the close of candle three. By then a large part of the move may be gone, so the stop above the star sits far away.
- Noise on short timeframes. On M15 the pattern forms often, and most cases are tiny wiggles. Our 15-minute results stayed under the base rate at every horizon.
- Feed differences. Brokers start their days at different hours, so daily patterns differ.
Our broader write-up, do candlestick patterns work, reaches a similar view across many shapes.
The mirror case and a volatility check
The morning star is the evening star turned upside down. On daily FX it did slightly better than chance. But a good average does not make each case good.
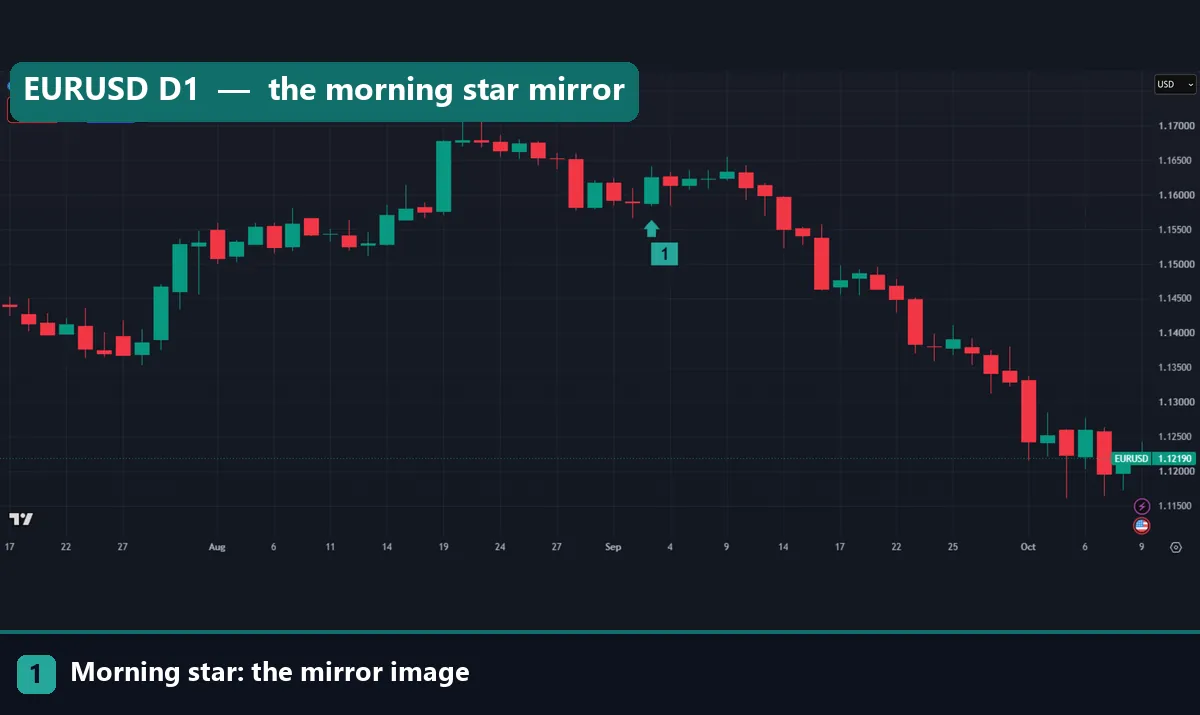
This EURUSD morning star completed on 3 September 2026, with candle three closing at 1.16256. The same candle was also a bullish engulfing. Even so, price stalled near 1.160 to 1.164 for about a week. Then it broke down from 11 September and reached about 1.127 by 1 October. So a bullish pattern sat just above one of the largest falls on the chart.
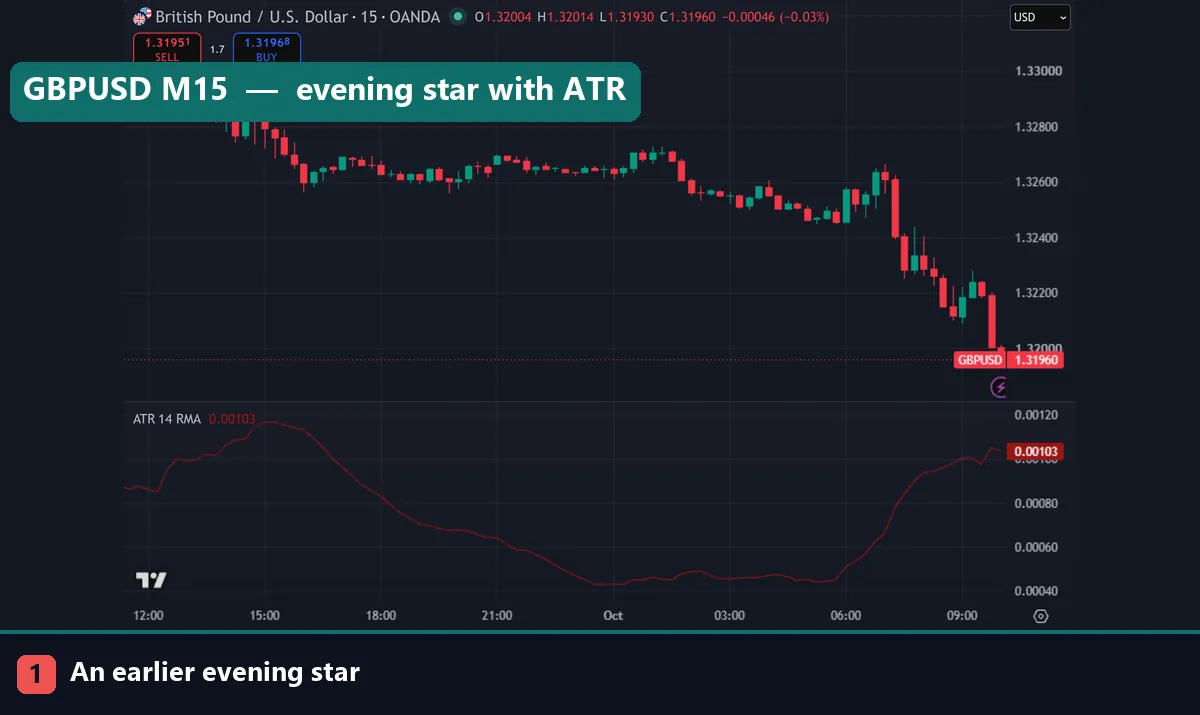
Our last chart adds ATR(14) under a GBPUSD 15-minute evening star from 15:00 UTC on 30 September 2026. Candle three closed at 1.32792. ATR stood near 0.0011, about 11 pips, close to its high for the day. Price then slid to near 1.3260 within about an hour, roughly two ATRs. After that, ATR sank toward 0.0004 overnight and price went flat. So the pattern worked here while volatility was high, then the market went quiet.
What traders add to make it useful
Because the bare shape does not beat chance in our data, traders who still use it add context. Three filters come up most.
- Location at resistance. A pattern at a prior swing high or a clear level has a reason to matter. One in the middle of a range does not. Our guide to candlestick patterns at support and resistance shows how to mark those levels first.
- Higher-timeframe trend. An evening star on H1 against a strong daily uptrend fights the larger flow. Check the next timeframe up first, as set out in multi-timeframe analysis.
- A confirmation candle. Some traders wait for the next candle to close below candle three’s low. That costs price, but it removes some failed cases.
We did not test these filters here, so we have no numbers for them. Treat them as ideas to test, not as fixes.
If you do trade it, put the stop above the star’s high and size from that distance, as our ATR stop-loss distance guide explains.
Common mistakes with the evening star
- Trading the shape alone. Our 898 daily cases did worse than a coin-flip candle. The shape on its own is not a reason to sell.
- Skipping the midpoint rule. A third candle that closes only slightly lower is a pullback, not an evening star. Measure the close against candle one’s midpoint.
- Ignoring where it forms. A star in the middle of a range, or after a sharp fall, is a bounce pattern. Look for a real advance into a level first.
- Trusting one example. A clean chart picture proves little. Our six marked evening stars split four lower and two higher, which is far too few to judge anything.
Where to go next
For the basics of reading candles, start with how to read candlestick charts. Then compare the evening star with other sell patterns in our bearish candlestick patterns list, and with a single-candle cousin in the shooting star candlestick guide.
To have the pattern marked for you, our morning star and evening star indicator flags both shapes in MetaTrader. The candlestick pattern detector indicator scans for many patterns at once. Use them to find cases faster, then judge each one by location.
For outside reading, the candlestick pattern dictionary at StockCharts ChartSchool gives the classic definitions. Thomas Bulkowski’s evening star page on ThePatternSite has his own statistics, built mostly on stock charts. Also see the evening star definition at Investopedia and the short evening star entry on BabyPips Forexpedia, which covers it from an FX angle.
FAQ: evening star questions
What is an evening star candlestick?
It is a three-candle bearish pattern: a large up candle, a small star candle, then a large down candle that closes below the middle of the first candle’s body.
Does the evening star work in forex?
Not on its own in our data. On 898 daily FX cases it closed lower three days later 44.5% of the time, against 48.4% for any candle.
Does the star candle need a gap?
Stock textbooks often ask for one, but FX rarely gaps between days. So we, like most FX traders, did not require a gap.
What colour should the middle candle be?
Either colour works. What matters is that its body is small, which in our rule means under 0.3 times ATR(14).
Is the evening star better on higher timeframes?
Not in our tests. It fell short of the base rate on both daily and 15-minute candles, by about four points and two points at the main horizons.
How is the morning star different?
It is the bullish mirror. On daily FX it did slightly better than chance, reaching 54.4% against a 51.6% base after five days, but it lagged on 15-minute bars.
Where should the stop go on an evening star trade?
Most traders place it above the high of the star candle and size the trade from that distance.
Should I trade the evening star alone?
Our numbers do not support it. Add location, trend and confirmation, test that on your own data, and remember that results are not guaranteed; past performance is not indicative of future results.
Last updated: 1 October 2026.

About the author
Written by Dominic Walsh, a Forex trader and MT4/MT5 indicator, Expert Advisor and script developer. Every tool on forexmt4systems.com is tested on live charts before release and ships with ready-to-use compiled MT4 (.ex4) and MT5 (.ex5) files. Learn more about the trader and developer behind this site.
How we build, test and correct every tool: Editorial & Testing Policy. Trading carries risk; see the disclaimer.