
The Latvian currency was the lats, code LVL, and it served Latvia until the euro replaced it on 1 January 2014. This guide settles three questions: what the lats was tied to, how tight that tie was, and what its rate did against the euro and the dollar. We answer with 3,842 daily reference rates from the European Central Bank.
What the Latvian currency was
The lats was the money of the Republic of Latvia, and its central bank, Latvijas Banka, issued it. English texts use both “lats” and “lat”. The ECB published a daily euro rate for it from the first working day of the euro to the last day of 2013.
Unlike the Deutsche Mark, which the euro absorbed on its first day, the lats kept its own exchange rate for 15 more years. Even so, it never floated freely. It always followed an anchor, and the anchor changed once.
The end date is clear. The European Commission’s page on Latvia and the euro gives 1 January 2014 as the day Latvia adopted the euro, at 0.702804 lats per euro. That conversion rate had anchored the lats since 2005.
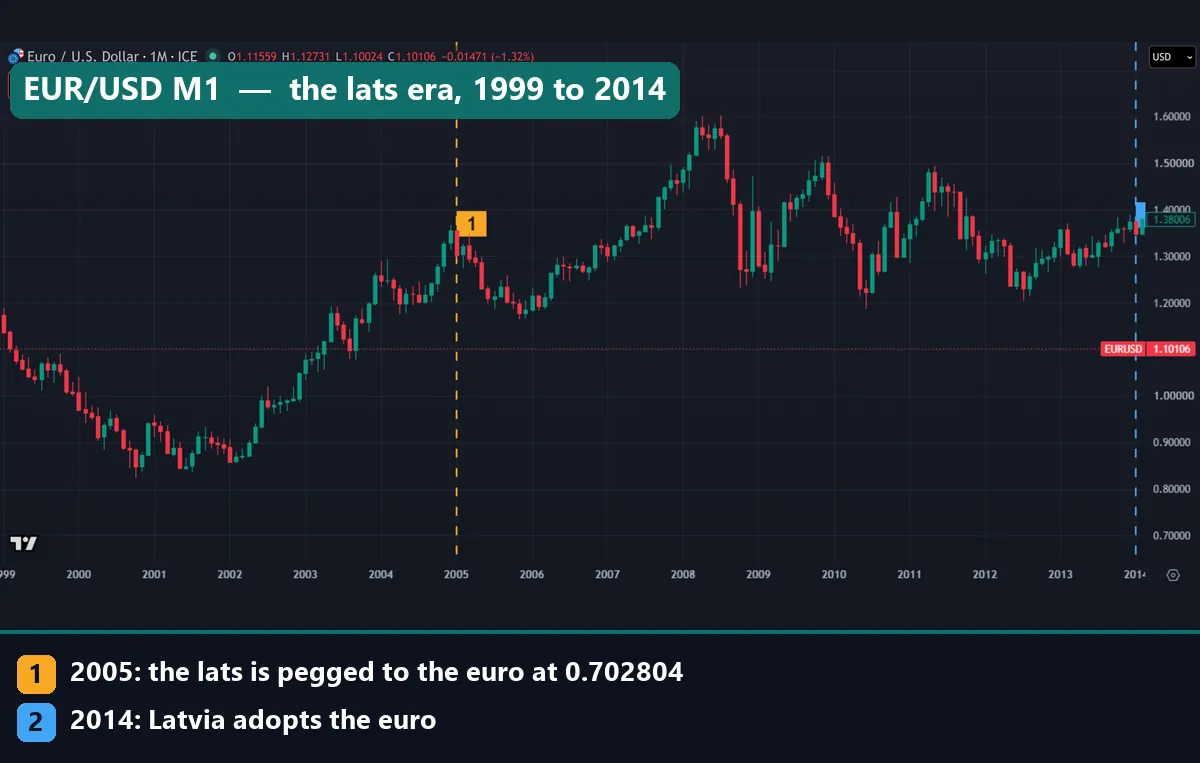
Image 1 needs a warning. TradingView carries no lats series, so it shows FX_IDC EUR/USD by month instead. Marker 1 is the 2005 switch to the euro peg, and marker 2 is the 2014 euro adoption. Between them, the lats-dollar rate was close to this line turned upside down.
How the lats peg worked: two anchors, one band
A peg is a promise about one price. The central bank names a target rate, then trades its reserves to hold the market near it. Latvia made that promise with two anchors.
Up to the end of 2004 the anchor was the Special Drawing Right. That is a basket the IMF builds from several major currencies, the dollar and the euro among them. So when the euro fell against the dollar, it also fell against the basket, and a euro bought fewer lats. That explains why EUR/LVL slid from 0.6668 at the start of 1999 to 0.5191 on 26 October 2000.
Then the anchor changed. The Bank of Latvia’s December 2004 Monetary Bulletin says the lats moved from the SDR to the euro at EUR 1 = LVL 0.702804, in effect from 1 January 2005. The bank would keep the euro rate within 1% of that central rate, the same band width it used before.
Three lines of arithmetic cover everything that follows:
band edges       = 0.702804 x 0.99 = 0.69578   and   0.702804 x 1.01 = 0.70983
distance (%)     = (EUR/LVL / 0.702804 - 1) x 100
lats per dollar  = EUR/LVL / EUR/USD   (both on the same day)
A positive distance means a weaker lats, because it took more lats to buy one euro. The third line matters most to traders. It says the lats-dollar rate needs no market of its own.
How we tested
Since TradingView has no lats series, our measurements rest on the ECB’s euro reference rates. We took two daily series, EUR/LVL and EUR/USD, from 4 January 1999 to 31 December 2013: 3,842 days. Each rate is a single daily snapshot for 14:15 CET, not a closing price.
Next, we ran three checks. First, we divided EUR/LVL by EUR/USD on each day to get an implied lats-per-dollar rate. Second, we measured how far each fixing sat from the 0.702804 central rate after 2005. Third, we correlated daily changes in that implied rate with EUR/USD over 2,304 days of the euro peg.
For the price charts, we used the TradingView web chart with FX_IDC:EURUSD. Image 1 is monthly from 1999 to early 2014. Images 2 and 3 are weekly, for late 2007 to mid-2010 and for 1999 to 2004. Images 4 to 7 are our own plots of the ECB data. Our editorial testing policy sets out how we choose sources and windows.
The peg’s parameters in one table
Each number below comes with its source. The band edges are our own arithmetic.
| Parameter | Value | Source |
|---|---|---|
| Anchor up to 2004 | IMF Special Drawing Right (SDR) | Bank of Latvia |
| Anchor from 1 January 2005 | Euro | Bank of Latvia |
| Central rate | 0.702804 lats per euro | Bank of Latvia, ECB |
| Latvia’s own band | Plus or minus 1% | Bank of Latvia, ECB |
| Band edges | 0.69578 to 0.70983 | Our arithmetic |
| Formal ERM II band | Plus or minus 15% | ECB |
| ERM II entry | 2 May 2005 | European Commission |
| Euro adoption | 1 January 2014, at 0.702804 | European Commission |
One row deserves a second look. The ECB’s April 2005 press release on the lats joining ERM II sets the standard band at plus or minus 15%. Latvia kept its 1% band as a unilateral commitment. So the lats used a fifteenth of the room the mechanism allowed, and pressure showed up fast at the edges.
Reading the Latvian currency on a EUR/USD chart
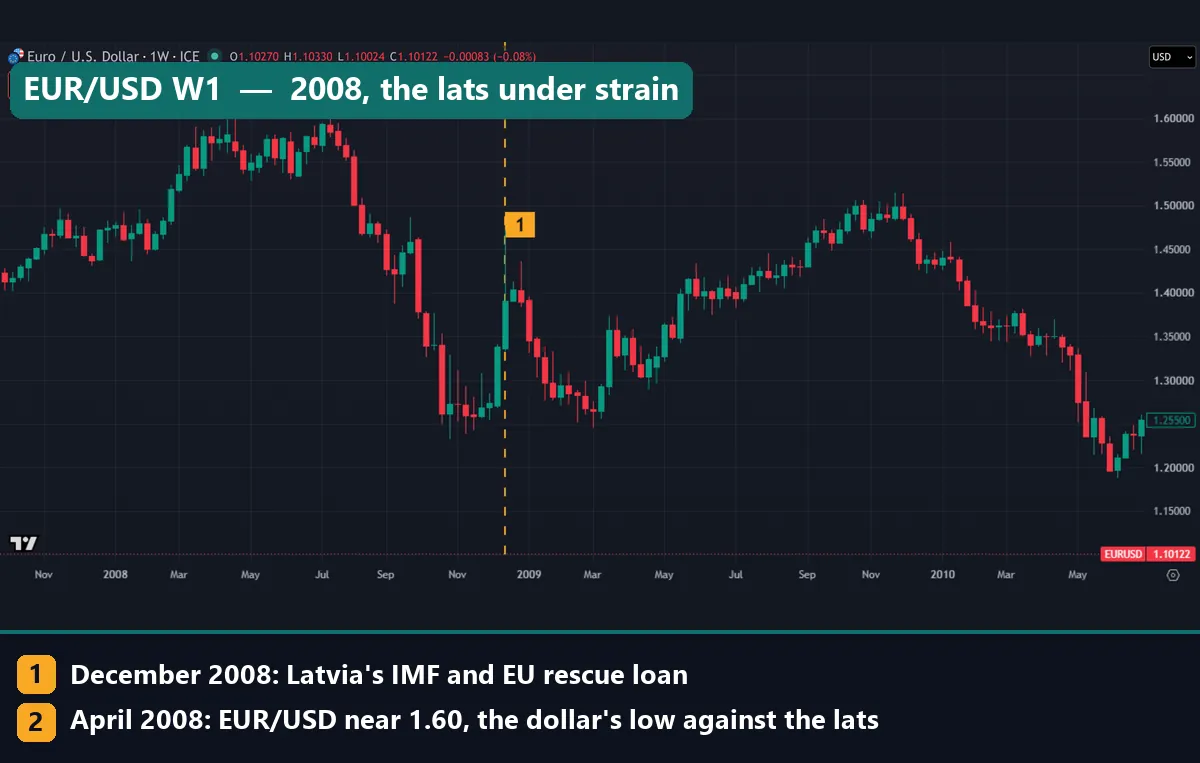
With no lats chart to open, you read the lats through EUR/USD. After 2005 the rule is short. When EUR/USD rises, a dollar buys fewer lats; when it falls, a dollar buys more.
Image 2 shows FX_IDC EUR/USD by week from late 2007 to mid-2010. Marker 2 sits on the April 2008 top near 1.60. On 16 April 2008 the ECB fixed EUR/USD at 1.5928. Our implied rate hit 0.4377 lats per dollar, the strongest lats of our 15 years.
Then the chart turns. EUR/USD slid to the 1.25 area by late October 2008. Marker 1 is December 2008, the month Latvia agreed its rescue loan. The IMF’s staff report on Latvia’s Stand-By request puts the IMF’s share at about €1.7 billion and the EU’s at €3.1 billion. It describes a program built around keeping the peg.
Notice what this chart cannot show: the band. The IMF report says the lats stayed at the “upper (depreciated) band” from early October 2008, while the central bank sold reserves to defend it. Our ECB data agrees, as the year-by-year section shows.
The SDR years on the same chart
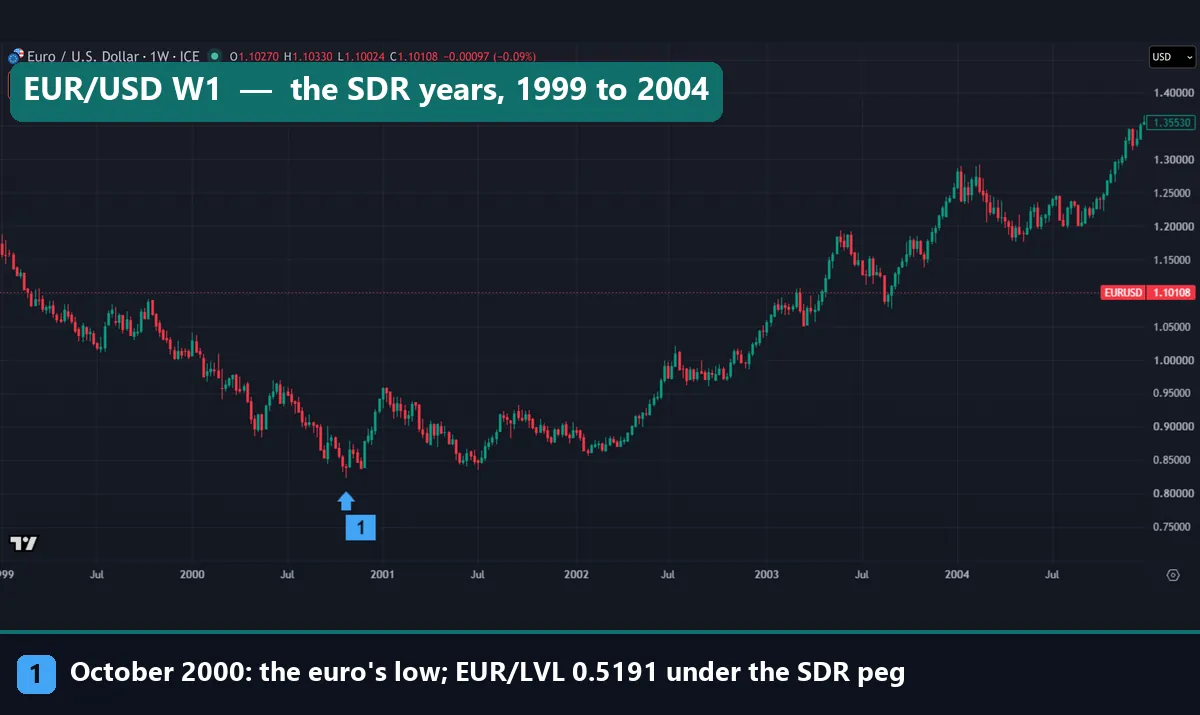
Before 2005 the reading flips. Image 3 shows FX_IDC EUR/USD by week from 1999 to the end of 2004. In these years EUR/USD and EUR/LVL moved the same way, because the lats followed a basket that held the dollar as well as the euro.
Marker 1 is the euro’s low in October 2000. On 26 October 2000 the ECB fixed EUR/USD at 0.8252 and EUR/LVL at 0.5191, the cheapest euro in lats in our data. After that, as EUR/USD climbed to 1.3621 at the end of 2004, EUR/LVL climbed with it to 0.6979. After 2005, a rally like that would lift the lats against the dollar instead.
Worked example: the lats against the dollar on two dates
Here is the conversion by hand, using two days from the ECB file.
Step 1, 4 July 2001. EUR/LVL stood at 0.5494 and EUR/USD at 0.8453. Divide the first by the second: 0.5494 / 0.8453 = 0.6499 lats per dollar. Turn it over, and one lats bought 1 / 0.6499 = 1.5387 dollars. This is the weakest lats against the dollar in the window.
Step 2, 16 April 2008. EUR/LVL stood at 0.6972 and EUR/USD at 1.5928. So 0.6972 / 1.5928 = 0.4377 lats per dollar, and one lats bought 1 / 0.4377 = 2.2847 dollars, the strongest reading.
Step 3, compare. Between those days the lats gained 48.5% against the dollar, since 2.2847 / 1.5387 = 1.485. Yet EUR/LVL rose from 0.5494 to 0.6972, so the lats lost 21.2% against the euro. Both are true at once, because the dollar fell faster than the lats did.
Step 4, a band check. On 19 October 2010 the ECB fixed EUR/LVL at 0.7099. Then 0.7099 / 0.702804 = 1.0101, a distance of +1.01%. That is the weakest lats of the peg years, a hair past our edge of 0.70983. For live sums, our currency converter runs the same kind of cross.
Fifteen years of ECB fixings in two charts
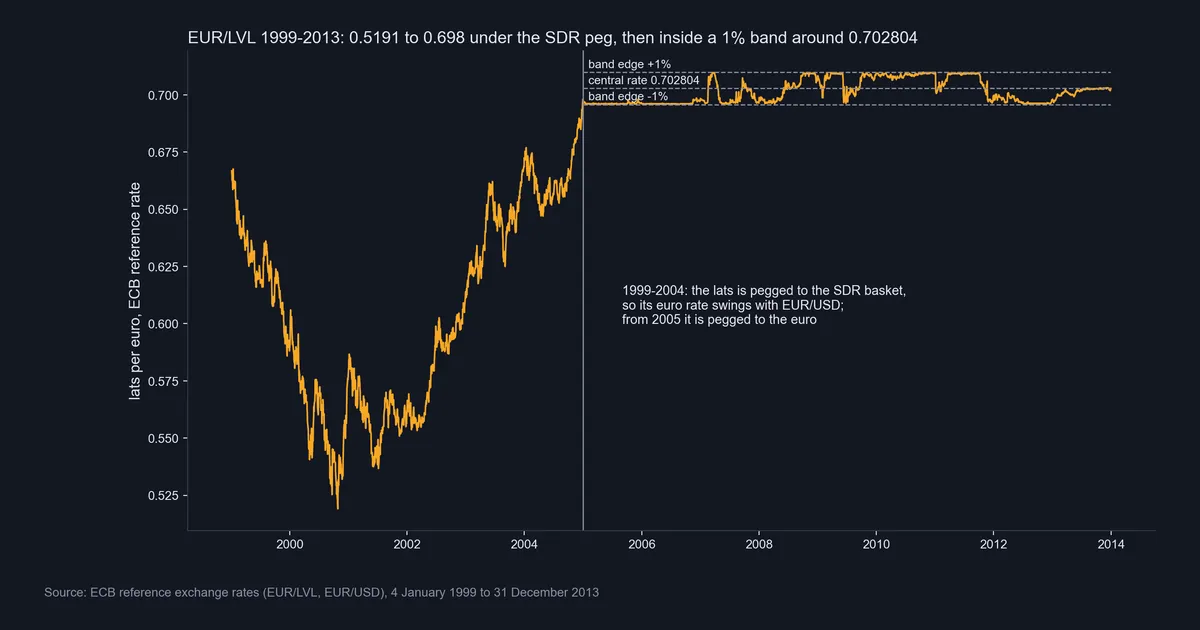
Image 4 plots every EUR/LVL fixing in the window. The left half is the SDR era, with its dip to 0.5191 and its climb to 0.698 by the end of 2004. On the right, the line shrinks into a thin strip between the dashed band edges and rests on each edge for months.
The strip hugs its edges, not its middle. Only 10.3% of days from 2005 sat within 0.1% of the central rate, while 38.0% sat on the weak side. On 31 December 2013 the fixing printed exactly 0.702804, the rate the euro then locked in.
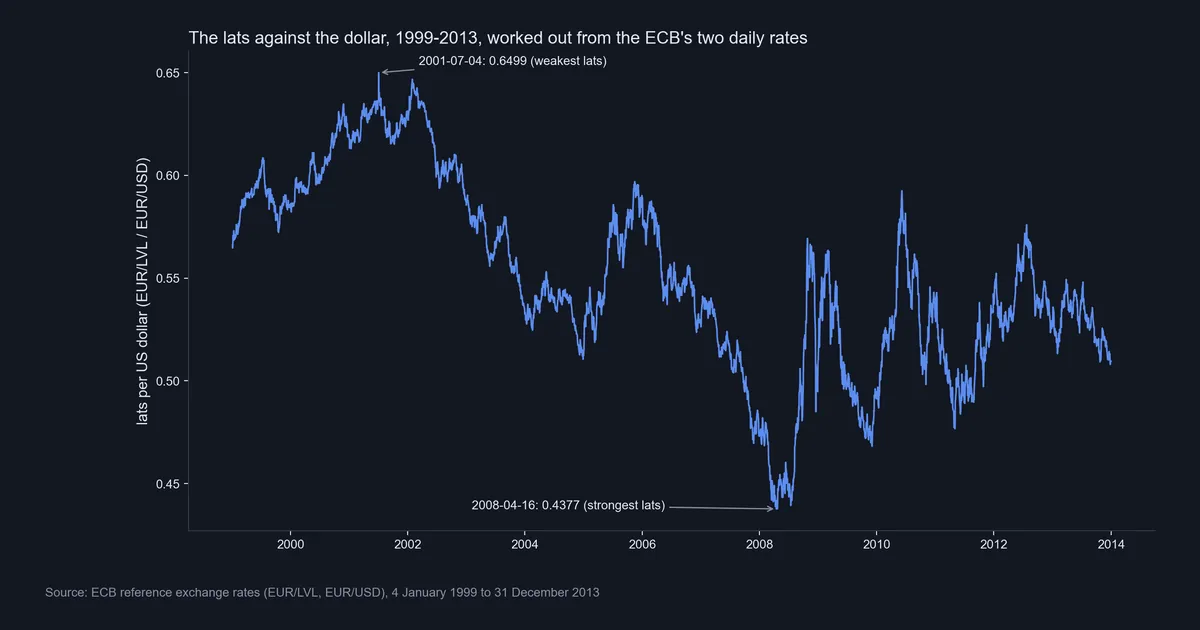
Image 5 turns the same data into lats per US dollar, and this line never went flat. It starts at 0.5656 in January 1999 and ends at 0.5096 in December 2013. The swings after 2008 are EUR/USD moves passed straight through the peg. For the dollar side, see our guide to the dollar index in forex.
Download the complete indicator database
Put these concepts on your charts. One email unlocks the full library of 1,380+ indicators with compiled MT4 and MT5 files, plus my TradingView scripts. No paywall, no spam, unsubscribe any time.
Get free access to my indicator database
One email unlocks 1,380+ free MT4, MT5 and TradingView indicators — the complete library. No single-tool download; you get the whole database.
Where it fails
A reference rate is not the official rate. The ECB’s figure is a daily snapshot for information. It is not Latvijas Banka’s own official rate, and nobody dealt at it. A data vendor’s quote is no closer either. So read the 0.7099 print of October 2010 as a rounded snapshot past the edge, not proof the band broke.
The lats-dollar rate is our arithmetic. We divided two ECB fixings. Real lats-dollar deals carried their own prices and spreads.
Fifteen years is not the whole history. The ECB has no euro rate before 1999, so the earlier years of the lats are missing. Our SDR period covers only its last six years.
Yearly medians hide the jumps. The year-by-year chart gives one number per year. It hides the spring 2007 trip from the strong edge to the weak edge and back, and the short dip in June 2009. Image 4 shows both.
A held peg still had costs. A flat line says nothing about wages, jobs or output. The IMF report pairs the peg with fiscal tightening and bank repair, and no exchange-rate chart can measure that price.
One peg does not predict another. The lats held its central rate through 2008 and 2009. Every peg rests on its own reserves and politics.
Inside the band, year by year
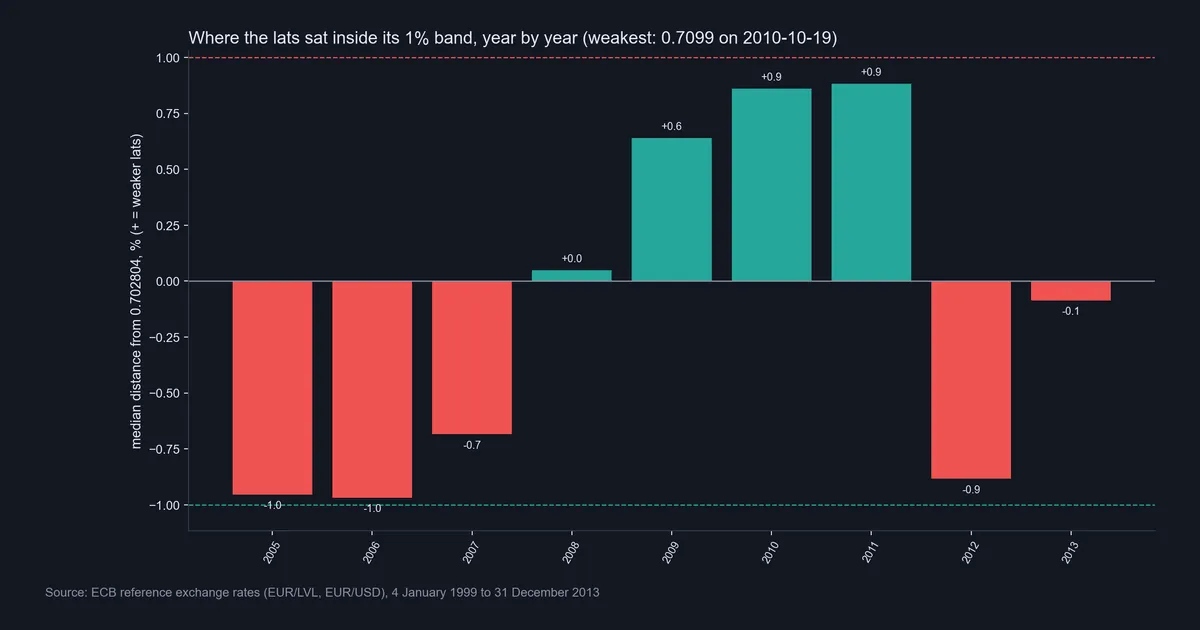
Image 6 shows the median distance from 0.702804 for each year, with positive bars for a weaker lats. In 2005 and 2006 the median sat at -0.954% and -0.968%, right against the strong edge. In 2007 it eased to -0.684%.
Then the crisis flipped the sign. The 2008 median was +0.049%, but that hides a first half near the strong edge and a finish at the weak edge. The medians for 2009, 2010 and 2011 came in at +0.64%, +0.86% and +0.882%. Across 2008 and 2009 the lats spent 100 days at 0.9% or more on the weak side, with a worst reading of 0.981%.
Late in 2011 the rate fell from the weak edge to the strong edge, and the 2012 median landed at -0.883%. By 2013 it drifted back toward the middle, at -0.086%, ahead of the euro switch.
Why the lats-dollar rate mirrors EUR/USD
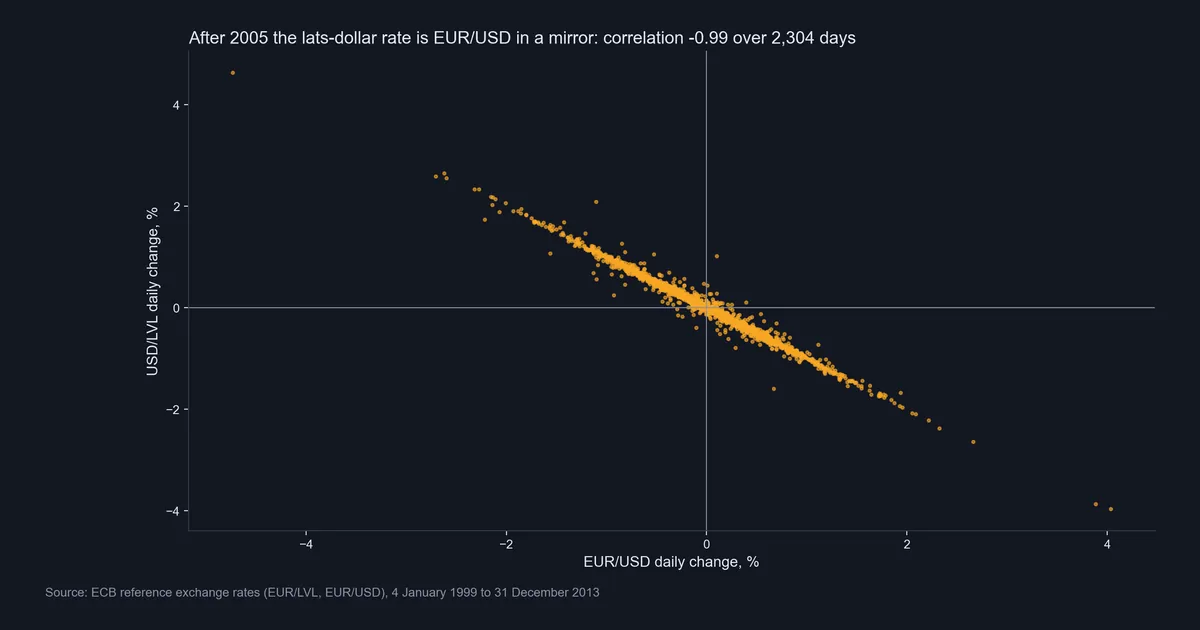
Image 7 plots each day’s change in EUR/USD against the change in our implied USD/LVL rate, from 2005 to 2013. The dots form a tight line sloping down, with a correlation of -0.99 over 2,304 days.
That shape is mechanical. With EUR/LVL pinned inside a 1% band, the lats-dollar rate equals a near-constant divided by EUR/USD. So a 1% rise in EUR/USD shows up as roughly a 1% fall in USD/LVL. Our guide to currency correlation in forex explains how to read a coefficient like this. Here, though, it is just the formula at work, not a trading edge.
Common mistakes with lats data
Four errors come up again and again with old lats rates.
- Reading USD/LVL as Latvian news. After 2005 nearly every move in the lats-dollar rate came from EUR/USD. A big swing in 2008 says more about the dollar than about Riga.
- Calling the 2010 high a devaluation. The 0.7099 fixing sits 1.01% from the central rate. The central rate itself stayed at 0.702804 until the euro took over at that same figure.
- Assuming the lats always followed the euro. Before 2005 it followed the SDR, so a 1999 to 2004 EUR/LVL chart swings by about a third.
- Taking a modern LVL quote at face value. If a converter still lists LVL, its rate can only be today’s euro rate scaled by 0.702804. No lats market exists to set it.
Where to go next
For close cousins of the lats, our page on German money before the euro follows a currency the euro took in on day one. The BGN currency guide shows another euro tie, run at one fixed rate. Our look at whether the euro is stronger than the dollar explains the line that drove the lats-dollar rate.
For the forces behind a peg, read whether central banks trade forex, and how M2 money supply measures a country’s money. Our lists of the most valuable currency in the world and the weakest currency in the world put unit prices in context. To chart the live pair, start with our EUR/USD technical analysis guide and the overview of major currency pairs. For primary sources, use the four official links above.
FAQ about the Latvian currency
What was the Latvian currency called?
It was the lats, code LVL, issued by Latvijas Banka. English sources write both “lats” and “lat”. It stopped being Latvia’s money when the euro arrived on 1 January 2014.
What was the lats pegged to?
It had two anchors in turn. In our data it followed the IMF’s SDR basket from 1999 to 2004. From 1 January 2005 it followed the euro, with a central rate of 0.702804 and a 1% band.
How many euros was one lats worth?
At the conversion rate, one lats equalled 1 / 0.702804 = 1.4229 euros. Against the dollar it peaked at about 2.28 dollars in April 2008.
Can you still exchange lats for euros?
Yes. The European Commission says Latvijas Banka will keep exchanging lat notes and coins for an unlimited period, at the fixed rate. Check the bank for its current terms first.
Did the lats devalue in the 2008 crisis?
No. The central rate stayed at 0.702804 until the euro took over at that rate. Still, the lats sat at its weak edge, with 100 days at 0.9% or more from the central rate in 2008 and 2009.
Why did the lats-dollar rate move so much under a peg?
Because the peg was to the euro, not the dollar. The lats-dollar rate equals EUR/LVL divided by EUR/USD, so it inherited every EUR/USD swing.
Where can I see a lats chart?
TradingView has no lats series. However, the ECB’s reference rate archive holds EUR/LVL from 1999 to 2013, and you can rebuild the lats-dollar line from it, as we did.
Can you trade the Latvian currency today?
No. The lats has no market, and the ECB’s last fixing was 0.702804 on 31 December 2013. History like this explains how a peg behaves under stress, but results are not guaranteed; past performance is not indicative of future results.
Last updated: 16 November 2026.

About the author
Written by Dominic Walsh, a Forex trader and MT4/MT5 indicator, Expert Advisor and script developer. Every tool on forexmt4systems.com is tested on live charts before release and ships with ready-to-use compiled MT4 (.ex4) and MT5 (.ex5) files. Learn more about the trader and developer behind this site.
How we build, test and correct every tool: Editorial & Testing Policy. Trading carries risk; see the disclaimer.