
The price volume trend indicator adds up volume, but it scales each day’s volume by how far price moved in percent. So a big up day on busy tape lifts the line a lot, while a quiet day barely moves it. This guide settles one practical question: does a PVT cross of its own 21-period average tell a forex trader anything? We tested 4,520 daily crosses on 23 currency pairs. In short, the answer was no, and the reasons matter more than the verdict.
What the price volume trend indicator is
Price Volume Trend (PVT, sometimes written VPT) is a cumulative line. It starts at zero on the first bar your chart loads. Then every bar adds or subtracts a slice of that bar’s volume. The slice depends on the percentage change in the close.
So PVT belongs to the same family as On-Balance Volume. Traders use the line in two ways. First, they compare its slope with price to spot divergence. Second, they add a moving average to the line and treat crosses as signals. We tested the second use, because it is the one that turns into a mechanical rule.
One point needs saying early. In spot forex there is no central exchange, so there is no true traded volume. MetaTrader 4 and TradingView’s OANDA feed show tick volume, which counts price changes, not lots traded. Our guide to daily trading volume in forex explains where the real figures come from. Every PVT reading in this article uses tick volume.
How PVT works: the formula
The formula is short:
PVT = previous PVT + volume x (close - previous close) / previous close
Read it from the right. First, the bar’s return is the change in close divided by the prior close. Next, that return multiplies the bar’s volume. Then the product joins the running total. TradingView’s Price Volume Trend help page at TradingView gives the same calculation.
Two side effects follow. First, daily forex returns are small, often a fraction of one percent. So each bar adds only a small share of its tick volume. Second, the starting value is arbitrary. PVT begins wherever your loaded history begins. That is why our charts show negative values such as -9.78K on EURUSD. The level means nothing on its own. Only the slope, and the gap to its average, carry information.
PVT vs OBV: the one difference that matters
On-Balance Volume adds the whole bar’s volume on an up close and subtracts it on a down close. A day that closes one point higher counts the same as a day that rallies hard. Our OBV indicator explainer covers that rule in detail.
PVT fixes the all-or-nothing problem. Because it weights volume by the size of the move, a flat close adds almost nothing. However, both lines still rest on the same volume input. If that input is tick volume, both inherit the same weakness. The volume-price trend entry on Wikipedia gives the same formula.
Also compare it with the Accumulation/Distribution indicator. That one uses where the close sits inside the bar’s range, not the change from the prior close. So the three lines can disagree on the same chart.
How we tested
For the outcome test, we read daily history from a MetaTrader 4 terminal (Capital Point Trading, build 1471). The window ran from 12 June 2018 to 24 August 2026, on 23 FX pairs: AUDCAD, AUDCHF, AUDJPY, AUDNZD, AUDUSD, CADCHF, CADJPY, CHFJPY, EURAUD, EURGBP, EURUSD, GBPAUD, GBPCAD, GBPCHF, GBPJPY, GBPNZD, GBPUSD, NZDCAD, NZDCHF, NZDJPY, USDCAD, USDCHF and USDJPY. We built PVT from tick volume, added a 21-day simple moving average of PVT, and logged every cross. Then we checked the close 10 days later.
For the charts, we used the TradingView web chart with OANDA data on 9 October 2026. We loaded the built-in “Price-Volume Trend” study and put a 21-period moving average on it, in yellow. The charts show 90 bars on EURUSD, GBPUSD, XAUUSD and GBPJPY daily, plus USDJPY and AUDUSD on the 1-hour chart. Our method follows the editorial testing policy. All results are before spread, swap and commission.
Settings and test parameters
TradingView’s built-in PVT has no inputs at all. So the only choices sit around it: which volume, which average, and how long to wait. The table lists what we used.
| Parameter | Our value | Why it matters |
|---|---|---|
| Price input | Close | PVT uses the close-to-close change only |
| Volume input | Tick volume | Forex has no central volume; ticks vary by feed |
| Signal line | 21-period SMA of PVT | Slow enough to filter some noise, as in our charts |
| Signal | PVT crosses the SMA | Bullish cross up, bearish cross down |
| Outcome check | Close 10 bars later | Compared with all bars at the same horizon |
| Timeframe | Daily (test), daily and H1 (charts) | H1 charts show how often crosses flip |
If you prefer a faster line, you can swap the SMA for an EMA. Our page on SMA vs EMA explains the trade-off. But a faster average only adds crosses. It does not add information.
Reading PVT on a chart
Look at the lower pane first. The blue line is PVT and the yellow line is its 21-period average. When blue sits above yellow, recent volume has leaned toward up closes. When it sits below, the lean is down.
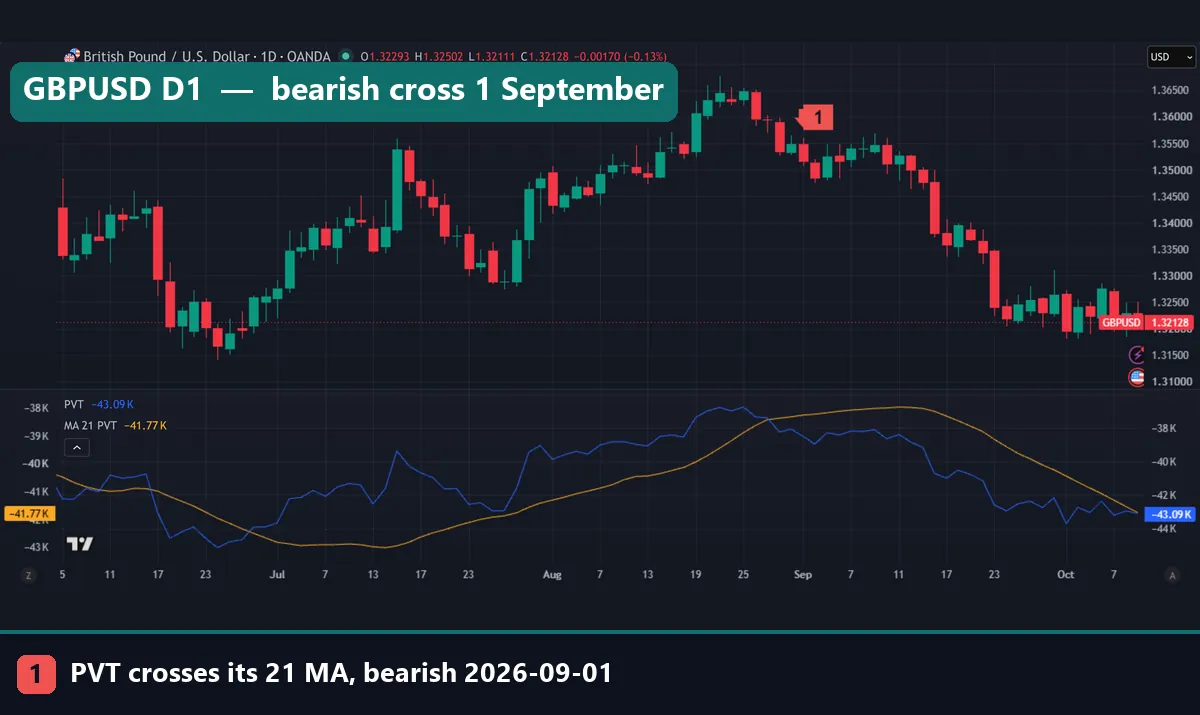
On GBPUSD daily, PVT climbed with price through August 2026 and peaked near the 25 August high. Then it rolled over and crossed below its average on 1 September, at marker 1. The close that day was 1.35160. After that, blue stayed under yellow while price slid. At capture, the pane read -43.09K for PVT and -41.77K for the average.
That looks clean. But the line turned with price, not before it.
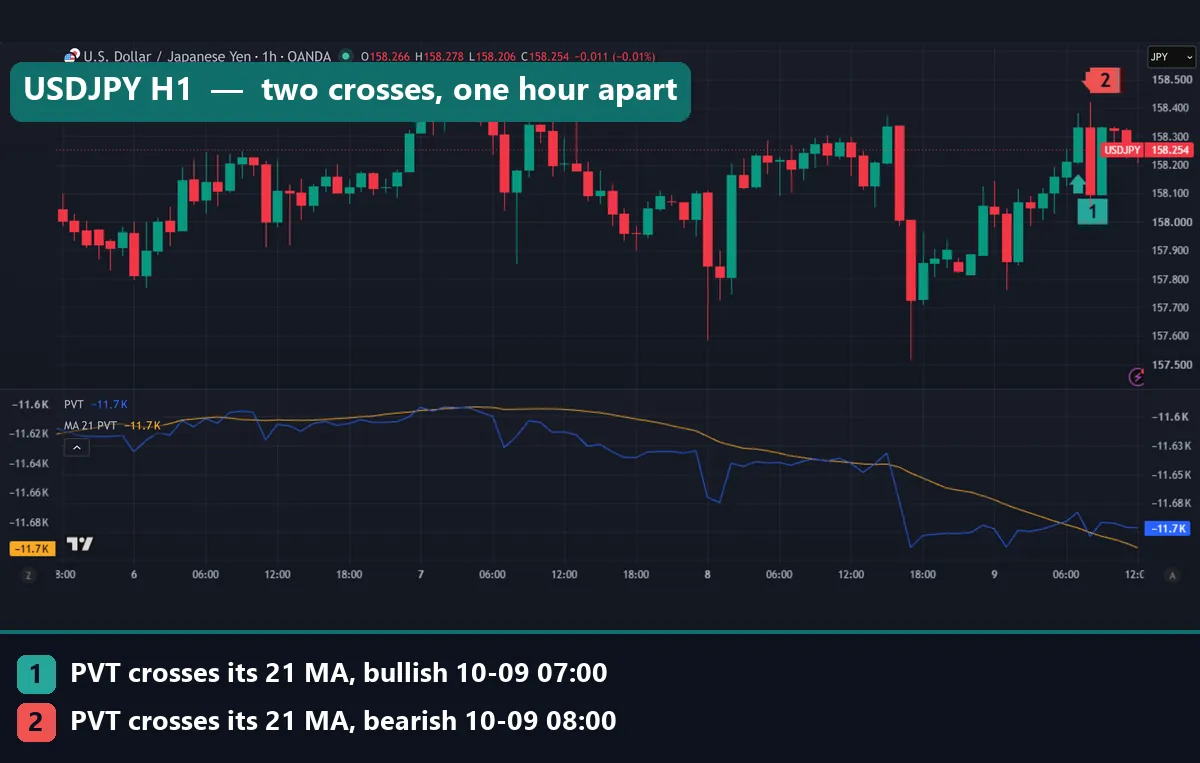
The 1-hour USDJPY chart shows the other side. On 9 October, PVT crossed up at 07:00 UTC with a close of 158.332, marker 1. Then one bar later, at 08:00 UTC, it crossed back down with a close of 158.096, marker 2. At this scale the two lines sit almost on top of each other, both near -11.7K. So any small tick of volume can flip the signal.
Worked example: EURUSD daily, July to October 2026
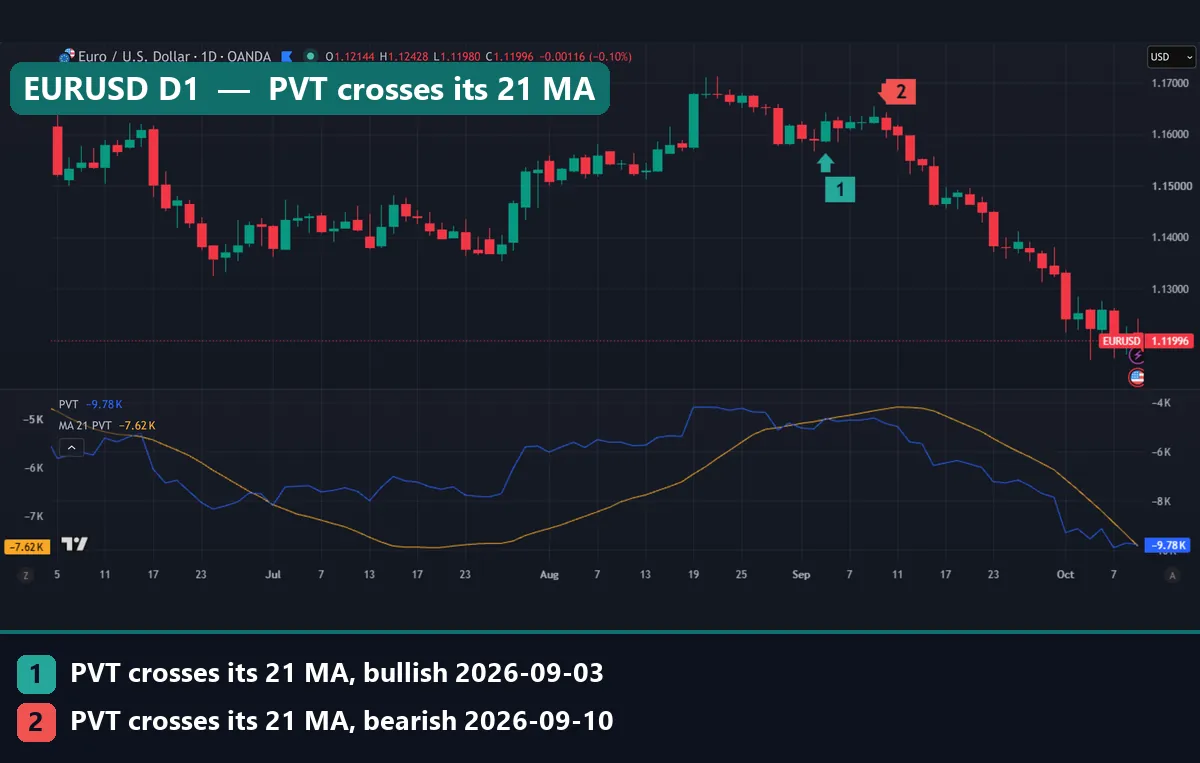
EURUSD shows both faces of the cross in one quarter. Here are the crosses from our TradingView data, with the closing price on each cross bar.
- 23 July 2026: bearish cross, close 1.13775.
- 29 July 2026: bullish cross, close 1.14668.
- 2 September 2026: bearish cross, close 1.15885.
- 3 September 2026: bullish cross, close 1.16256 (marker 1 on the first chart).
- 10 September 2026: bearish cross, close 1.16100 (marker 2).
First, the July pair. A trader who sold the 23 July cross and reversed on 29 July bought back 89.3 pips higher. Next, the September flips. The bearish cross on 2 September lasted one day. Then the long from 3 September to 10 September closed 15.6 pips lower. Both numbers are before costs.
After that, the 10 September cross finally caught a trend. PVT stayed below its average for the rest of the chart, and EURUSD traded at 1.11996 when we captured the chart on 9 October. That is 410.4 pips below the cross close.
So one good cross paid for two bad ones here. However, that is one chart.
What 4,520 crosses showed
Here is the core result. Across 23 pairs, PVT crossed its 21-day SMA about 2.6 times per pair per month.
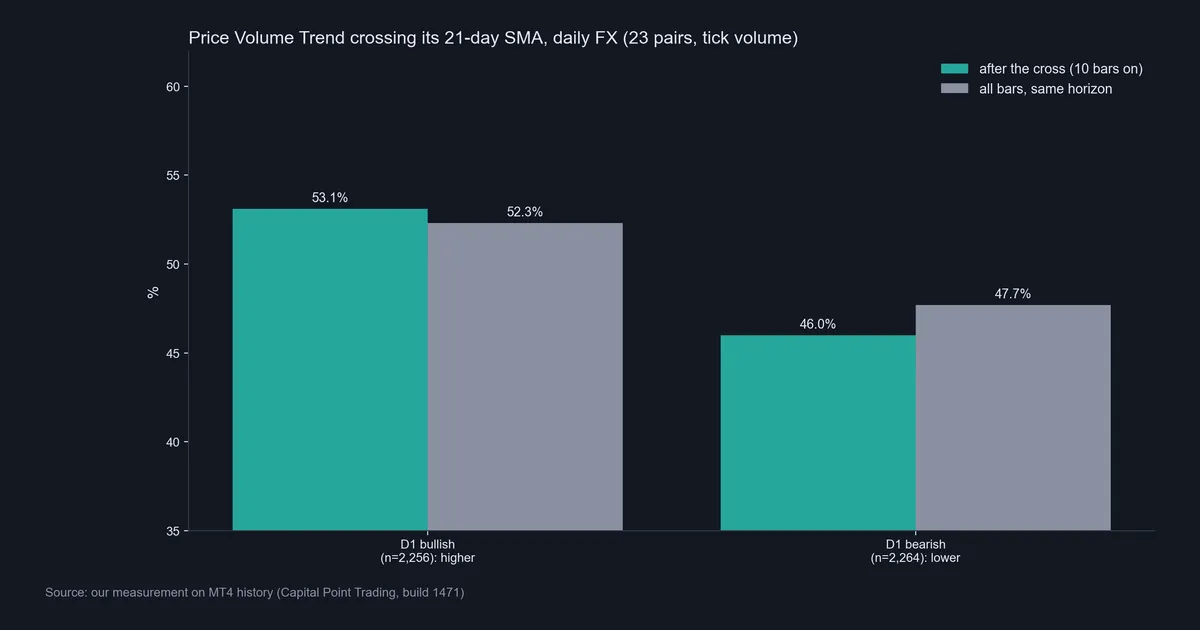
- Bullish crosses: 2,256. Ten days later, 53.1% closed higher.
- Bearish crosses: 2,264. Ten days later, 46.0% closed lower.
- All days, same horizon: 52.3% closed higher 10 days later, so 47.7% closed lower.
So the bullish cross beat the base rate by 0.8 points. That is close to nothing. The bearish cross did worse than a random day by 1.7 points. In plain terms, PVT crosses showed no edge versus simply picking a day.
Why so flat? Because PVT is mostly price. The return term drives the sign of each step. Tick volume only scales it. So a PVT cross is close to a slow momentum cross on price, and those lag. By the time the line turns, the candles have already turned.
Gold shows the lag
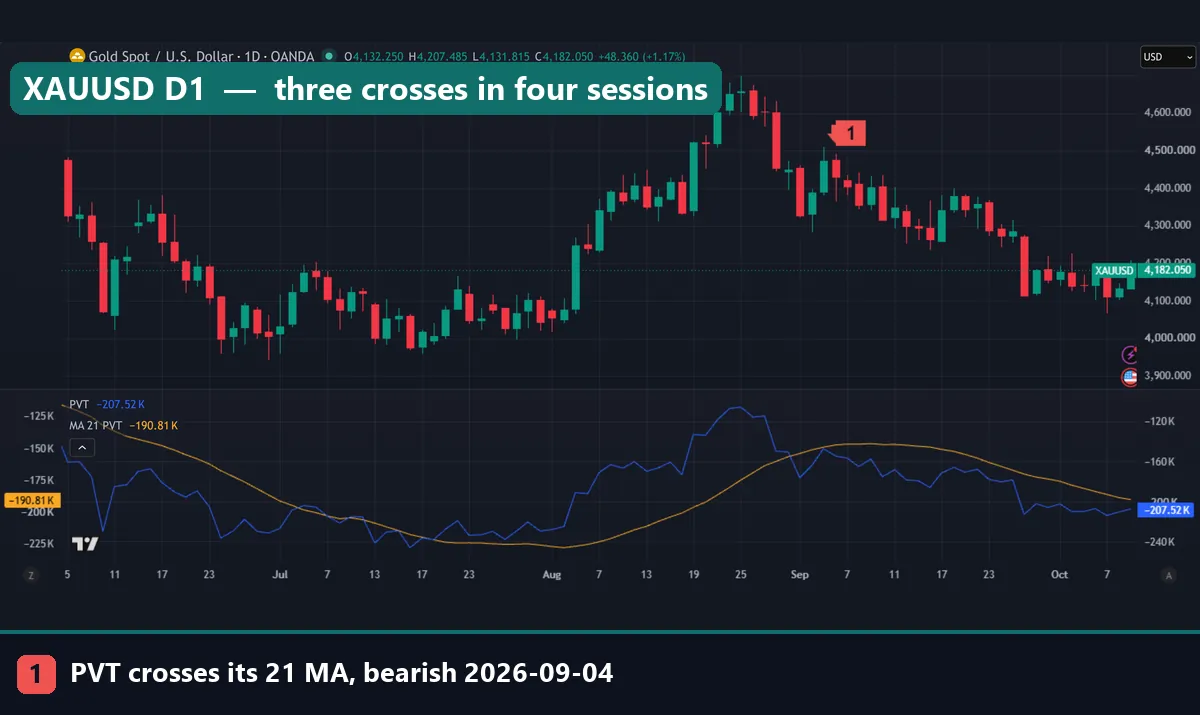
Gold makes the lag visible. XAUUSD is not in our 23-pair test, but the chart shows the same behaviour. PVT crossed down on 1 September at a close of $4,328.41, up on 3 September at $4,472.97, then down again on 4 September at $4,429.83, marker 1. That is three signals in four sessions. Gold did fall afterwards, to $4,182.05 at capture. But a trader following every cross would have been whipsawed first.
Download the complete indicator database
Put these concepts on your charts. One email unlocks the full library of 1,380+ indicators with compiled MT4 and MT5 files, plus my TradingView scripts. No paywall, no spam, unsubscribe any time.
Get free access to my indicator database
One email unlocks 1,380+ free MT4, MT5 and TradingView indicators — the complete library. No single-tool download; you get the whole database.
Where it fails
PVT fails in four specific ways.
- The volume is not real volume. Tick counts reflect how often your feed updates the quote. Two brokers give two different PVT lines for the same pair. Our MT4 values and the OANDA values on TradingView do not match, and neither is wrong.
- The level is meaningless. The line starts at zero on your first loaded bar. So “PVT at a new high” depends on how much history you loaded.
- It lags price. Since the return term sets the direction, PVT turns with price, not ahead of it. We saw that on GBPUSD, EURUSD and gold.
- It churns when the average goes flat. When PVT and its SMA run side by side, every small bar flips the cross. Then you get several signals in a few bars, each one before costs.
Our data adds a fifth point. On daily FX, the cross rule did no better than the base rate. So the signal itself, not just its timing, is weak.
Two charts where the crosses churned
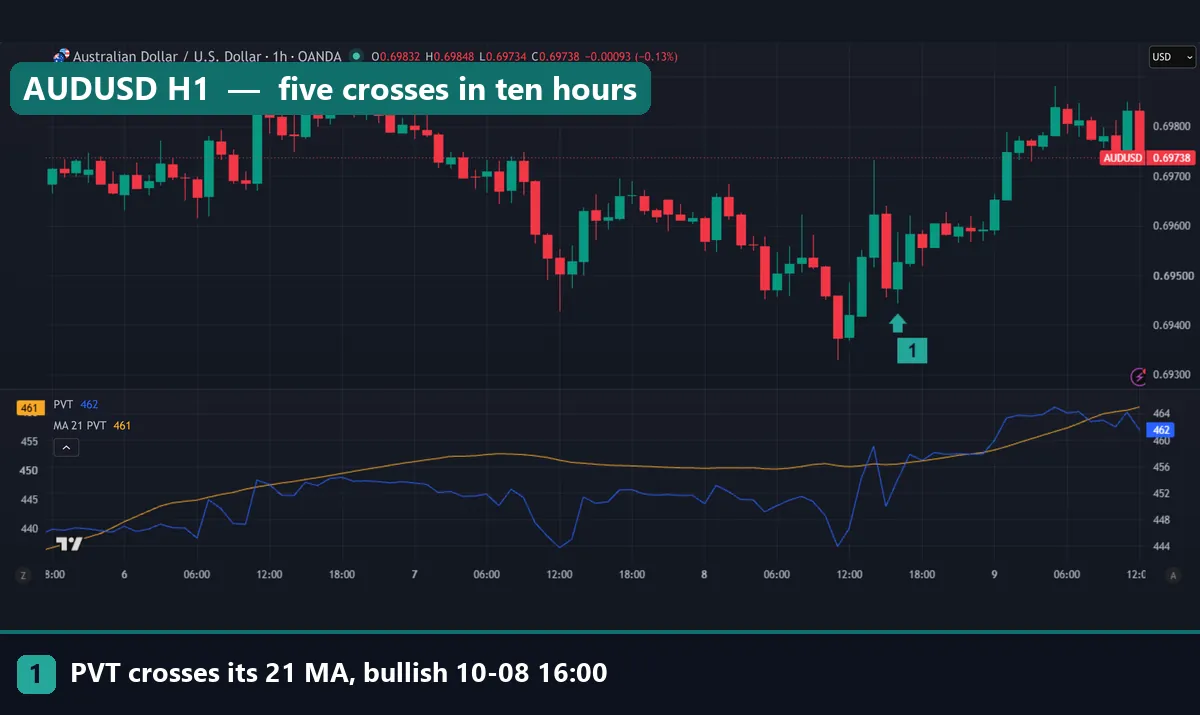
On AUDUSD 1-hour on 8 October 2026, PVT crossed its average at 07:00, 09:00, 13:00, 15:00 and 16:00 UTC. That is five crosses in ten hours. Marker 1 shows the last one, a bullish cross with a close of 0.69526. At capture the pane read 462 for PVT and 461 for the average. A one-point gap cannot carry a trade decision.
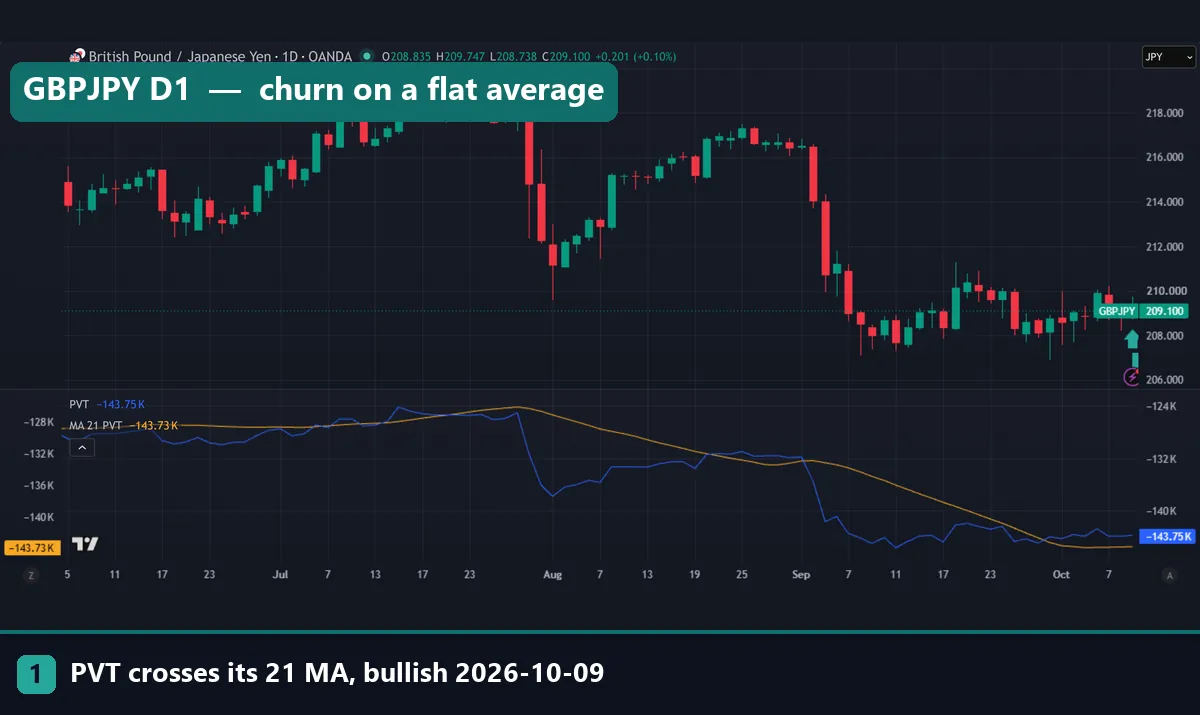
GBPJPY daily did the same thing over a week. PVT crossed up on 2 October, down on 5 October, up on 6 October, down on 7 October and up again on 9 October. The last cross, marker 1, sat on a bar that was still open when we took the shot. So it could vanish before the close. At capture, PVT read -143.75K and its average read -143.73K. Again, the two lines were nearly equal, and the signal was noise.
Common mistakes with PVT
- Treating tick volume as traded volume. It is a count of quote changes. Read it as activity, not as money flow. Our volume spread analysis guide covers the same caveat.
- Comparing PVT values across pairs or platforms. The numbers depend on start date, feed and tick count. Only compare the shape of one line on one chart.
- Acting on a cross inside an open bar. The GBPJPY example shows why. Wait for the bar to close, or the cross may disappear.
- Calling a PVT turn a leading signal. Our tests showed it turning with price. Our page on leading vs lagging indicators explains why most volume lines lag.
What PVT is still useful for
A failed cross rule does not make the line worthless. Instead, use it as a check on what price already shows. For example, a breakout on a strong PVT slope had busier tick activity behind it than one on a flat line. That is context, not a trigger.
Divergence is the other use. If price makes a new high while PVT does not, activity behind the move is fading. We did not test PVT divergence here. So treat it as a question to ask, not an answer. Our primer on divergence in trading shows how to mark it without forcing it.
Finally, combine it with a level. A PVT turn at a level from support and resistance means more than a turn in the middle of a range. Also see how to combine indicators without doubling up on price.
Where to go next
If you want other volume tools for MetaTrader, start with our list of the best volume indicators for MT4. The Money Flow Index indicator is a bounded alternative that also weighs volume by price. Then see our volume indicator guide for day trading for intraday use. Our downloads are compiled files only; the MT4 and MT5 install guide shows where to put them.
For the moving average side of the cross, read moving averages explained. For outside sources, the CopyTickVolume reference in the MQL5 documentation shows that MetaTrader exposes tick counts, not lots. Also, the BIS Triennial Central Bank Survey 2025 measures the real size of FX turnover, which no single feed can show.
FAQ: price volume trend indicator
What does the price volume trend indicator measure?
It measures cumulative volume weighted by the percentage change in the close. A big percentage move adds a large share of that bar’s volume. A tiny move adds very little.
Is PVT the same as OBV?
No. OBV adds or subtracts the whole bar’s volume based only on the direction of the close. PVT scales volume by the size of the move. So PVT ignores flat closes that OBV would count in full.
Does PVT work in forex without real volume?
It runs on tick volume, which counts quote changes. That gives a rough activity measure. But it is not traded volume, and it differs between brokers and data feeds.
What settings does TradingView’s PVT use?
The built-in Price-Volume Trend has no inputs. You add any signal line yourself. We used a 21-period simple moving average of PVT, drawn in the same pane.
Did PVT crosses beat random entries in your test?
No. Bullish crosses closed higher 10 days later 53.1% of the time against a 52.3% base rate. Bearish crosses closed lower 46.0% of the time against 47.7%. Both are within noise.
Why is my PVT value negative?
Because the line starts at zero on your first loaded bar and only adds up from there. If returns since then were mostly negative on busy bars, the total is negative. The level itself carries no meaning.
Which timeframe suits PVT best?
Our daily test found no edge, and our 1-hour charts showed even more flips. Higher timeframes give fewer crosses, but fewer crosses did not mean better ones in our data.
Can I trade PVT divergence instead of crosses?
You can study it, but we did not test PVT divergence here, so we cannot vouch for it. Treat it as context next to price structure. As with any method, results are not guaranteed; past performance is not indicative of future results.
Last updated: 9 October 2026.

About the author
Written by Dominic Walsh, a Forex trader and MT4/MT5 indicator, Expert Advisor and script developer. Every tool on forexmt4systems.com is tested on live charts before release and ships with ready-to-use compiled MT4 (.ex4) and MT5 (.ex5) files. Learn more about the trader and developer behind this site.
How we build, test and correct every tool: Editorial & Testing Policy. Trading carries risk; see the disclaimer.