
The stock market open time in New York is 9:30 a.m. Eastern Time, Monday to Friday, and the core session runs until 4:00 p.m. This guide settles what happens at 9:30, how the open converts to your clock and how half days work. It also shows what 460 sessions of SPY bars say about the first and last 30 minutes. In short, the open moves price the most, but the close trades the most shares.
What the stock market open time actually is
Most people mean two US exchanges: the New York Stock Exchange and Nasdaq. Both keep the same core hours. The NYSE hours and calendars page lists the core session as 9:30 a.m. to 4:00 p.m. ET. Nasdaq’s trading hours page gives the same times.
The open is a single auction at 9:30 a.m. sharp. The close is another auction, at 4:00 p.m. Nasdaq’s page lists pre-market trading from 4:00 a.m. and after-hours trading until 8:00 p.m. Our guide to pre-market trading covers that early window.
The session runs on weekdays only. It skips US market holidays and stops at 1:00 p.m. on a few half days. The S&P 500 and the other big stock market indices only update between the bells.
How the opening and closing auctions work
An auction gathers orders first and then trades them all at one price. At NYSE, the pre-opening session starts at 6:30 a.m. ET for its own listings. Orders sent then wait in a queue until the Core Open Auction at 9:30 a.m. At that moment the exchange matches as many buy and sell orders as it can at one price. After that, continuous trading takes over.
The close mirrors the open. NYSE runs a closing imbalance period from 3:50 p.m. to 4:00 p.m. Then the Closing Auction prints at 4:00 p.m. That auction sets the official closing price, the one funds and benchmarks mark to.
Two simple formulas sit behind our numbers.
gap %         = (today's open - previous close) / previous close x 100
slot share %  = 15-minute bar volume / session volume x 100
We took the median of each across many days. A median ignores the wildest sessions. So it shows a normal day, not an average pulled around by a few shocks.
How we tested
We pulled bars on the TradingView web chart on 16 and 17 November 2026. The 17 November bars had not finished forming, so we left them out. The main series is AMEX:SPY, the SPDR S&P 500 ETF. TradingView files it under the AMEX prefix, while State Street’s SPY fund page lists NYSE Arca as its exchange. The fund tracks the S&P 500, so its tape works as a stand-in for the broad market.
- AMEX:SPY, 15-minute bars, regular session only (TradingView’s default), New York time.
- Window: 14 January 2025 to 16 November 2026, with 460 full sessions and 459 opening gaps.
- Half day: a session whose last bar starts at or before 12:45 p.m. We found three.
- CME_MINI:ES1!, the continuous E-mini S&P 500 future, hourly, 11 July 2025 to 16 November 2026.
A gap counts as filled when price trades back to the previous close in the same session. We did not test a trading rule. The method follows the site’s editorial testing policy.
The session timetable in New York and UTC
The official times below come from the NYSE and Nasdaq pages. New York switches between EST and EDT, so the UTC columns move by an hour twice a year.
| Session | New York (ET) | UTC, US winter | UTC, US summer | Source |
|---|---|---|---|---|
| Pre-market trading | 4:00 a.m. to 9:30 a.m. | 09:00 to 14:30 | 08:00 to 13:30 | Nasdaq, NYSE Arca |
| NYSE pre-opening (orders queue) | 6:30 a.m. | 11:30 | 10:30 | NYSE |
| Opening auction | 9:30 a.m. | 14:30 | 13:30 | NYSE |
| Core session | 9:30 a.m. to 4:00 p.m. | 14:30 to 21:00 | 13:30 to 20:00 | NYSE, Nasdaq |
| Closing imbalance period | 3:50 p.m. to 4:00 p.m. | 20:50 to 21:00 | 19:50 to 20:00 | NYSE |
| Closing auction | 4:00 p.m. | 21:00 | 20:00 | NYSE |
| After-hours trading | 4:00 p.m. to 8:00 p.m. | 21:00 to 01:00 | 20:00 to 00:00 | Nasdaq |
| Half-day close | 1:00 p.m. | 18:00 | 17:00 | NYSE |
Here is the 9:30 a.m. bell in other cities, worked out from the same offsets.
| City | New York on EST | New York on EDT |
|---|---|---|
| London | 14:30 | 14:30 |
| Frankfurt, Paris | 15:30 | 15:30 |
| Mumbai | 20:00 | 19:00 |
| Singapore, Hong Kong | 22:30 | 21:30 |
| Tokyo | 23:30 | 22:30 |
London and Frankfurt keep the same local open all year, with one catch. The US changes clocks on the second Sunday in March and the first Sunday in November. The UK and the EU change on the last Sundays of March and October. In those few weeks the bell rings at 13:30 in London. Our time zone converter guide covers the same offsets for currency sessions.
Reading the open on a 15-minute chart
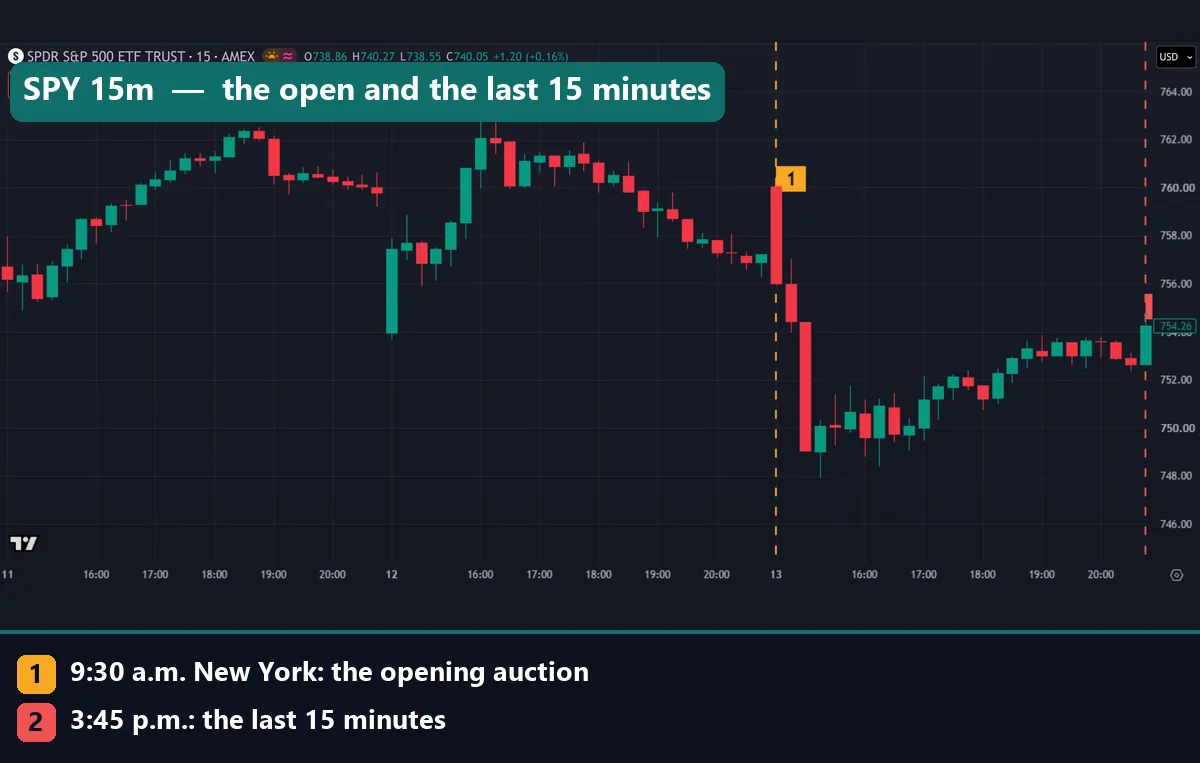
Start with the chart at the top of the page. It shows three SPY sessions, 11 to 13 November 2026, on 15-minute bars. Our axis runs on UTC, so the 9:30 a.m. bell shows as 14:30. Marker 1 sits on the 13 November opening bar. Marker 2 sits on the 3:45 p.m. bar, the last 15 minutes of that day.
Look at the jumps between days. Each session starts away from where the last one ended, because news and futures keep moving overnight. On 13 November SPY opened near the 760 line, above the previous close. The opening bar fell to about 756, and the next two bars took price below 750. So the day’s high printed in the first 15 minutes. The low came in the 10:15 a.m. bar.
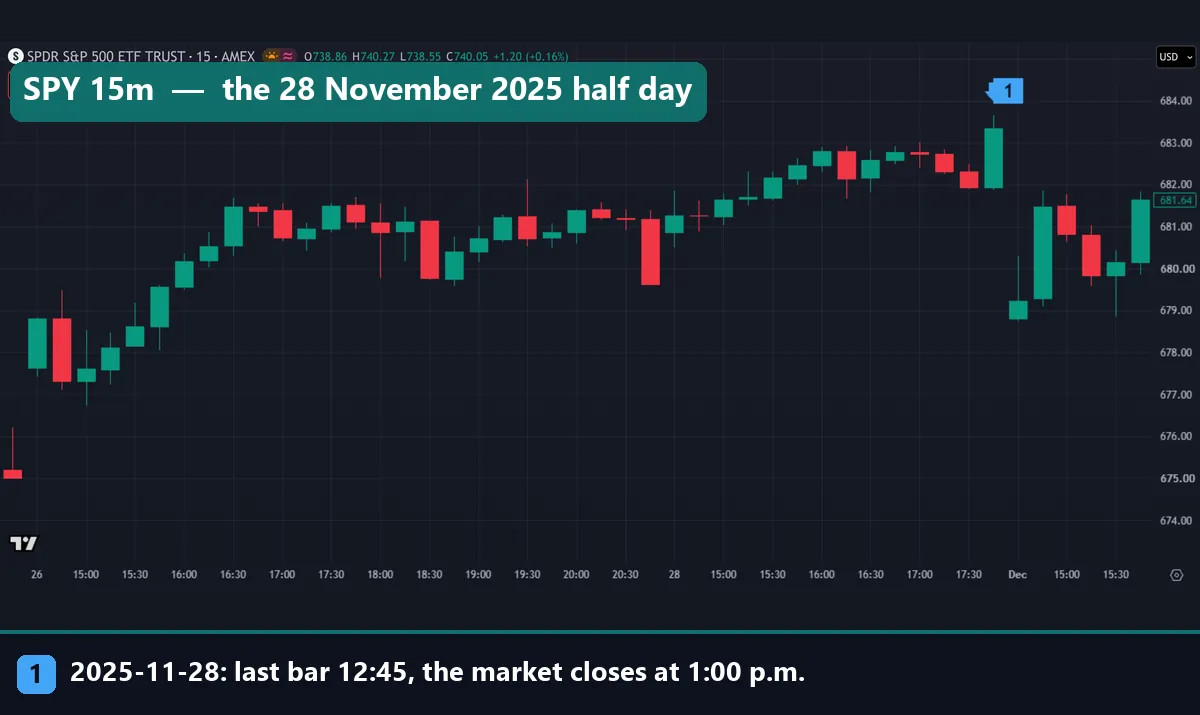
Half days look different. Friday 28 November 2025 was the day after Thanksgiving. SPY’s last regular bar started at 12:45 p.m., because the market shut at 1:00 p.m. That session held 14 bars instead of the usual 26. Thanksgiving itself, 27 November, does not appear on the axis. The short day ended with its tallest bar, a hint that the closing auction still runs, just three hours early.
Futures trade before the bell
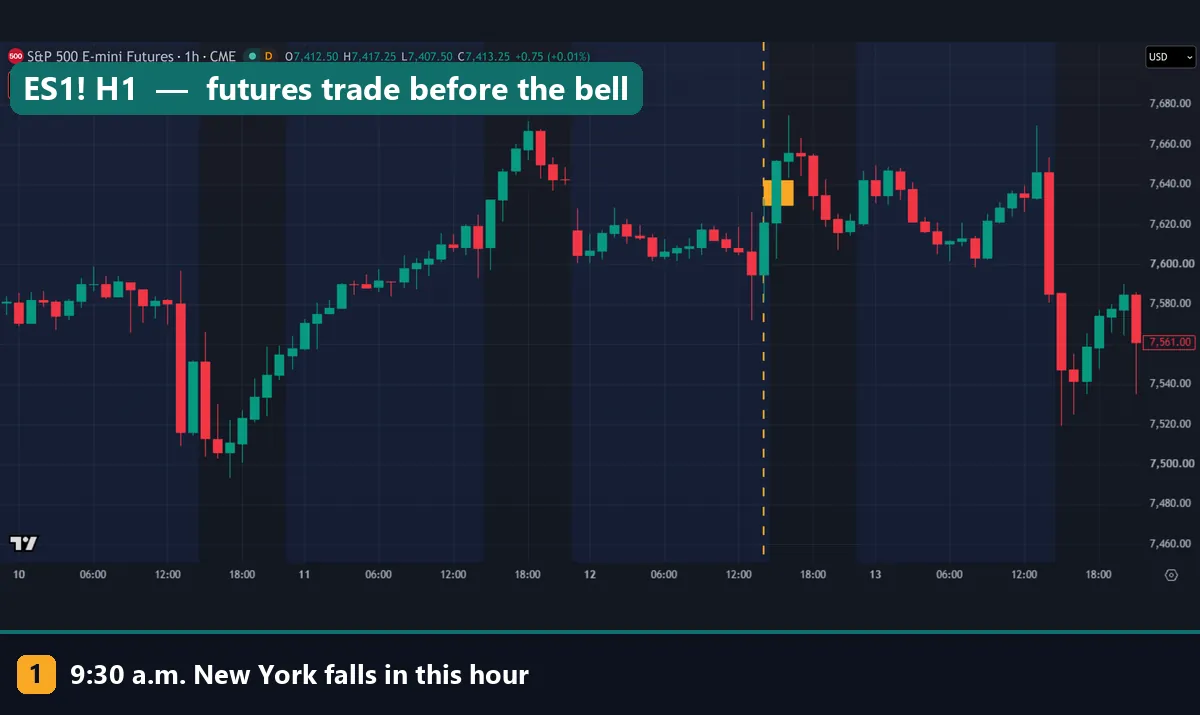
The 9:30 bell only governs the cash market. E-mini S&P 500 futures trade on CME almost around the clock. The chart above shows them from 10 to 13 November 2026, on hourly bars. Marker 1 is the hour that contains 9:30 a.m. New York on 12 November. On this capture the darker bands line up with the cash session, and the tinted hours show overnight trade.
Futures often react first. On 10 November a long red bar came in the 8:00 a.m. New York hour, before the cash market had opened. Even so, 69.1% of E-mini volume in our window traded during NYSE regular hours. That is 6.5 hours of a roughly 23-hour trading day. CME pauses from 5:00 p.m. to 6:00 p.m. New York time. TradingView’s help note on 1! continuous futures explains how ES1! stitches dated contracts together. For the currency side of the clock, see our page on forex market hours.
Worked example: one gap and one half day
Start with the 12 November 2026 open in our first image. SPY closed 11 November just under the 760 line and opened 12 November near 754. That is a drop of about 6 dollars, or roughly 0.8%.
Next, compare it with the window. The median gap across 459 sessions was 0.306%. This one ran at more than twice that size. Gaps over 0.5% came on 29.8% of days, so it was large but not rare. Then check the fill. Price climbed back above the prior close in the 10:45 a.m. bar. So this gap filled the same day, as 56.2% of gaps did. That is close to a coin toss, which is why a gap alone says little about direction.
Now the half day. On 28 November 2025 the session held 14 bars, or 54% of a normal 26-bar day. Yet it traded 0.62 times the volume of a median full day. Christmas Eve 2025 matched that. The 3 July 2025 half day reached 0.90 in the same 14 bars.
Last, the close. The median 3:45 p.m. bar carried 14.74% of SPY’s daily volume. The quietest slot, 1:45 p.m., carried 2.15%. So the final 15 minutes trade about 6.9 times the shares of the midday lull.
Where SPY volume sits through the day
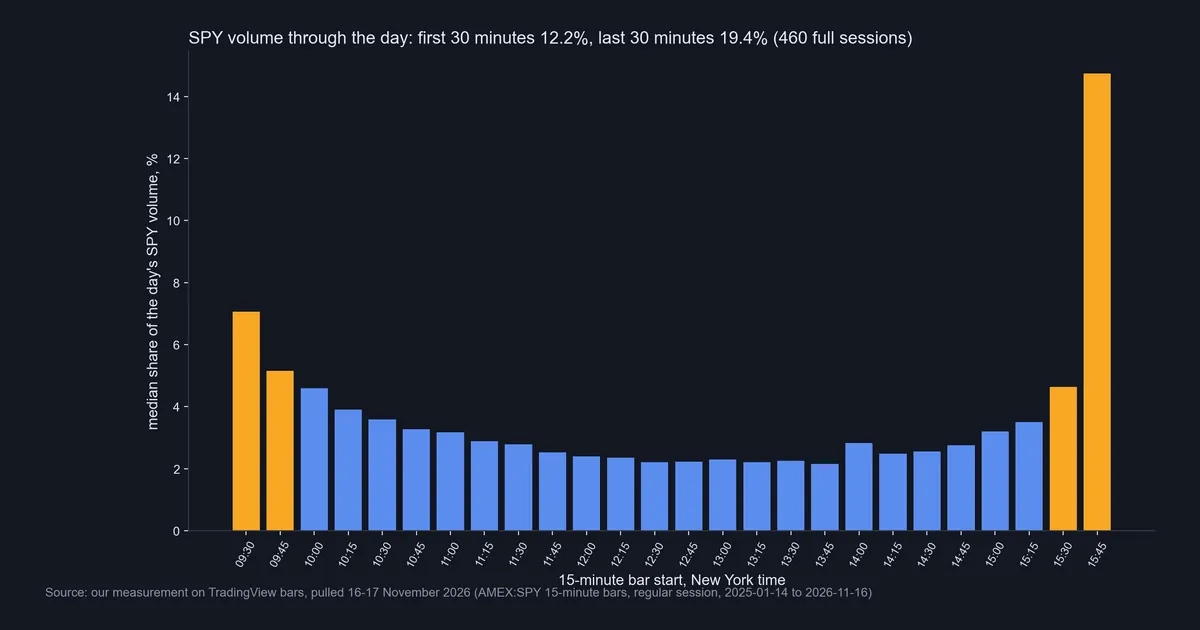
This chart plots SPY’s median volume share per 15-minute slot. It has a U shape, though the right side stands far taller. The 9:30 a.m. bar carried 7.07% and the 9:45 bar 5.15%. Together, the first 30 minutes held 12.2%. Volume then fades into a midday trough of about 2.2% per slot.
The afternoon builds back slowly. There is a small bump at 2:00 p.m., at 2.83%. A steady climb starts at 3:00 p.m. The 3:30 bar carried 4.64% and the 3:45 bar 14.74%. So the last 30 minutes held 19.4%. That final bar runs into the 4:00 p.m. closing auction, likely why it towers over the rest. Our guide to the New York trading session shows how the same hours look in currencies.
Highs, lows and range at both ends of the day
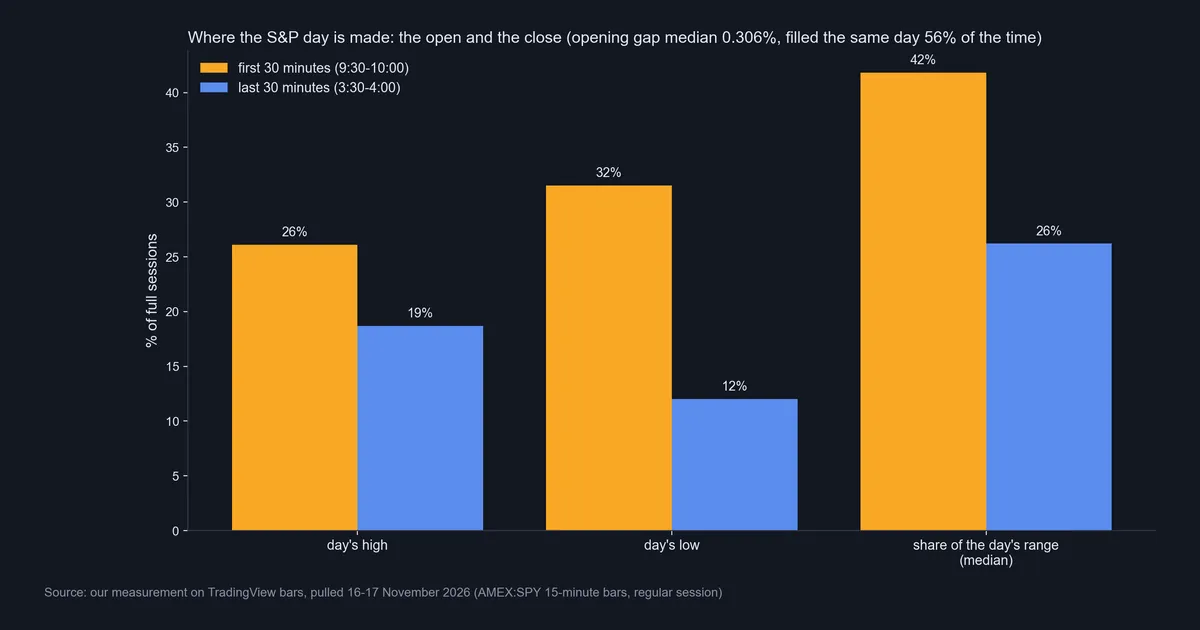
Volume is one thing, and price movement is another. The first 30 minutes covered a median 41.8% of the day’s range. The last 30 minutes covered 26.2%. So the open moves price more, while the close trades more shares.
Where do the extremes print? The high came in the first 30 minutes on 26.1% of days, and the low on 31.5%. In the last 30 minutes, the figures were 18.7% and 12.0%. The flip side matters as much. On roughly three days in four, the high came after 10:00 a.m. On about two days in three, so did the low. A loud first bar sets the tone less often than it feels. Tools such as an opening range breakout indicator box this first stretch, so you can see when price leaves it.
Download the complete indicator database
Put these concepts on your charts. One email unlocks the full library of 1,380+ indicators with compiled MT4 and MT5 files, plus my TradingView scripts. No paywall, no spam, unsubscribe any time.
Get free access to my indicator database
One email unlocks 1,380+ free MT4, MT5 and TradingView indicators — the complete library. No single-tool download; you get the whole database.
Where it fails: the limits of these numbers
First, this is one ETF over 22 months. Single stocks behave differently. A company that reports earnings before the bell can gap far more than the index. Small caps also have thinner order books at the open. Our guide to FAANG stocks shows how much weight a few names carry in the index.
Second, our bars cover the regular session only. Every pre-market and after-hours move folds into the opening gap. So that figure mixes overnight news with the open itself. Third, volume is what TradingView’s feed reports. Another vendor may count it differently. The size of the 3:45 bar also depends on how a feed books the closing auction.
Fourth, medians hide the tails. A median gap of 0.306% says nothing about the worst morning in the sample. A flash crash can rip through a day’s range in minutes. Finally, none of this is a trading edge. A 56.2% fill rate, before spreads and commissions, sits close to a coin toss. Calendars also change, so check the NYSE page each year.
Index bars, overnight gaps and a fast day
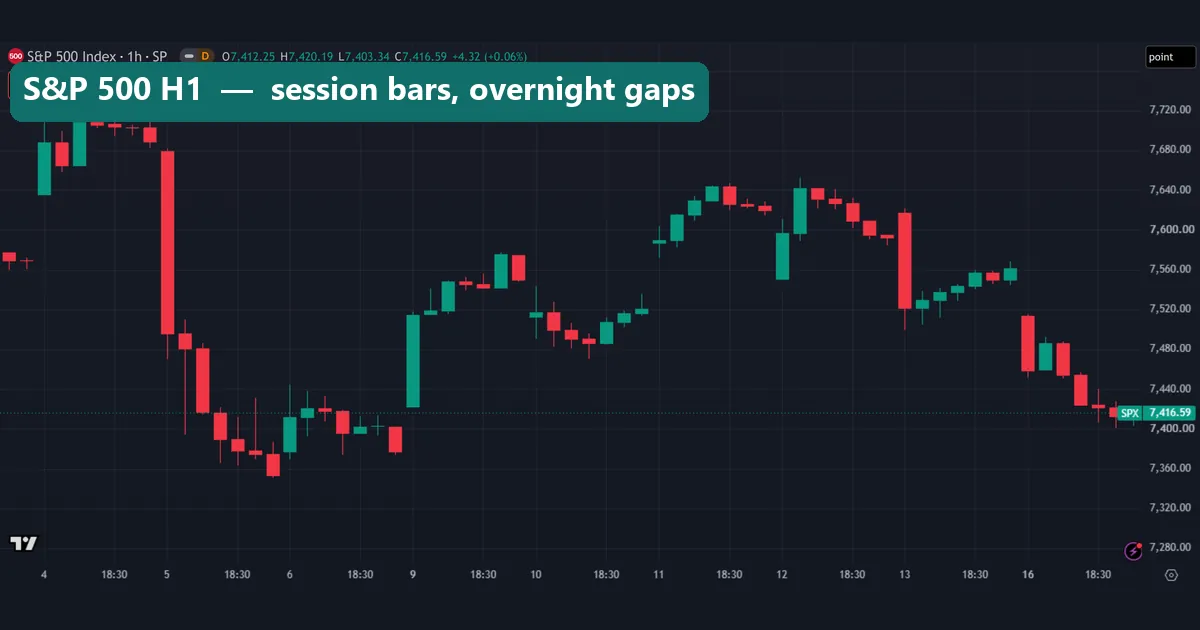
The S&P 500 index only prints during the cash session. On the hourly SPX chart above, each day holds seven bars that start at half past the hour. The last one lasts only 30 minutes. Between sessions there is nothing, so every morning begins with a jump. On 16 November 2026 the index opened just under the 7,520 line. It had finished 13 November near 7,560 and never got back there that day, so that gap stayed open.
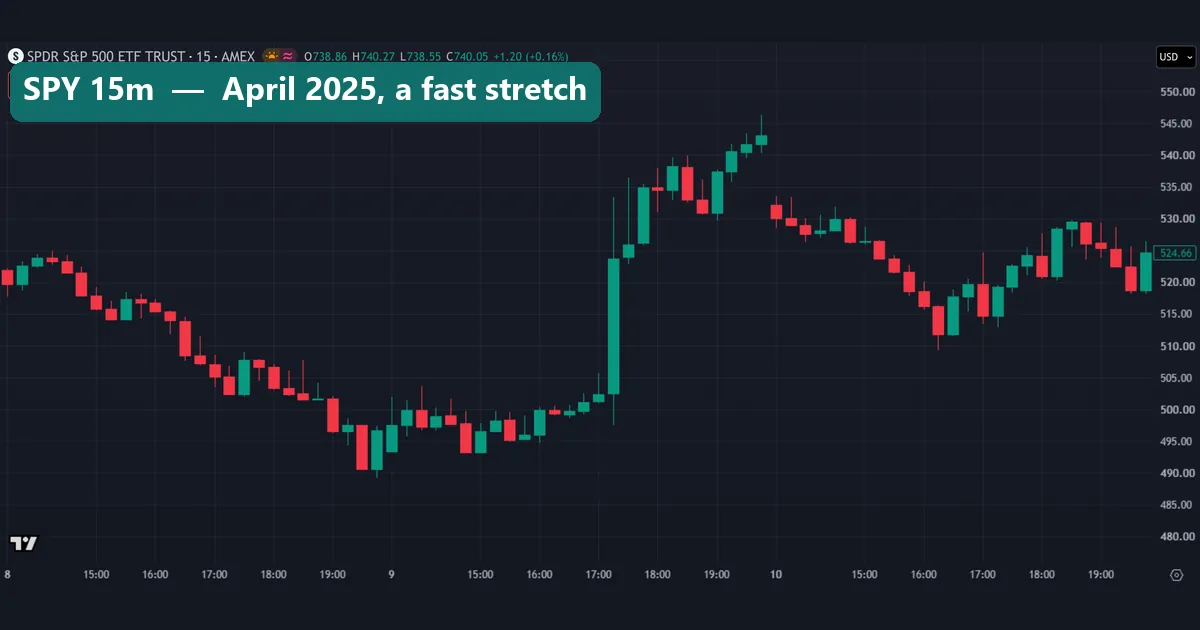
Not every big move comes at the bell. The last image shows SPY from 8 to 10 April 2025, a volatile stretch. On 9 April the tallest bar of all three days started at 1:15 p.m. New York time. That afternoon the US announced a pause on most of its new tariffs. On days like that, news beats the clock. Sitting through such a swing takes nerve, and our piece on paper hands covers that side of it.
Four common mistakes
1. Using the wrong offset. The open sits at 9:30 a.m. in New York all year, but its UTC time moves. Alerts set in UTC drift by an hour for half the year. The mismatch weeks in March and late October catch careful traders too.
2. Reading pre-market quotes as the open. The official open comes from the 9:30 auction. Pre-market books are thin, and a stock can trade far from its opening price in early dealing.
3. Treating the first bar as the day’s verdict. The first 30 minutes held the high on 26.1% of days and the low on 31.5%. On most days, at least one extreme came later, so chasing the first bar ignores the odds.
4. Forgetting half days. On a 1:00 p.m. close, an order planned for 3:50 p.m. never gets its chance. NYSE lists the 2026 early closes as Friday 27 November and Thursday 24 December. Our forex bank holidays page helps too, because currency liquidity thins on many of the same days.
Where to go next
Two more pages pick up from here. Our walk-through of Nasdaq 100 futures on TradingView shows an overnight contract beside its cash index. Our page on types of gaps sorts common, breakaway and exhaustion gaps. For primary sources, use the four pages linked above: NYSE, Nasdaq, State Street and TradingView.
FAQ: the stock market open time
What time does the stock market open?
US stocks open at 9:30 a.m. Eastern Time, Monday to Friday, and close at 4:00 p.m. In UTC that is 14:30 to 21:00 in the US winter. In summer it is 13:30 to 20:00.
What time does the US stock market open in UK time?
For most of the year, 14:30 London time. For a few weeks in March and late October, the clock changes fall on different dates. Then the bell rings at 13:30 in London.
Can I trade stocks before 9:30 a.m.?
Yes, if your broker offers it. Nasdaq lists pre-market trading from 4:00 a.m. ET. Volume there is thin, and the official open still comes from the 9:30 auction.
Does the stock market trade on weekends?
No. Some brokers quote weekend prices on index products, as our Weekend Wall Street guide explains. The exchanges themselves stay shut until Monday’s 9:30 auction.
What time does the market close on a half day?
At 1:00 p.m. ET. The NYSE page lists Friday 27 November 2026, Thursday 24 December 2026 and Friday 26 November 2027 as early closes. In our data the last 15-minute bar on such days starts at 12:45 p.m.
Why does the first half hour move so much?
Overnight news gets priced in at once. In our 460 sessions the first 30 minutes covered a median 41.8% of the day’s range.
Do S&P 500 futures open at 9:30 a.m.?
No. E-mini futures trade about 23 hours a day on CME. Even so, 69.1% of their volume in our window traded during NYSE regular hours.
Should I trade the open or the close?
Neither window suits everyone. The open moves more price, while the close trades more shares, 19.4% of volume against 12.2%. Pick the window that fits your method and size your risk for its speed. Test any plan first: results are not guaranteed; past performance is not indicative of future results.
Last updated: 17 November 2026.

About the author
Written by Dominic Walsh, a Forex trader and MT4/MT5 indicator, Expert Advisor and script developer. Every tool on forexmt4systems.com is tested on live charts before release and ships with ready-to-use compiled MT4 (.ex4) and MT5 (.ex5) files. Learn more about the trader and developer behind this site.
How we build, test and correct every tool: Editorial & Testing Policy. Trading carries risk; see the disclaimer.