
The VWMA indicator is a moving average that lets busy bars count for more than quiet ones. This guide settles three things: how the line is built, what “volume” means for it in forex, and whether it tells you anything a plain 20-bar simple moving average does not. We measured that last point on 23 currency pairs of daily data and four symbols on H1. On daily charts, the honest answer is: almost nothing.
What the VWMA indicator is
VWMA stands for volume-weighted moving average. Like a simple moving average (SMA), it looks back over a fixed number of bars. Unlike the SMA, it does not treat those bars as equals. A bar with heavy volume pulls the average toward its close, and a thin bar barely moves it. So when volume is spread evenly, the two lines match. When volume bunches up on a few bars, the VWMA leans toward them.
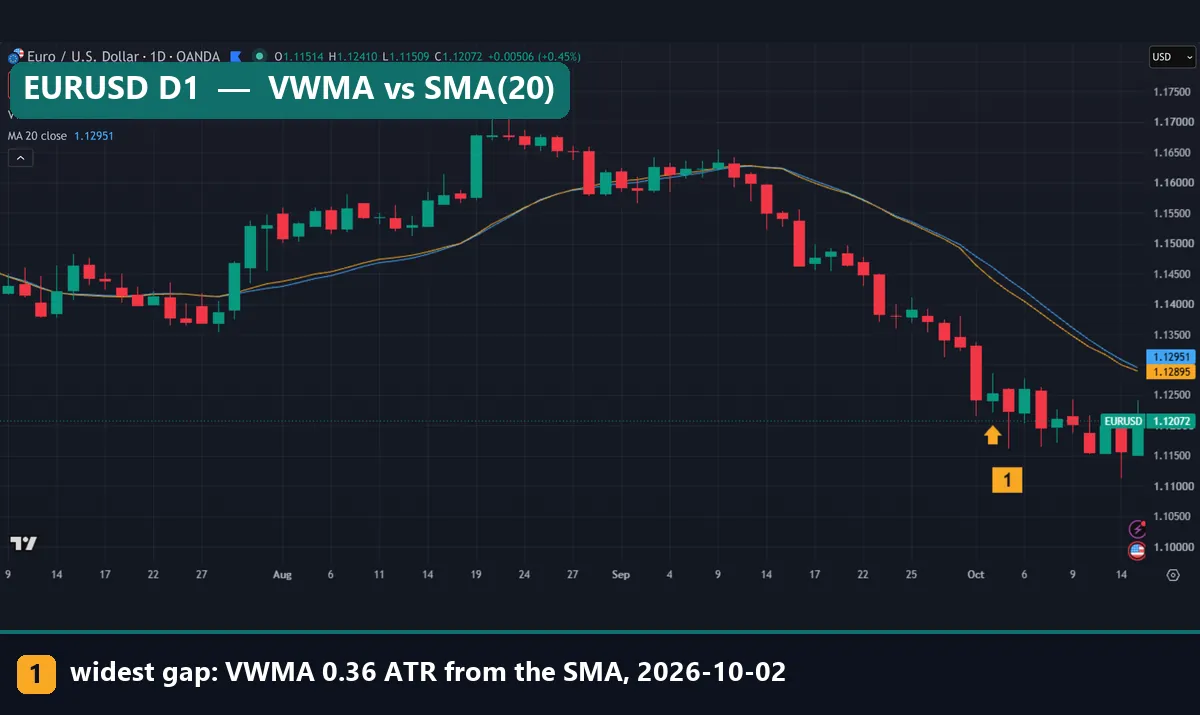
Our first image shows the usual daily result. On EURUSD D1, the yellow VWMA(20) and the blue SMA(20) run almost on top of each other for three months. Marker 1 points at the widest recent gap, on 2 October 2026. Even there, the VWMA sat at 1.14404 against an SMA of 1.14606, a gap of 0.36 ATR.
If moving averages are new to you, start with how moving averages work and our SMA vs EMA comparison. The VWMA is simply a third way to weight the same window.
How the VWMA works: the formula
The formula divides one sum by another over the last N bars:
VWMA = sum(close x volume) / sum(volume)
Pine Script writes it as ta.sma(close * volume, 20) / ta.sma(volume, 20). The shared divisor cancels, leaving the ratio of the sums. TradingView describes the built-in study on its VWMA help page at TradingView.
In an SMA(20), every bar counts for one twentieth. In a VWMA(20), each bar counts for its own volume divided by the window’s total. Two effects follow. First, the line moves hardest when a big-volume bar arrives. Second, it moves again 20 bars later, when that bar drops out of the window.
In forex, “volume” needs a footnote. Spot currencies trade over the counter, across many banks and venues, so no single feed records every deal. The BIS Triennial Survey page on OTC foreign exchange turnover in April 2022 shows how spread out that market is. So MetaTrader and TradingView’s OANDA charts show tick volume: the number of price changes in a bar on one feed. MetaTrader keeps it apart from real volume, as the MqlRates structure in the MQL5 documentation shows. So a forex VWMA weights bars by activity, not by money traded.
VWMA vs SMA vs VWAP
Against the SMA, the only change is the weighting. Both use a rolling window, and both drop the oldest bar as each new one arrives.
VWAP is a different animal, although the name looks close. It starts at an anchor, usually the session open, and adds every bar since then until it resets. It also uses the typical price, (high + low + close) / 3, as StockCharts ChartSchool’s VWAP article explains. So VWAP measures the average price paid since the anchor. The VWMA measures the volume-weighted centre of the last 20 bars.
Our guide to anchored VWAP vs VWAP covers the anchored versions. To show volume on the price chart itself, see the volume candlestick chart.
How we tested
For the numbers, we used MetaTrader 4, build 1471, with Capital Point Trading history. The daily test covered 23 FX pairs from 12 June 2018 to 24 August 2026. On H1, EURUSD, GBPUSD and USDJPY started on 22 December 2025, and ran to 26 August 2026 for EURUSD and 13 August for the other two. XAUUSD ran from 1 July 2025 to 20 August 2026.
On every bar, we computed VWMA(20) from MT4 tick volume and SMA(20) from the closes. We measured the gap between them in ATR(14) units; our page on what ATR means in trading covers that unit. We also logged every bar where the close crossed each line, and every VWMA cross of the SMA. For each cross, we checked whether the close 10 bars later was higher or lower, against the base rate for all bars.
For the pictures, we loaded TradingView’s built-in VWMA (yellow) and Moving Average 20 (blue, a simple average) on a TradingView web chart with OANDA data, on 15 October 2026. Nothing here counts spread, swap or commission, and none of it is a trading system. Our method rules sit in the editorial testing policy.
VWMA settings and parameters
The TradingView study has three inputs, plus Style and Visibility tabs.
| Setting | Our value | What changing it does |
|---|---|---|
| Length | 20 | Bars in the window. Longer smooths spikes but reacts later. |
| Source | Close | The price that gets weighted, such as close, hl2 or hlc3. |
| Offset | 0 | Slides the drawn line by whole bars. Values stay the same. |
| Style | Yellow line | Line colour and width. |
| Visibility | Unchanged | Which timeframes show the line. |
MetaTrader 4 has no built-in VWMA. Its Moving Average offers simple, exponential, smoothed and linear weighted methods, and none of them uses volume. Our volume weighted moving average indicator for MT4 and MT5 applies the formula to broker tick volume. It ships as compiled files only, and our guide on how to install MT4 and MT5 indicators covers the folders.
Reading the VWMA indicator on a chart
Read the VWMA against the SMA. When the lines overlap, the bars carried similar volume and the VWMA adds nothing. When they split, heavy bars sit inside the window, and the VWMA leans toward where they closed.
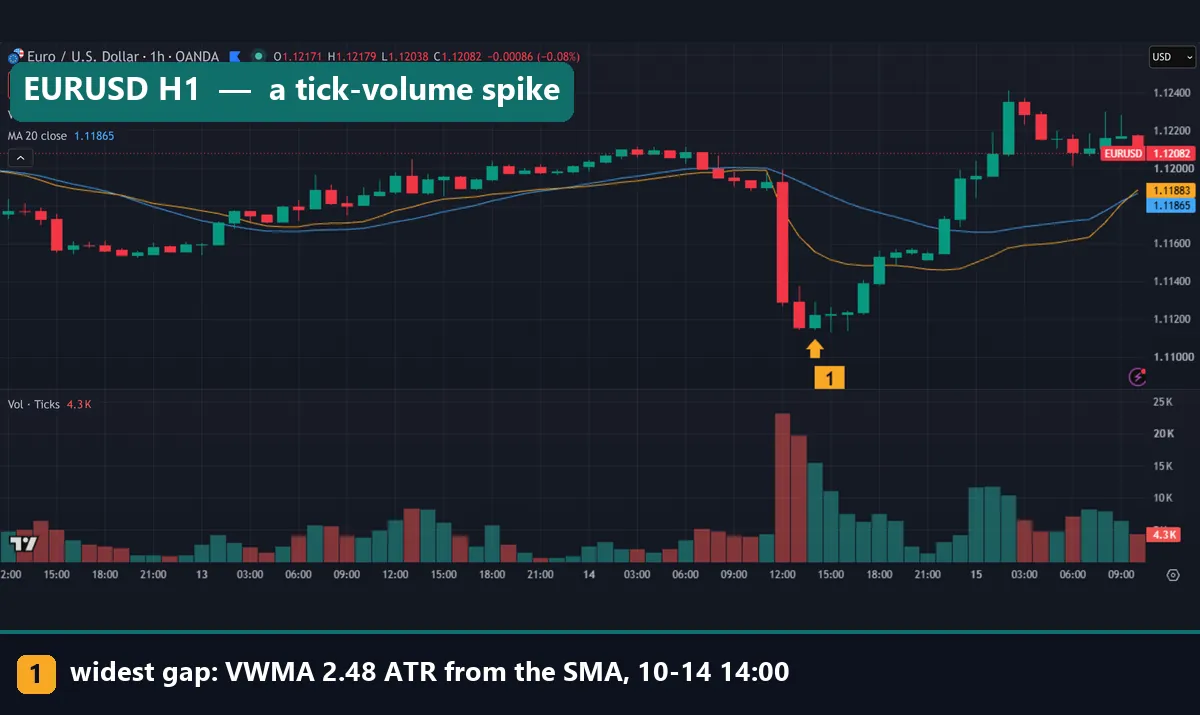
The EURUSD hourly chart shows a clean split. On 14 October 2026, the 12:00 UTC bar fell hard on the tallest tick-volume bar in view, above 20K ticks, while most overnight bars sit under 4K. So the yellow VWMA dived toward the low closes, and the blue SMA only eased lower. Marker 1 sits on the 14:00 bar, where the gap reached 2.48 ATR.
At the right edge, early on 15 October, the VWMA climbs steeply to 1.11880 against 1.11866 for the SMA. Yet price traded sideways above 1.12000 in those hours. The heavy bars leaving the 20-bar window caused most of that jump.
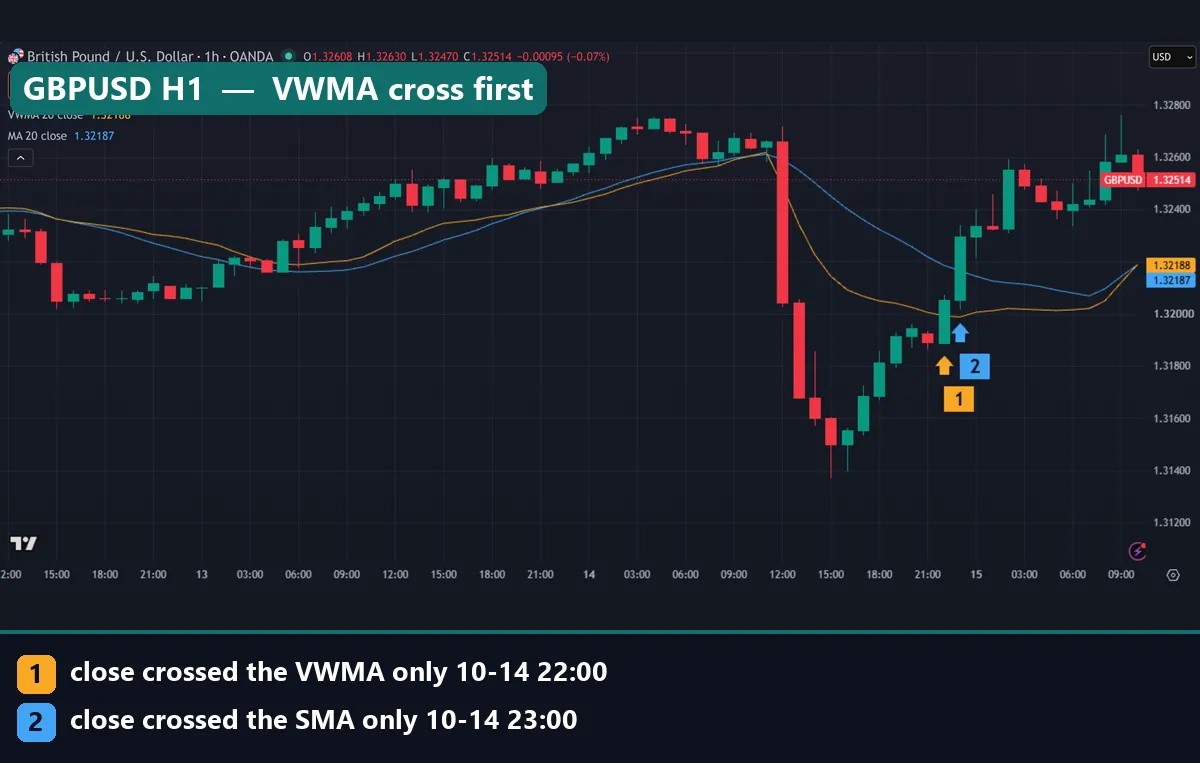
GBPUSD shows what this does to crosses. After the same sell-off, its VWMA sat well below its SMA. So the recovering close crossed the VWMA first, at 22:00 UTC (marker 1, close 1.32053), and the SMA one bar later (marker 2, close 1.32296). That hour of lead was mechanical: the heavy, low closes had dragged the VWMA down, so price had less distance to cover.
Worked example: EURUSD H1 on 14 October 2026
Here are the numbers behind marker 1, from our TradingView data.
- Bar: 14:00 UTC, with a close of 1.11224.
- SMA(20): 1.11891, with each close counted the same.
- VWMA(20): 1.11557, because the 12:00 and 13:00 bars held a large share of the window’s ticks.
- Gap: 0.00334, about 33 pips, or 2.48 times the ATR(14).
So which line was right? Neither, in any useful sense. The VWMA sat nearer price because most of its weight came from bars that had just traded far lower. Meanwhile, the SMA still gave full weight to the quiet hours near 1.12000.
The same afternoon hit other dollar pairs. GBPUSD H1 had its widest recent gap at 15:00 UTC (1.81 ATR), USDCHF at 14:00 (2.01 ATR) and AUDUSD at 16:00 (1.09 ATR). Daily charts rarely look like this: only 4.3% of days in our 23-pair test had a gap above 0.25 ATR.
What our crossing test found
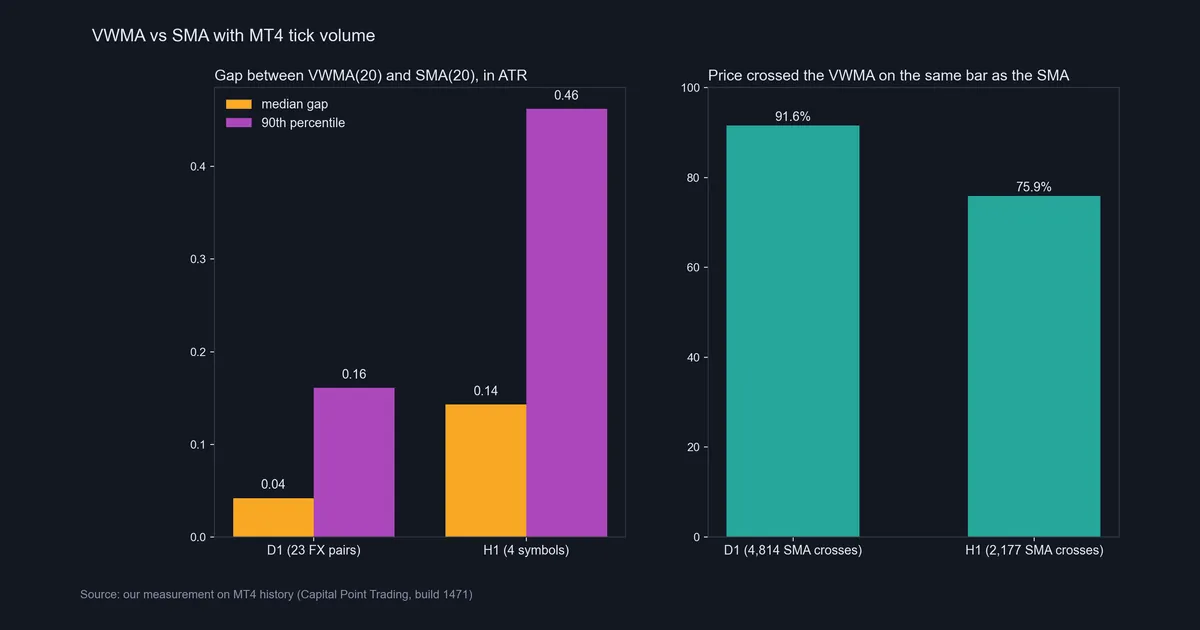
On daily bars, the median gap was 0.04 ATR and the 90th percentile 0.16 ATR. On H1, the gap was bigger: a median of 0.14 ATR and a 90th percentile of 0.46 ATR. The right panel shows the effect. Of 4,814 daily closes that crossed the SMA(20), 91.6% also crossed the VWMA(20) on the same bar. On H1, the figure was 75.9% of 2,177 crosses.
| Bars | Rule | Up crosses | Higher 10 bars later | Down crosses | Lower 10 bars later |
|---|---|---|---|---|---|
| D1 | Close crosses VWMA(20) | 2,422 | 52.2% | 2,428 | 47.3% |
| D1 | Close crosses SMA(20) | 2,378 | 52.4% | 2,385 | 46.9% |
| D1 | VWMA crosses SMA | 1,446 | 53.1% | 1,445 | 46.8% |
| D1 | All days | n/a | 52.3% | n/a | n/a |
| H1 | Close crosses VWMA(20) | 1,109 | 53.2% | 1,108 | 47.5% |
| H1 | Close crosses SMA(20) | 1,087 | 53.3% | 1,086 | 46.0% |
| H1 | VWMA crosses SMA | 665 | 51.4% | 665 | 49.2% |
| H1 | All bars | n/a | 51.8% | n/a | n/a |
Read the table against the base rate. On daily bars, 52.3% of all days closed higher 10 days later, and up-crosses of either line did the same. Down-crosses saw a lower close less than half the time, which fits a sample that drifted up. In short, the crossing results matched the SMA’s, and neither beat a random day by a margin we would trust.
A one-day lead on USDJPY daily
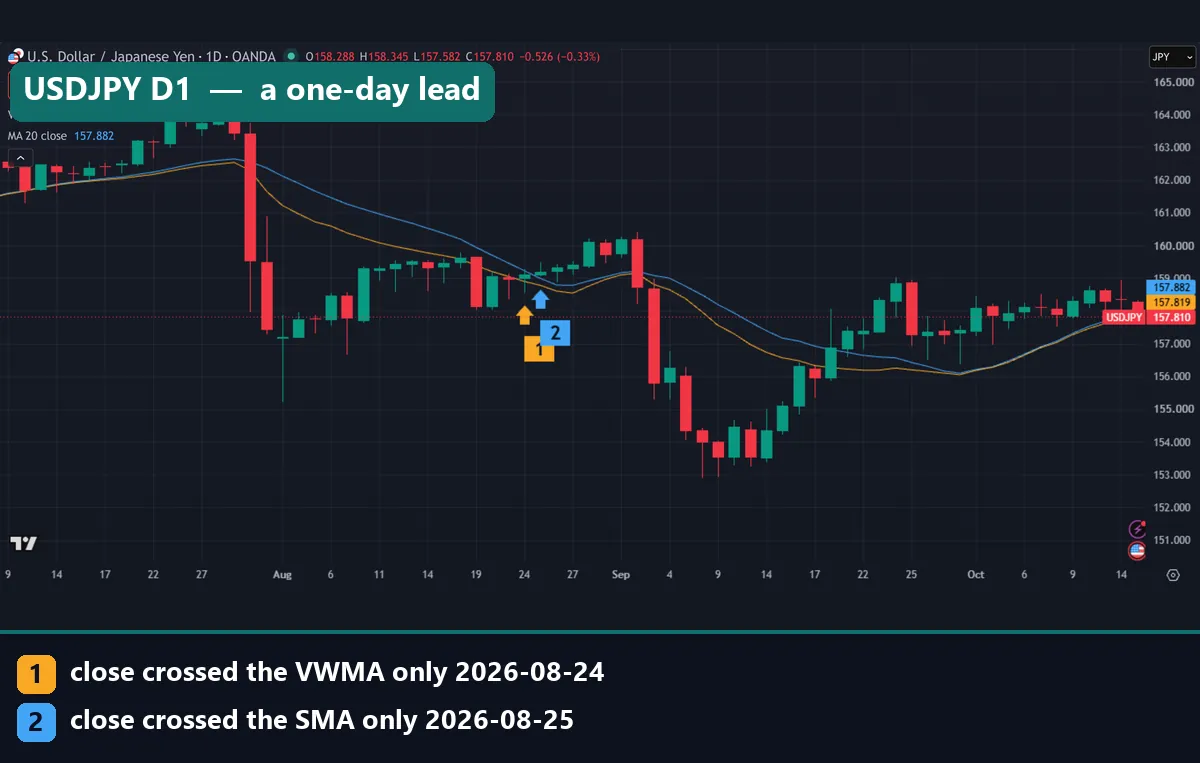
USDJPY shows why a lead of one bar is not an edge. The close crossed the VWMA alone on 24 August 2026 at 159.104 (marker 1), and the SMA alone a day later at 159.204 (marker 2). A week earlier, the close had already crossed the VWMA alone twice: up on 18 August, down on 19 August. Then, in early September, price fell through both lines, and the daily lows reached the 153.000 area by 9 September. The day of lead changed nothing about that move.
Download the complete indicator database
Put these concepts on your charts. One email unlocks the full library of 1,380+ indicators with compiled MT4 and MT5 files, plus my TradingView scripts. No paywall, no spam, unsubscribe any time.
Download this indicator free
Enter your email and the file is yours. You also get the full MT4 and MT5 library.
Where it fails
The first failure is the data. Tick volume counts price changes on one feed, so another broker, or OANDA against MT4, gives a slightly different line. Nobody sees the whole market’s traded volume in spot FX.
The second is redundancy. On daily charts, the VWMA sat a median 0.04 ATR from the SMA(20), and price crossed both on the same bar 91.6% of the time. Two lines that agree that often are one line drawn twice.
The third is the spike problem. One heavy bar can pull the H1 line far from the SMA. Then, 20 bars later, the line jumps back as that bar leaves the window, even if price stands still. That jump can print a cross that has nothing to do with current trading.
The fourth is lag. The VWMA is still a 20-bar average, and it does not lead price; see leading vs lagging indicators. Last, crossing rules on the VWMA did no better than the same rules on the SMA, before costs. Add spread and swap, as our page on backtesting transaction costs shows, and a near-chance rule only gets worse.
Can the settings fix it? Gold H1 says no
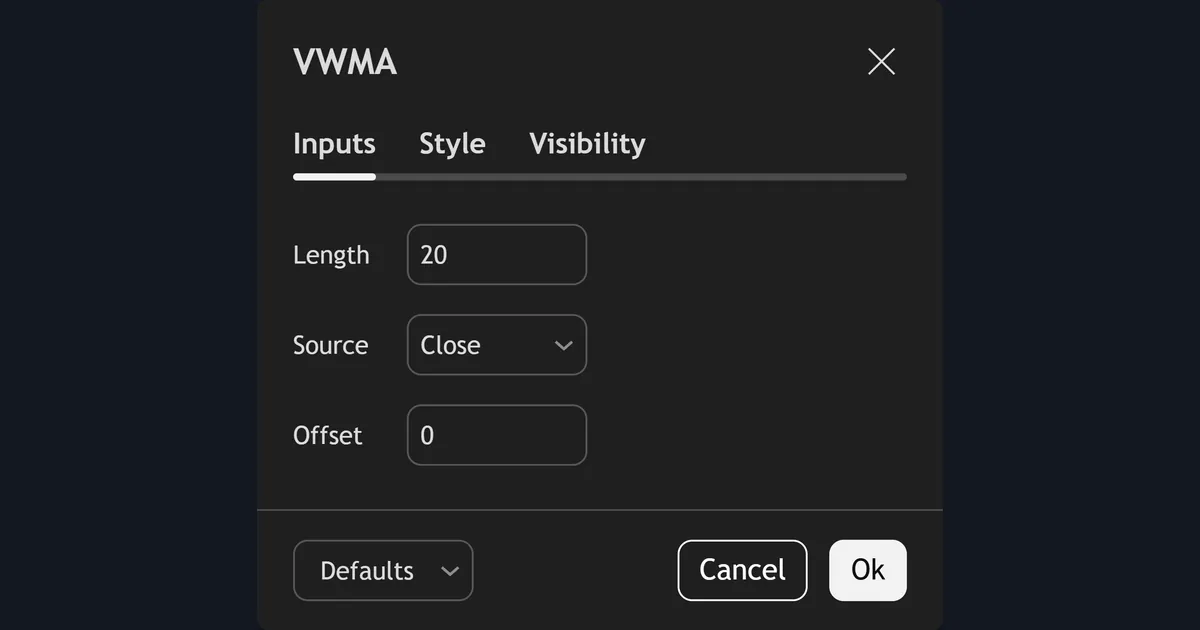
The Inputs tab in our capture shows Length 20, Source Close and Offset 0. A longer length spreads the weight, so one spike moves the line less. But the line then lags more and drifts closer to an SMA of the same length. A shorter one adds noise. Switching the source to hlc3 weights the typical price, a step nearer VWAP. Keep Offset at 0 while testing, or the line no longer sits on the bar it came from. None of these settings changes what the volume is.
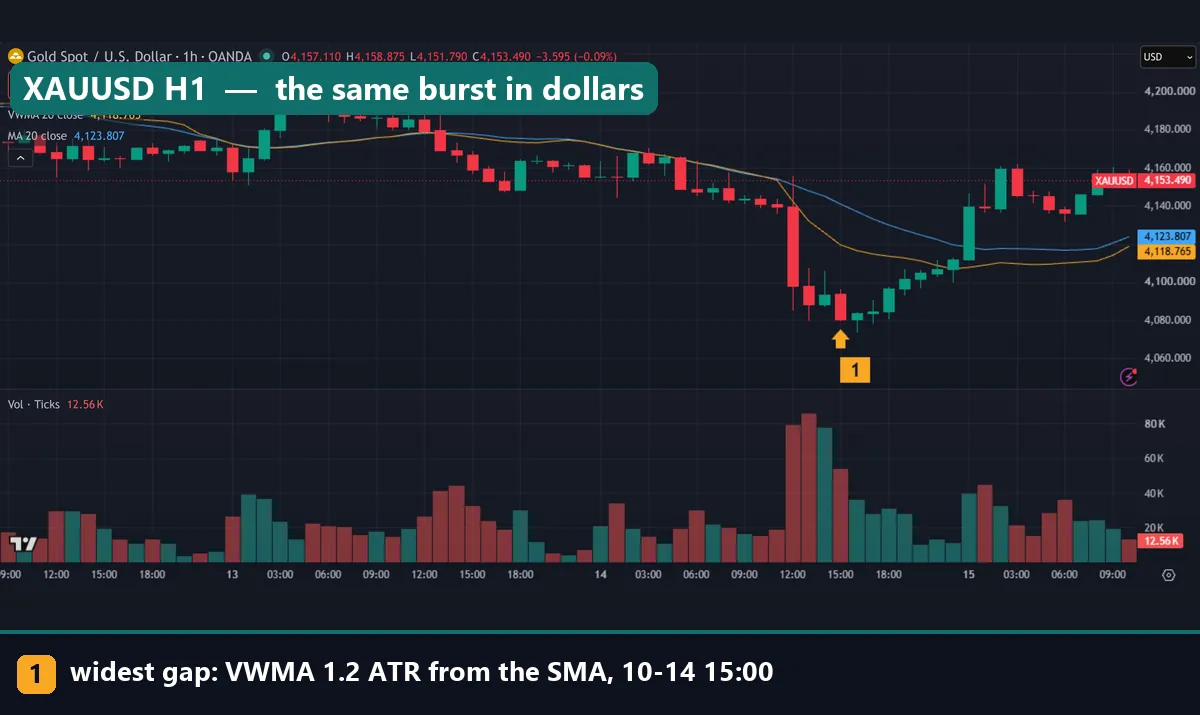
Gold makes that plain because its units are large. On XAUUSD H1, tick volume ran near 80K on the 12:00 to 14:00 UTC bars of 14 October, while many quiet hours stayed under 20K. At 15:00 (marker 1), the close was $4,080.48, the SMA(20) $4,141.08 and the VWMA(20) $4,119.65: a gap of about $21.43, or 1.2 ATR. Early on 15 October, the yellow line turns up and ends at $4,118.40 against $4,123.76. Most of that turn comes from the heavy bars leaving the window, not from fresh buying.
Common mistakes with the VWMA
- Calling tick volume real volume. The weights count price changes on one feed, not the size of trades.
- Treating VWMA and SMA agreement as confirmation. On daily charts the two lines are near copies, so their agreement is one opinion, not two.
- Reading the drop-out jump as a signal. Before you trust a turn or a cross, check whether a heavy bar just left the window.
- Mixing up VWMA and VWAP. One rolls over a fixed number of bars; the other adds up from an anchor and resets.
Where to go next
For intraday levels, a session VWAP may suit you better: our VWAP indicator for MT4 and MT5 draws one from tick volume. To test crossing rules on your own pairs, try the moving average cross indicator.
Also read daily trading volume in forex. Tick counts swell and fade through the day, so forex trading sessions helps too.
FAQ about the VWMA indicator
What does VWMA stand for?
Volume-weighted moving average. It averages the last N closes and gives each bar a weight equal to its share of the window’s volume.
How do you calculate the VWMA?
Multiply each close by its volume and add up the products over the window. Then divide by the total volume of the same bars: sum(close x volume, 20) / sum(volume, 20).
What is the difference between VWMA and SMA?
Only the weights. The SMA weights every bar the same, while the VWMA gives busy bars more. On our daily forex data, the two sat a median 0.04 ATR apart.
Is VWMA the same as VWAP?
No. The VWMA uses a rolling window. VWAP adds up from an anchor, usually the session open, uses the typical price, and then resets.
What is the best VWMA length?
There is no best length. We tested 20. A longer length smooths spikes but lags more, so pick one and keep it fixed while you test.
Does the VWMA work in forex without real volume?
It runs on tick volume, the count of price changes on your feed. That tracks activity, but on daily charts the line barely differs from an SMA.
Can I use a VWMA in MetaTrader 4?
Not as a built-in. MT4’s Moving Average has no volume option, so you need a custom indicator, such as our compiled MT4 and MT5 version.
Is a VWMA crossover a buy or sell signal?
Not on its own. In our test, VWMA crosses did about as well as SMA crosses, and neither clearly beat the base rate. Treat it as context and test any rule on your own data: results are not guaranteed; past performance is not indicative of future results.
Last updated: 15 October 2026.

About the author
Written by Dominic Walsh, a Forex trader and MT4/MT5 indicator, Expert Advisor and script developer. Every tool on forexmt4systems.com is tested on live charts before release and ships with ready-to-use compiled MT4 (.ex4) and MT5 (.ex5) files. Learn more about the trader and developer behind this site.
How we build, test and correct every tool: Editorial & Testing Policy. Trading carries risk; see the disclaimer.