
An ADX crossover is the moment the +DI line crosses the -DI line on the Directional Movement study, usually read with the ADX line as a strength filter. This guide settles one question with data: does that cross, filtered or not, carry a usable edge on daily forex charts? We measured it on 23 pairs over eight years. The short answer is no, and the details below show why.
What an ADX crossover actually is
The name is loose. Most traders who say “ADX crossover” mean the cross of the two directional lines, +DI and -DI. When +DI moves above -DI, upward pressure has taken the lead. When -DI moves above +DI, downward pressure leads. The ADX line itself does not cross anything in this reading. Instead, it acts as a gate: many traders only accept a cross when ADX sits above 25.
Some people also use the name for ADX rising through a level such as 25. That is a strength alert, not a direction signal, because ADX also rises in downtrends. So in this guide, the cross is always +DI against -DI, and ADX is the filter. Our ADX indicator explainer covers the line on its own.
J. Welles Wilder introduced all three lines in 1978. The average directional movement index on Wikipedia gives the history and the original notation. TradingView ships the set as one built-in study called “Directional Movement”, shortened to DMI on the chart.
How the ADX crossover is calculated
Everything starts with two numbers per bar. First, up-move is today’s high minus yesterday’s high. Next, down-move is yesterday’s low minus today’s low. If up-move is larger and above zero, it counts as +DM. If down-move is larger and above zero, it counts as -DM. Otherwise, both are zero for that bar.
Then each series is smoothed with Wilder’s moving average (RMA) over the DI length. True range gets the same smoothing. The two lines follow:
+DI = 100 * RMA(+DM, n) / RMA(TR, n)
-DI = 100 * RMA(-DM, n) / RMA(TR, n)
DX  = 100 * |(+DI) - (-DI)| / ((+DI) + (-DI))
ADX = RMA(DX, m)
Here n is the DI length and m is the ADX smoothing, both 14 by default. The cross itself is simple. A bullish cross happens on the bar where +DI closes above -DI after closing below it on the previous bar. A bearish cross is the mirror.
Note the double smoothing. As a result, ADX reacts late, often several bars after the cross. StockCharts ChartSchool’s ADX article walks through the same steps with a worked spreadsheet.
How we tested
We ran two versions of one rule on daily candles from a MetaTrader 4 terminal, build 1471 (Capital Point Trading history). The sample covers 23 FX pairs from 12 June 2018 to 24 August 2026, a total of 37,748 daily candles. We used no gold and no indices in the measurement.
- Unfiltered: DMI(14) with Wilder smoothing and ADX(14). Go long when +DI crosses above -DI, and go short on the opposite cross. Each trade opens at the next daily open.
- Filtered: the same, but a new trade only opens when ADX is above 25. An opposite cross still closes the open trade.
Returns are percent of price, summed per pair. They are also before spread, swap and commission, because this terminal’s history does not store usable spreads. So every figure below flatters the rule.
The chart examples come from the TradingView web chart with OANDA data, captured on 5 October 2026. They show EURUSD, GBPUSD and XAUUSD on the daily chart and USDJPY on the hourly chart. The ADX values printed at our markers come from our own calculation of the same formula. Our general method is in the editorial testing policy.
Settings and parameters
TradingView’s DMI dialog has only two inputs. MetaTrader 4’s built-in ADX has one period that drives both parts. So the table maps the names across platforms.
| Parameter | Default | What it changes | What we used |
|---|---|---|---|
| DI Length | 14 | Smoothing of +DM, -DM and true range. Shorter means more crosses. | 14 |
| ADX smoothing | 14 | Smoothing of DX into ADX. Longer means a slower filter. | 14 |
| ADX threshold | None (user choice) | The level a filtered rule requires before a new trade. | 25 |
| Timeframe | Chart timeframe | Sets how many bars, and how much noise, each cross spans. | Daily (test), H1 (one example) |
| Entry timing | Not set by the study | Cross bar close or next bar open. | Next daily open |
For day-trading lengths, see our separate note on ADX indicator settings for day trading. We did not test other lengths here, so this guide makes no claim about them.
Reading the crossover on a chart
On TradingView’s DMI pane, the colours are fixed by default. ADX is the pink line, +DI is blue, and -DI is orange. The header “DMI 14 14” lists the two lengths, then the three current values in the same order.
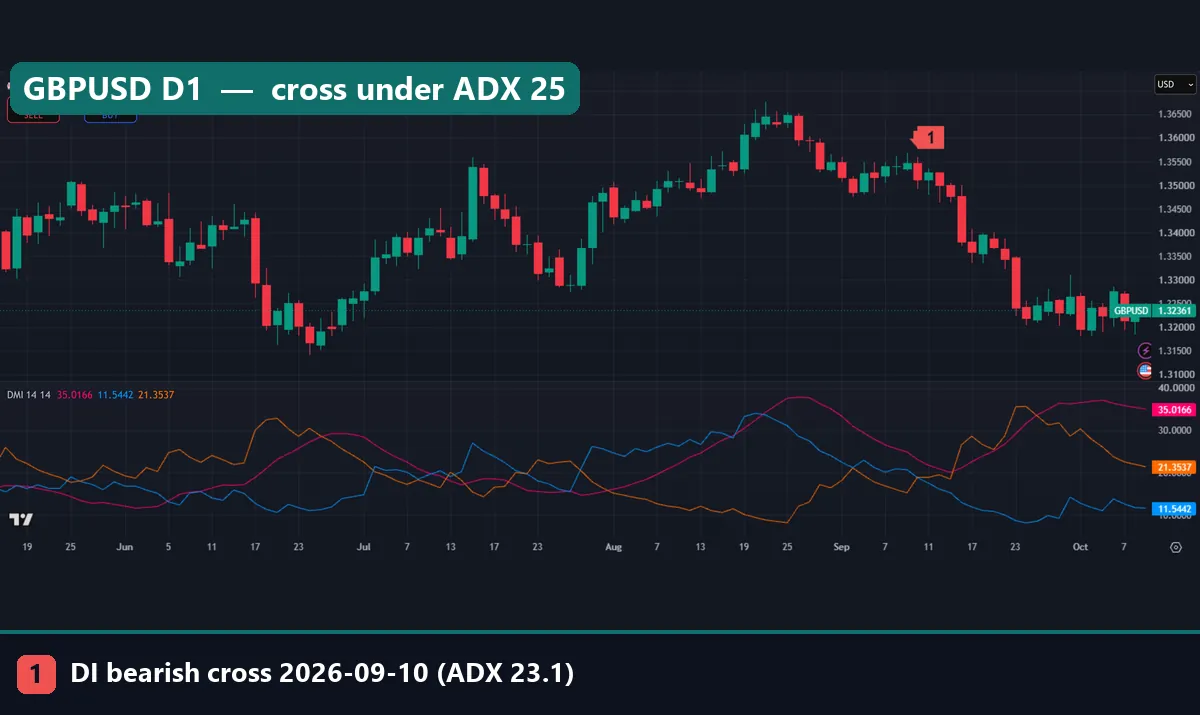
In the GBPUSD daily chart below, the marker sits on the 10 September 2026 bar. That day, orange -DI moved above blue +DI, a bearish cross. Our calculation put ADX at 23.1 on that bar. So the filtered rule would have skipped it, even though price then fell. The pair closed at 1.35116 on the cross bar and showed 1.32252 at capture, about 286 pips lower.
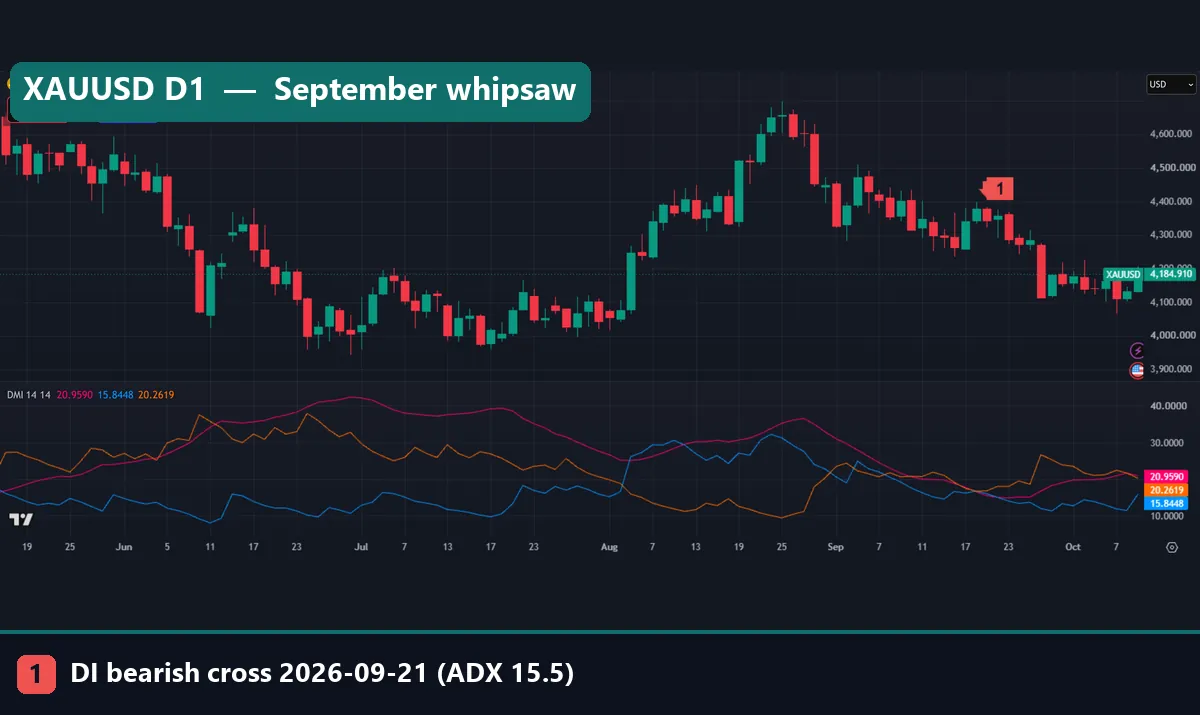
Gold tells the opposite story. The marker on the XAUUSD daily chart is the 21 September bearish cross, with ADX at only 15.5. However, look to the left of it. The DI lines also crossed on 1, 3, 8 and 18 September. That is five crosses in three weeks, and the blue and orange lines tangle across the whole stretch.
In short, a cross only tells you which line leads today, not whether the lead will last.
Worked example: EURUSD daily, July to October 2026
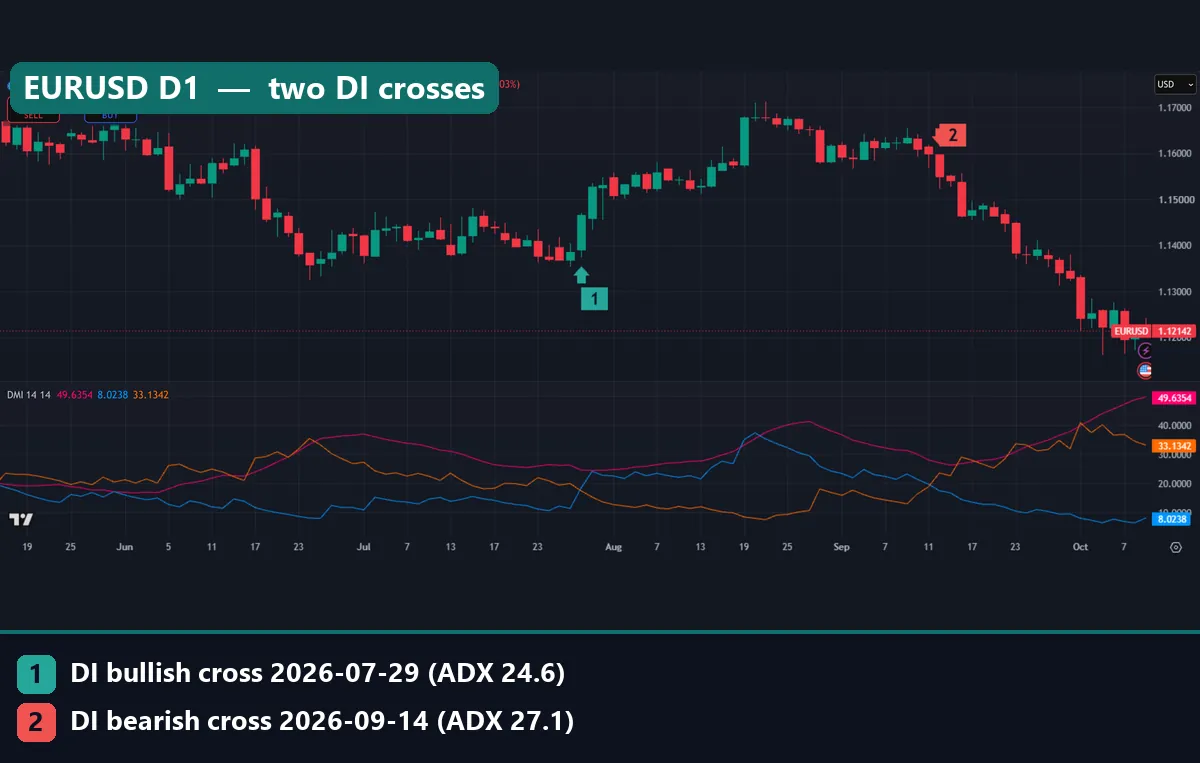
The first chart at the top of this guide holds two marked crosses. Here is the arithmetic at cross-bar closes. Our test entered at the next open, so real fills would differ slightly.
- 29 July 2026, bullish cross. EURUSD closed at 1.14668. ADX was 24.6, just under 25. So the unfiltered rule goes long, but the filtered rule stays flat.
- 14 September 2026, bearish cross. EURUSD closed at 1.15504, and ADX was 27.1. Both versions now go short. The long from step 1 closes here.
- The long result. 1.15504 minus 1.14668 is 0.00836, roughly 84 pips, or about 0.73% of price before costs.
- The open short. At capture, EURUSD showed 1.12034. That is 0.03470 below the entry, about 347 pips, or roughly 3.0% of price. The trade was still open.
Note one detail. Between the two crosses, price ran up to around 1.17 in late August, then gave much of it back. The cross caught only part of the move, because the DI lines need time to turn. Also, by capture day the chart header shows ADX near 44, -DI near 40 and +DI near 6. By then, most of the drop had already happened. This is a clean example on purpose; the full sample shows how rare they are.
What eight years of daily FX showed
Our measurement covered 3,465 unfiltered trades. Only 28.9% made money, just 7 of 23 pairs finished positive, and the median pair lost 6.9% of price.
The spread between pairs was wide. AUDNZD did best at plus 25.3% over 162 trades. At the other end, AUDUSD lost 44.5% over 163 trades, and GBPCAD lost 43.9%. Summed over all pairs, the rule lost 236.6% of price. That works out to roughly minus 0.07% of price per trade, before any cost.
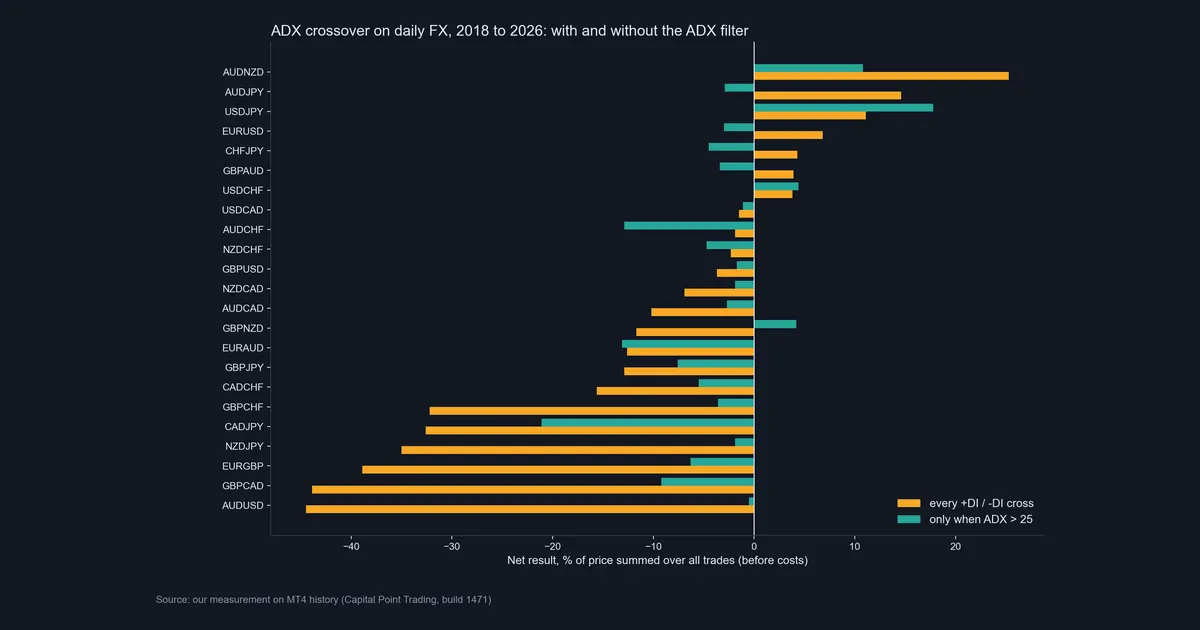
Next, the ADX filter. Requiring ADX above 25 cut the trade count from 3,465 to 503, about 85% fewer. Yet the share of trades that made money fell slightly, to 27.2%. Only 4 of 23 pairs stayed positive. The median pair still lost 3.0%, and the average trade lost about 0.14% of price.
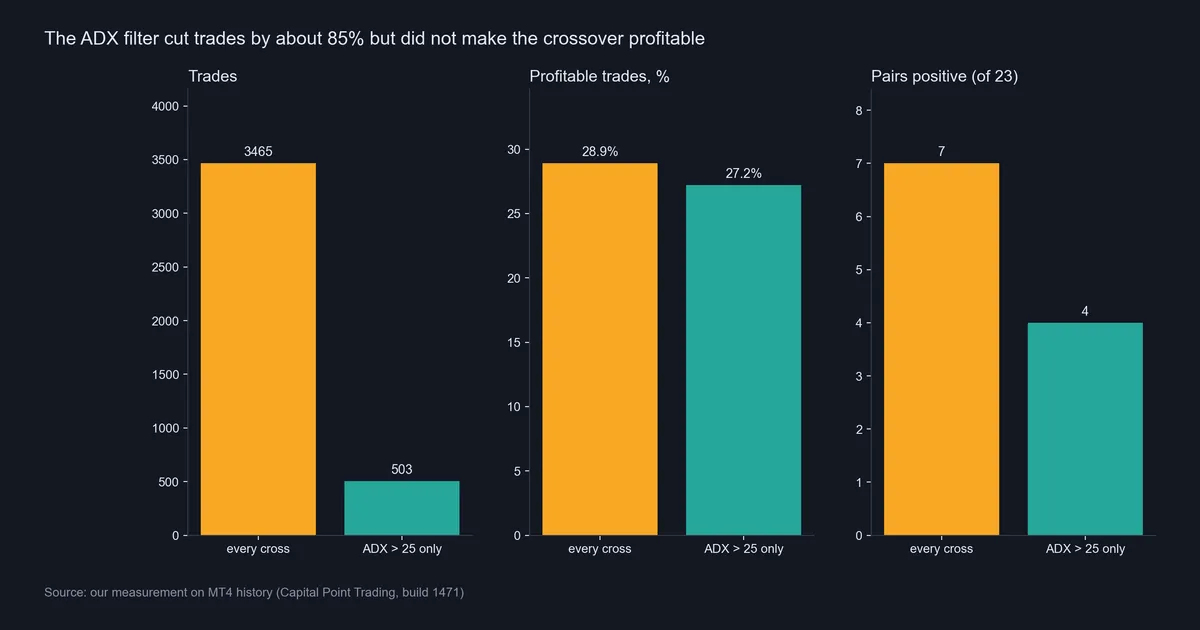
So the filter shrank the losses by trading less, but it did not create an edge. USDJPY leans positive at plus 17.8% filtered, yet 25 trades is a thin, untested sample size. Also, the average trade was already negative, so transaction costs only deepen the loss.
Download the complete indicator database
Put these concepts on your charts. One email unlocks the full library of 1,380+ indicators with compiled MT4 and MT5 files, plus my TradingView scripts. No paywall, no spam, unsubscribe any time.
Get free access to my indicator database
One email unlocks 1,380+ free MT4, MT5 and TradingView indicators — the complete library. No single-tool download; you get the whole database.
Where it fails
The ADX crossover fails most in sideways markets. When price drifts in a range, the two DI lines hover close together. Then small bars push them back and forth, and each push is a new cross.
The GBPUSD chart shows this plainly. In July 2026 the DI lines crossed on the 13th, 14th, 23rd and 29th, with ADX between 14.6 and 18.0. Using cross-bar closes, the first short lost about 45 pips. Then the long lost about 77 pips and the next short about 53. Only the fourth cross, a long from 1.3367, caught a run to 1.35116 by 10 September.
The ADX filter does not save you either. On gold, the 1 September bearish cross had ADX at 31.0 and the 3 September bullish cross had ADX at 27.9. Both passed the filter. Yet the short lost about $145 and the long then lost about $117 at cross-bar closes. A high ADX only says a move was strong lately. It does not say the move will continue.
Lag is the other weakness. ADX often clears 25 late in a move, so the filtered rule enters near the end or skips the best part, as with EURUSD on 29 July. Our guide on leading vs lagging indicators covers this trade-off.
Finally, the result changed a lot by pair. That is a warning sign, not a feature. Picking the best pairs after the fact is curve fitting.
Lower timeframes and shorter settings
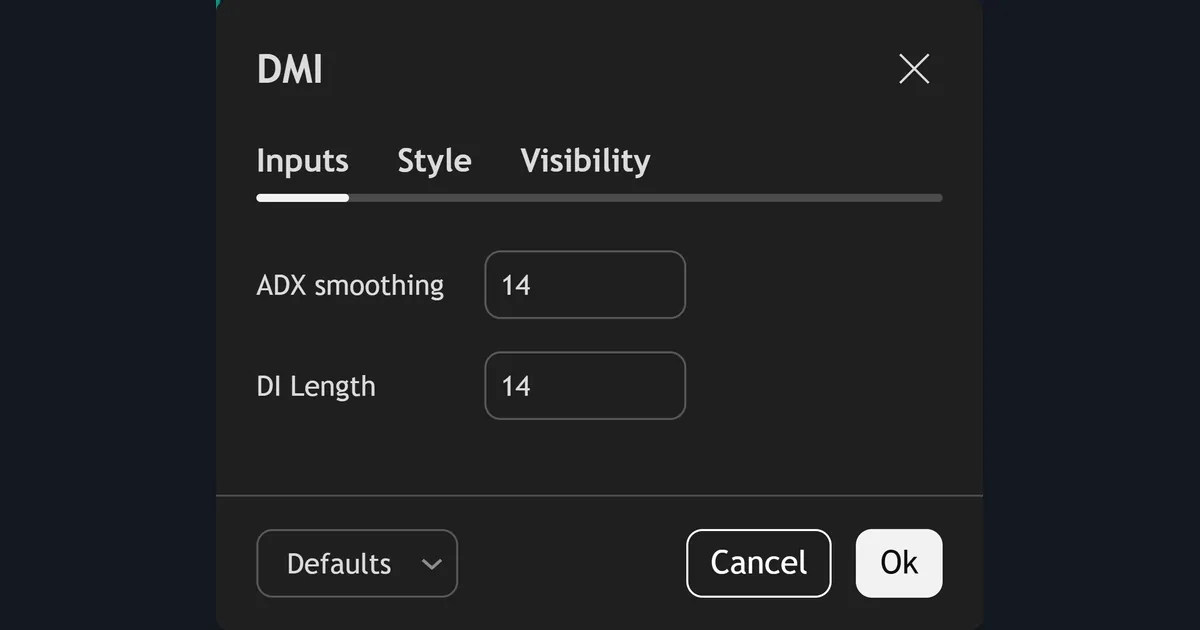
Many traders try to fix the noise by changing the inputs. The DMI dialog on TradingView offers just two fields: ADX smoothing and DI Length, both 14 by default. A smaller DI Length makes the lines faster, which means more crosses. We did not measure other lengths, so treat any setting change as untested.
Dropping to a lower timeframe has a similar effect. The USDJPY hourly chart below covers 30 September to 5 October 2026. On 5 October a bearish cross came at 05:00 UTC, with ADX at 21.3. Then a bullish cross followed at 11:00 UTC, with ADX at 19.4. A short at the first close of 157.846 would have reversed at 158.235, a loss of about 39 pips in six hours.
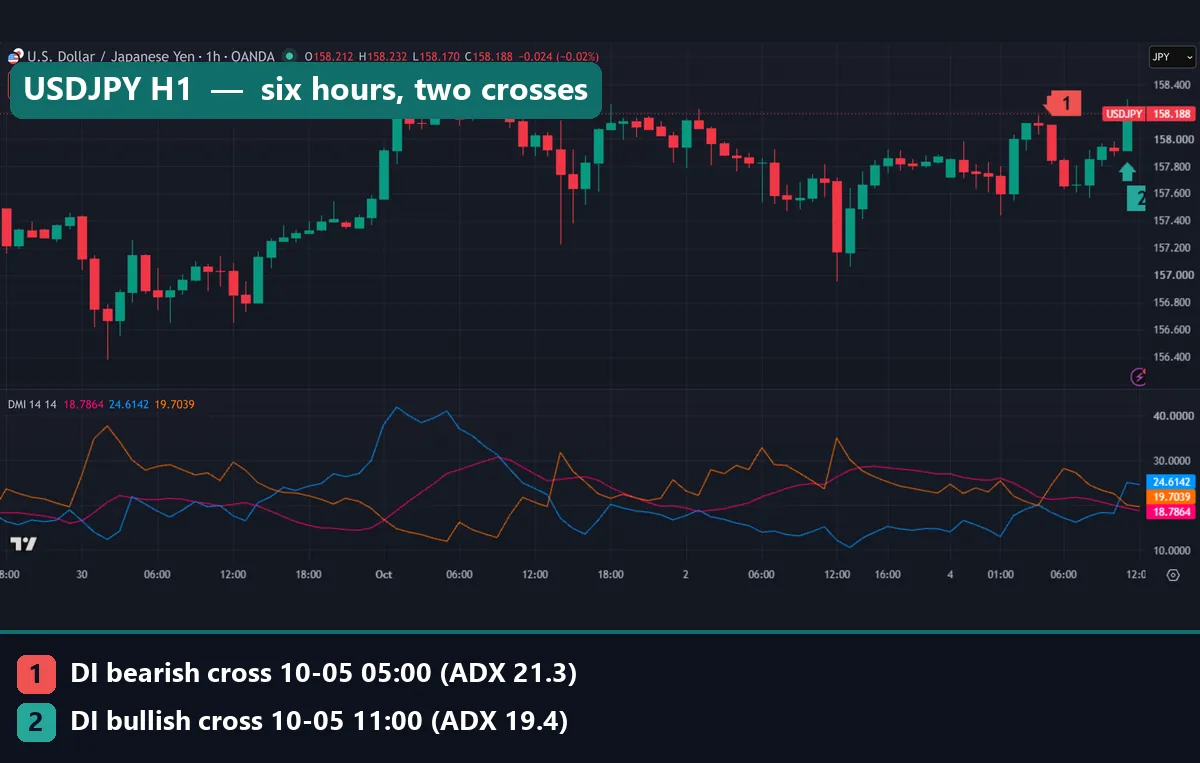
Also, across the whole hourly pane the blue and orange lines swap places many times, and ADX rarely holds above 30. That is normal for an hourly chart. If you work on lower charts, our multi-timeframe analysis guide explains how a daily read can frame the hourly one.
Common mistakes with the ADX crossover
- Reading ADX as direction. ADX rises in strong downtrends as well as uptrends. So a rising ADX after a bearish cross supports the short, not a long.
- Trusting the filter to remove whipsaws. Our data shows the ADX above 25 filter cut trades by about 85% but did not raise the share of trades that made money. The gold crosses on 1 and 3 September both passed it and both lost.
- Acting on an unclosed bar. The DI lines move during the bar. A cross can appear mid-bar and vanish at the close. Therefore, only count crosses on closed bars.
- Skipping the exit plan. A stop-and-reverse rule has no stop until the next cross, which can be far away. Our guide on how to use a stop loss covers fixed and volatility-based stops.
How to use it if you still want to
Our numbers do not support the cross as a stand-alone entry. Still, a wide gap between +DI and -DI with a rising ADX describes a market that is trending now. That is a description, not a forecast.
Another use is as one input among several. See how to combine indicators without stacking tools that measure the same thing. Then compare the idea with a plain moving average crossover strategy, which has the same lag problem in a simpler form.
Whatever you build, test it forward before you trust it. A walk-forward analysis splits the data so the rule is judged on bars it never saw.
Where to go next
- For the trend idea behind the cross, read our trend following trading guide.
- To get the cross as an arrow on MT4 or MT5, see the ADX crossing indicator page. The download contains compiled files only.
- For the plain three-line study, see our ADX indicator for MT4 and MT5.
- TradingView’s own Directional Movement (DMI) help page on TradingView lists the study’s inputs and calculation.
- For a short second definition, see the Directional Movement Index entry at BabyPips.
FAQ: ADX crossover questions
What is an ADX crossover?
It is usually the cross of +DI and -DI on the Directional Movement study, with ADX used as a strength filter. Some traders also use the name for ADX rising through a level such as 25.
Is the ADX crossover a buy or sell signal?
It marks a change in which directional line leads. In our test on 23 daily FX pairs from 2018 to 2026, trading every cross lost money before costs on 16 of 23 pairs.
Does the ADX above 25 filter help?
It cut trades from 3,465 to 503, but the share of trades that made money slipped from 28.9% to 27.2%. Only 4 of 23 pairs finished positive with the filter.
Which line is which on TradingView?
With the default colours, ADX is pink, +DI is blue and -DI is orange. The DMI header lists the two lengths and then the three values in that order.
What are the default DMI settings?
TradingView uses DI Length 14 and ADX smoothing 14. MetaTrader 4’s built-in ADX uses one period, also 14 by default, for both parts.
Why are there so many crosses in a range?
In a range the DI lines sit close together, so small bars flip them. Our GBPUSD daily chart shows four crosses in July 2026 with ADX under 18.
Does the cross repaint?
On a closed bar the cross is fixed. On the live bar the lines move with price, so a cross can appear and then vanish before the close.
Should I trade the ADX crossover on its own?
Our data does not support it as a stand-alone entry on daily FX, filtered or not. Use it as context, test any rule out of sample, and keep risk small; results are not guaranteed; past performance is not indicative of future results.
Last updated: 5 October 2026.

About the author
Written by Dominic Walsh, a Forex trader and MT4/MT5 indicator, Expert Advisor and script developer. Every tool on forexmt4systems.com is tested on live charts before release and ships with ready-to-use compiled MT4 (.ex4) and MT5 (.ex5) files. Learn more about the trader and developer behind this site.
How we build, test and correct every tool: Editorial & Testing Policy. Trading carries risk; see the disclaimer.