
Candlestick day trading means using 15-minute and hourly candle patterns to time trades that open and close inside one day. This guide settles one question with our own data: does a classic pattern on the 15-minute chart tell you where price goes over the next hour? We counted 85,399 fifteen-minute bars on four markets. Most patterns landed within one or two points of a coin flip. So the candle cannot be the plan. Below we show the numbers, how we read patterns on live charts, and a simple framework that puts session, level and higher-timeframe context first.
What candlestick day trading actually means
A candlestick shows four prices for one period: open, high, low and close. Day traders work with short periods, often 15 or 60 minutes, and they are flat before the day ends. Candlestick day trading adds one layer. A named shape, such as an engulfing bar or a hammer, becomes the trigger for an entry.
The shapes are old. Japanese rice traders used them long before computers, and the candlestick pattern entry on Wikipedia lists the classic names and their history. Today every charting platform draws them, and many scanners flag them for you.
The appeal is clear. Patterns are easy to spot, and they appear many times a day. But that frequency is also the problem. In our data a bullish engulfing appeared 115.5 times per 1,000 fifteen-minute bars. That is about eleven per symbol on a full trading day. A signal that common cannot carry much information on its own.
If you are new to the style, our primer on day trading in forex covers hours, costs and routine. Also, the scalping vs day trading comparison shows where the 15-minute chart sits between the two styles.
How a 15-minute pattern is supposed to work
Each candle is a short record of a fight between buyers and sellers. A bullish engulfing says the second side took back everything the first side won. A hammer says sellers pushed price down, then buyers pulled it back near the open. The theory is that the winning side keeps pushing.
The shapes come from simple arithmetic. First, the body is |close - open|. Next, the range is high - low. Then the lower wick is min(open, close) - low and the upper wick is high - max(open, close). For example, our hammer rule reads lower wick >= 2 x body and upper wick <= 0.25 x range, after a five-bar decline.
The test that matters is a second formula: edge = follow-through % - base rate %. The base rate is how often any 15-minute bar closes higher a set number of bars later. In our data, any bar closed higher one hour later 50.4% of the time. So a bullish pattern has to beat 50.4%, not 50%. For bearish patterns the base is 100 minus that figure, which gives 49.6%.
There is a catch on short charts. A 15-minute candle holds only a few minutes of order flow. One large order or one data release can paint a perfect hammer that says nothing about the next hour. For a fuller view of what the shapes measure, see our guide to whether candlestick patterns work.
How we tested 15-minute patterns
We read 15-minute history straight from the site owner’s MetaTrader 4 terminal: Capital Point Trading MT4, build 1471. The symbols were EURUSD, GBPUSD, USDJPY and XAUUSD. The window ran from June 2025 to August 2026, which gave 85,399 bars in total. MT4 server time is UTC+3 in summer and UTC+2 in winter.
First, we coded each pattern as a fixed rule, shown in the table below. Then, for every match, we checked whether price closed further in the pattern’s direction 1, 4 and 8 bars later. That is 15 minutes, one hour and two hours. Finally, we set each result next to the base rate for the same horizon.
This is a direction test only. We used no stops, no targets and no session filter. Spread and commission were not deducted, so real results would sit lower. Our full method is in the editorial testing policy.
The chart images are different. They come from the TradingView web chart with the OANDA feed, between 30 September and 1 October 2026, and every time we quote from them is UTC. We used them to show how patterns look in real sessions, not to measure anything.
Pattern rules and settings we used
Every rule below is the exact one in our measurement. ATR means the 14-bar Average True Range. We scaled the tolerances by ATR so one rule works on both EURUSD and gold.
| Pattern | Rule we coded | Matches | Per 1,000 bars |
|---|---|---|---|
| Bullish engulfing | Bearish bar, then a bullish body that covers it (open within 0.05 ATR of the prior close counts) | 9,863 | 115.5 |
| Bearish engulfing | Bullish bar, then a bearish body that covers it (same 0.05 ATR tolerance) | 9,978 | 116.8 |
| Hammer | After a 5-bar decline: lower wick at least 2x body, upper wick at most 25% of range | 3,515 | 41.2 |
| Hanging man | The hammer shape after a 5-bar advance | 3,495 | 40.9 |
| Shooting star | After a 5-bar advance: upper wick at least 2x body, lower wick at most 25% of range | 3,313 | 38.8 |
| Morning star | Large bearish bar, small body, then a bullish close above the first bar’s midpoint | 1,498 | 17.5 |
| Evening star | Large bullish bar, small body, then a bearish close below the first bar’s midpoint | 1,538 | 18.0 |
| Bullish marubozu | Bullish body at least 90% of range and larger than 0.7 ATR | 1,623 | 19.0 |
| Doji | Body at most 10% of range, range above 0.3 ATR | 8,682 | 101.7 |
| Tweezer bottom / top | Two bars whose lows (or highs) match within 0.05 ATR, after a decline (or advance) | 2,347 / 2,753 | 27.5 / 32.2 |
What 85,399 bars said about follow-through
Here is the core result, at all three horizons. The base column is the figure each pattern has to beat at one hour.
| Pattern | 15 min | 1 hour | 2 hours | Base at 1 hour |
|---|---|---|---|---|
| Hammer | 51.2% | 52.6% | 52.1% | 50.4% |
| Bullish engulfing | 48.9% | 49.0% | 49.4% | 50.4% |
| Morning star | 47.9% | 48.4% | 49.3% | 50.4% |
| Bullish marubozu | 47.2% | 49.8% | 50.4% | 50.4% |
| Tweezer bottom | 49.8% | 50.0% | 51.3% | 50.4% |
| Bearish engulfing | 46.8% | 48.3% | 48.1% | 49.6% |
| Evening star | 46.8% | 47.6% | 48.0% | 49.6% |
| Shooting star | 47.7% | 50.1% | 49.9% | 49.6% |
| Hanging man | 50.6% | 49.6% | 50.5% | 49.6% |
| Tweezer top | 49.2% | 50.6% | 50.4% | 49.6% |
Only the hammer cleared its base by more than two points: 52.6% against 50.4% at one hour. Even then, the median move five bars later was just 0.059 ATR. The engulfing patterns did worse than a random bar at every horizon. For example, the bullish engulfing scored 49.0% against a base of 50.4%. The stars were weaker still: the evening star scored 47.6% against 49.6%.
The doji has no direction, so we only report that 51.2% of dojis closed higher one hour later, against a base of 50.4%. In short, a 15-minute pattern on its own is close to noise. The hammer and hanging man share a shape and differ only by context, which our hammer vs hanging man guide covers in detail.
Reading candlestick patterns on a live intraday chart
Numbers aside, you still need to see what these shapes look like in a real session. The GBPUSD chart below marks a hammer and a shooting star on the 15-minute chart.
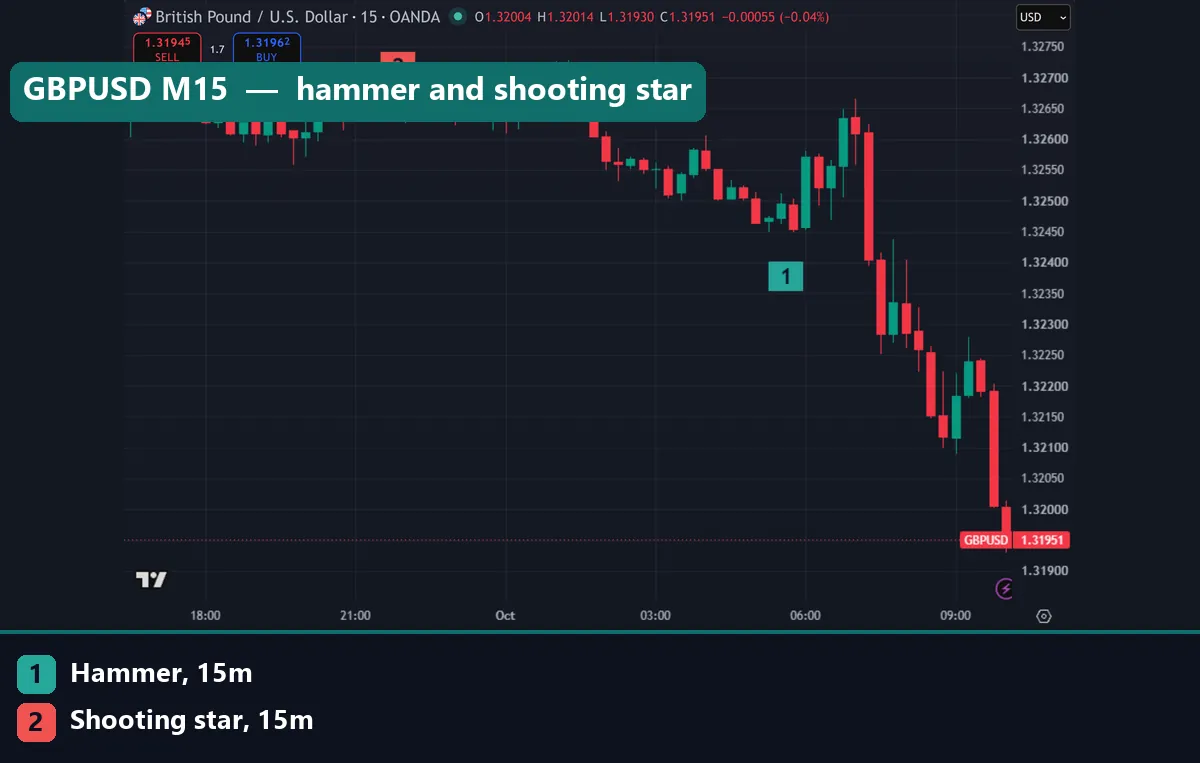
The hammer at 05:15 UTC on 1 October opened at 1.32468 and closed at 1.32472. Its whole range was 2.6 pips, from 1.32450 to 1.32476. The shooting star at 21:30 UTC on 30 September had a range of 2.3 pips. Meanwhile the chart header shows a spread of 1.7 pips. So both patterns were valid by the rules, but each was barely larger than the cost of one trade.
Neither told the story of the day. The shooting star led nowhere, and price later traded above its high. Then the big move came after 07:00 UTC, when London was open, and GBPUSD fell to 1.31951 by the last bar. Quiet-hour patterns are small for a reason: few people are trading.
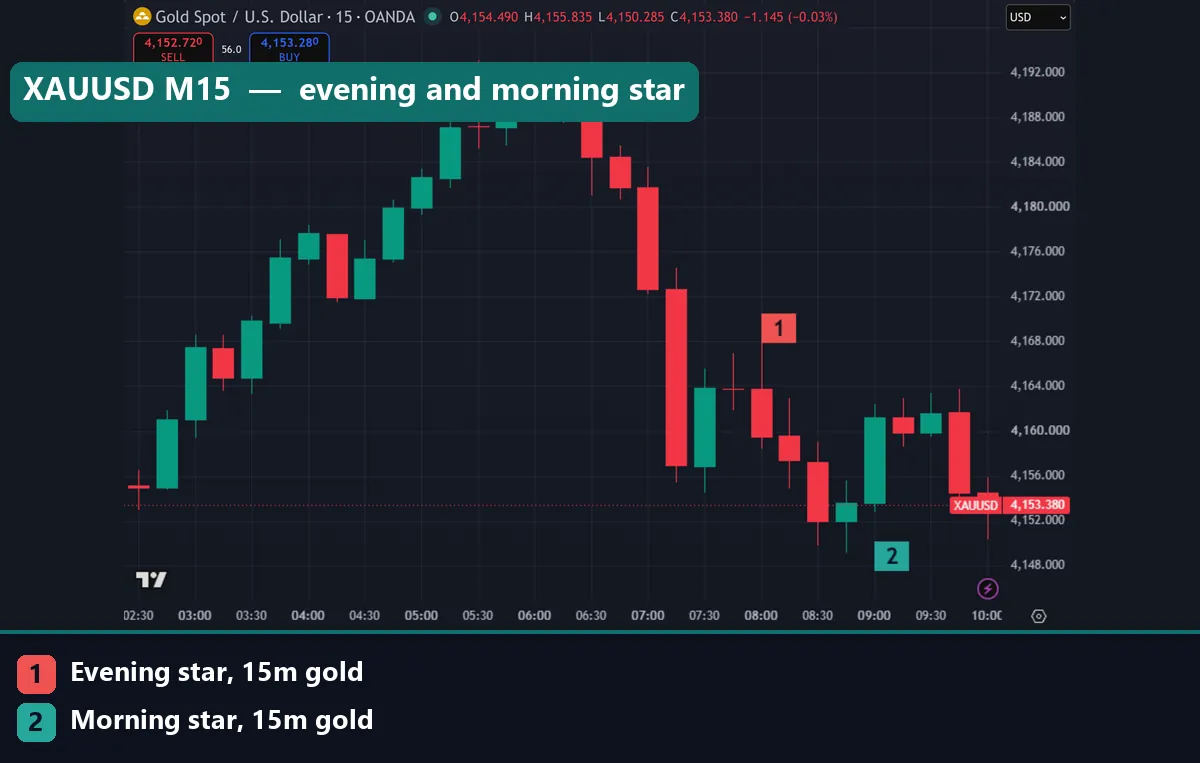
Gold shows the same issue at a larger scale. XAUUSD rallied into 06:00 UTC, then dropped hard on the 07:00 and 07:15 bars. After that, an evening star formed at 08:00, closing at 4,159.525. One hour later a morning star formed at 09:00, closing at 4,161.235. The two opposite signals sat inside the same range, and the last price was 4,153.38, between them. Both patterns are explained in our morning vs evening star guide.
Worked example: EURUSD on the morning of 1 October 2026
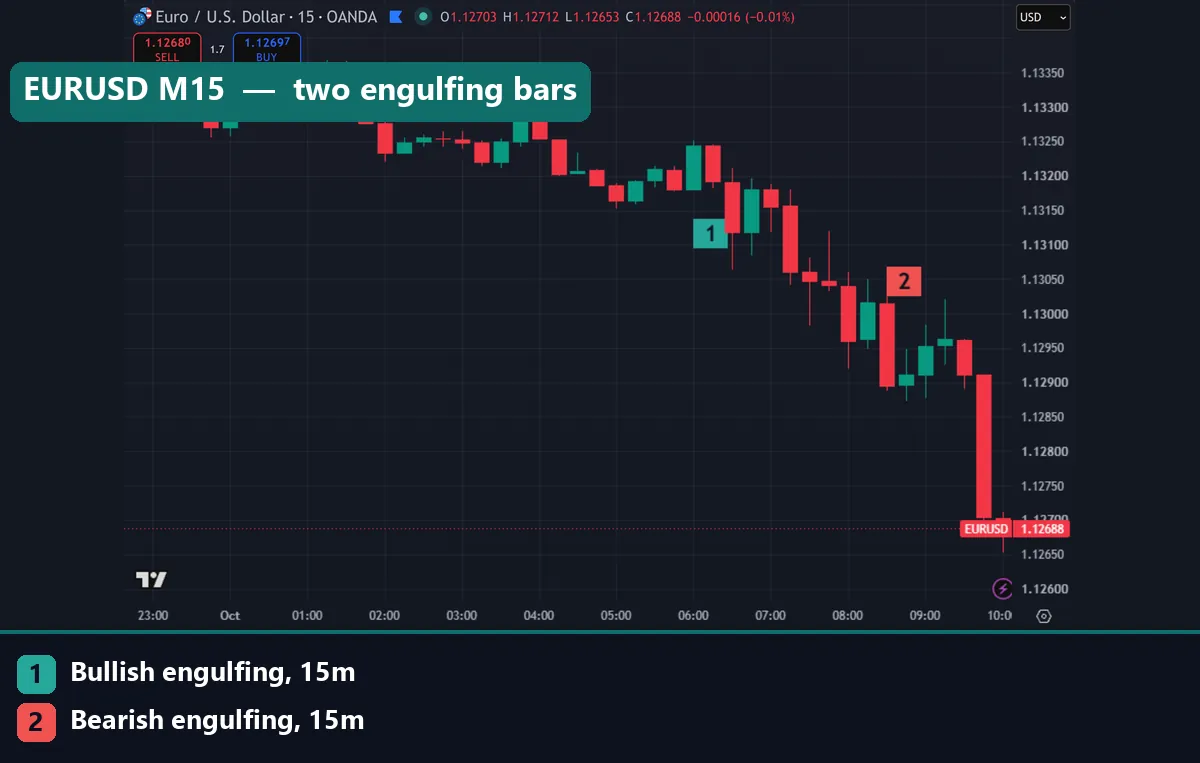
Look back at the first chart, EURUSD on 15 minutes. It holds two engulfing bars with very different context. We read them in three steps.
First, the higher timeframe. On the hourly chart, EURUSD had been falling since the 12:00 UTC bar on 30 September. The 06:00 UTC hourly candle was a doji: open and close both at 1.13180, high 1.13252, low 1.13064. So the hourly picture was a downtrend that had paused.
Next, the 15-minute bullish engulfing at 06:00 UTC. It opened at 1.13180 and closed at 1.13244. But it pointed against the hourly trend and sat in the middle of the doji’s range. Within half an hour, price traded back below its open.
Then the bearish engulfing at 08:30 UTC. It opened at 1.13015, below the hourly doji’s low of 1.13064, during the London morning. It closed at 1.12895, with a high of 1.13025. A stop above that high sits 13.0 pips from the close, plus 1.7 pips of spread. That is about 14.7 pips of risk.
Here is the honest part. Four bars later, the 09:30 bar closed at 1.12912, 1.7 pips against the trade. By our one-hour measure, this pattern failed. Only after that did EURUSD fall to 1.12688 on the 10:00 bar, about 20.7 pips below the entry. In short, the setup was well placed, but the payoff came outside the window we measured. One example proves nothing; it shows how context and patience change the read.
Hourly candles: the doji and the engulfing that got erased
The hourly chart gives the context the 15-minute chart lacks. This is the doji from the worked example, marked at 06:00 UTC.
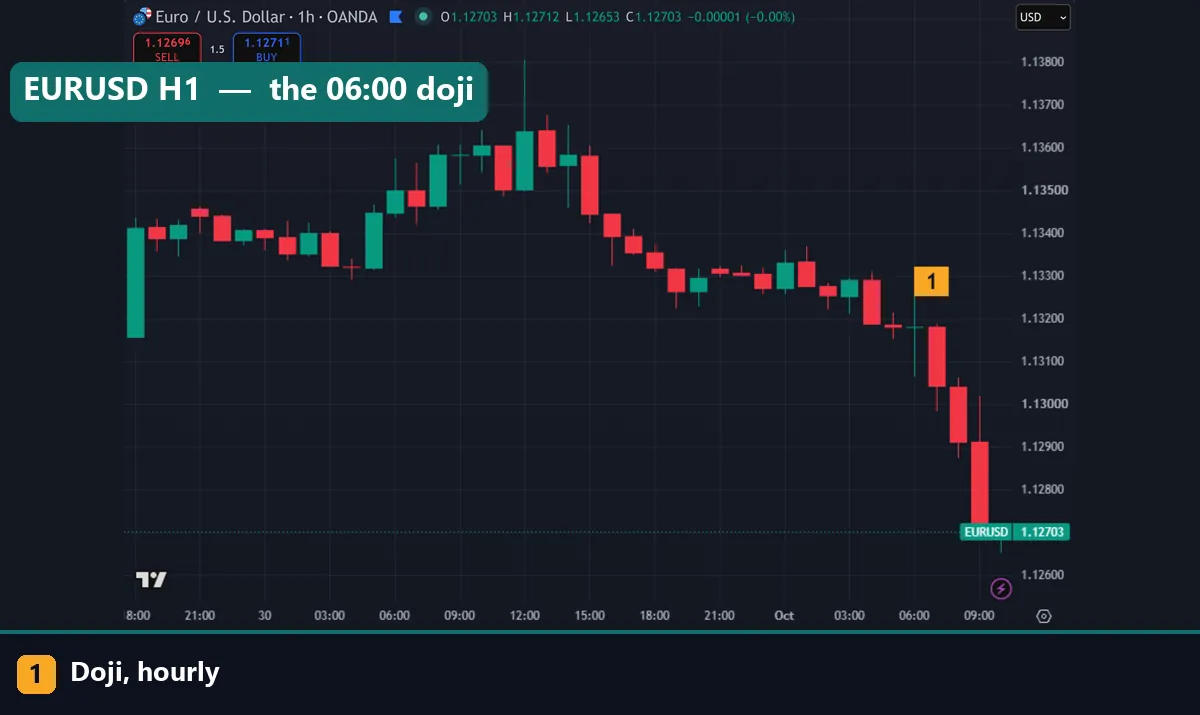
The doji’s lower wick reached 1.13064 and its upper wick 1.13252. A doji alone said nothing about direction, as our data showed. Still, its low became a useful line. Once 15-minute bars traded below it, the hourly pause had resolved in the trend’s favour. Our doji candle guide covers the variants.
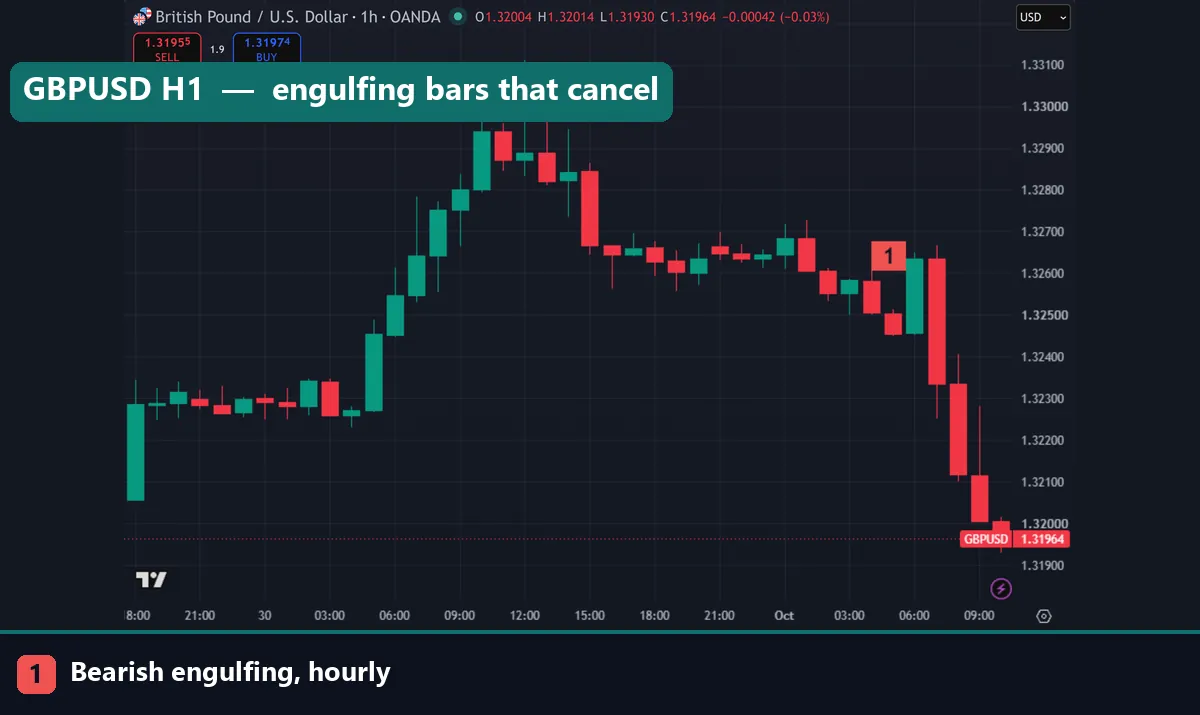
GBPUSD on the hourly chart shows how patterns cancel each other. The marked bearish engulfing at 04:00 UTC opened at 1.32582 and closed at 1.32506. Two hours later, a bullish engulfing at 06:00 UTC erased it, closing at 1.32634. Then a third engulfing, bearish, formed at 07:00 UTC: 1.32635 down to 1.32335, a 30-pip body. Three engulfing bars in four hours, two directions. The one that mattered came with size, at the London open, in line with the earlier drop. The engulfing candle guide explains why body size matters.
Download the complete indicator database
Put these concepts on your charts. One email unlocks the full library of 1,380+ indicators with compiled MT4 and MT5 files, plus my TradingView scripts. No paywall, no spam, unsubscribe any time.
Get free access to my indicator database
One email unlocks 1,380+ free MT4, MT5 and TradingView indicators — the complete library. No single-tool download; you get the whole database.
A framework that puts context before the candle
Since the pattern alone is close to a coin flip, use it only as the last step. Here is the order we use when we read intraday charts.
- Session. Trade the busy hours. The London trading session and the overlap with New York carry most of the volume. The BIS Triennial Survey of FX turnover shows how concentrated trading is in a few centres.
- Level. Mark the prior day’s high and low, the Asian range and clear hourly swing points. A pattern at a level means more than one in open space. Our guide to candlestick patterns at support and resistance shows how.
- Higher timeframe. Check the hourly or four-hour direction first. Then take only the 15-minute patterns that agree with it. Our multi-timeframe analysis guide covers the routine.
- The candle. Now the pattern is timing, not a reason. Put the stop beyond its extreme, and size the trade from that distance.
This filter cuts the number of trades sharply. That is the point. Fewer, better-placed trades pay the spread fewer times. A scanner such as our candlestick pattern detector indicator can flag shapes for you. Still, the session, the level and the trend check stay your job.
Where it fails
First, the patterns themselves. Our numbers show most 15-minute shapes within a point or two of the base rate. Engulfing bars and stars did worse than a random bar. No filter turns a weak signal into a strong one; context only removes some bad cases.
Second, cost. The hammer’s median move after five bars was 0.059 ATR. On the EURUSD chart below, ATR(14) read 0.00087, or 8.7 pips, during a busy hour. So 0.059 ATR is about half a pip, while the same chart shows a spread of 1.8 pips. The typical move does not pay for the trade. Our page on the spread in forex shows how this adds up.
Third, context rules have weak spots too. We tested a simple Asian-range breakout on 15-minute data with a 1R target and no costs. EURUSD lost 10.39R over 244 trades, GBPUSD lost 5.33R over 198, USDJPY lost 7.71R over 68 and EURJPY lost 3.63R over 13. Only XAUUSD gained, 23.57R over 189 trades. So a session rule helped on one market and hurt on four.
Finally, news. A data release can print any shape in one bar, and the next bar can reverse it. Patterns formed in the minutes around a major release are not the same signal.
Volatility, spread and the size of the edge
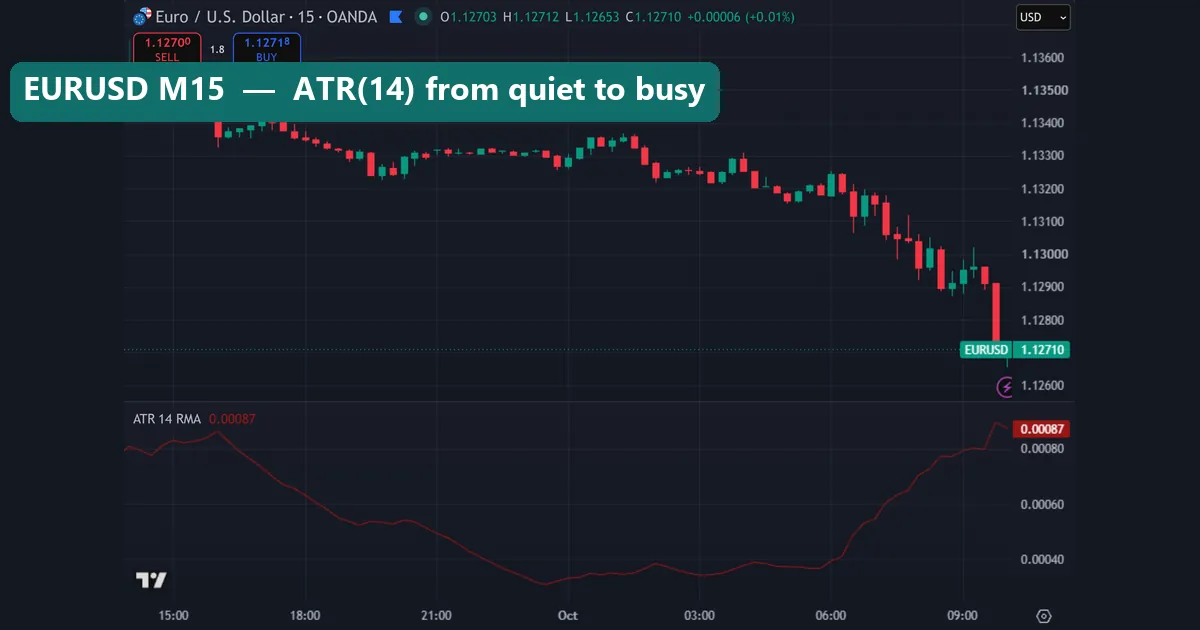
The ATR panel shows the other trap. Overnight, ATR(14) fell below 0.00040, so a full 15-minute bar moved less than four pips. Then it climbed back to 0.00087 after 06:00 UTC. Patterns in the quiet stretch are small, and the spread eats a larger share of them. Our guide on how to use ATR for day trading covers stop sizing, and the ATR reference in TradingView’s help center gives the formula.
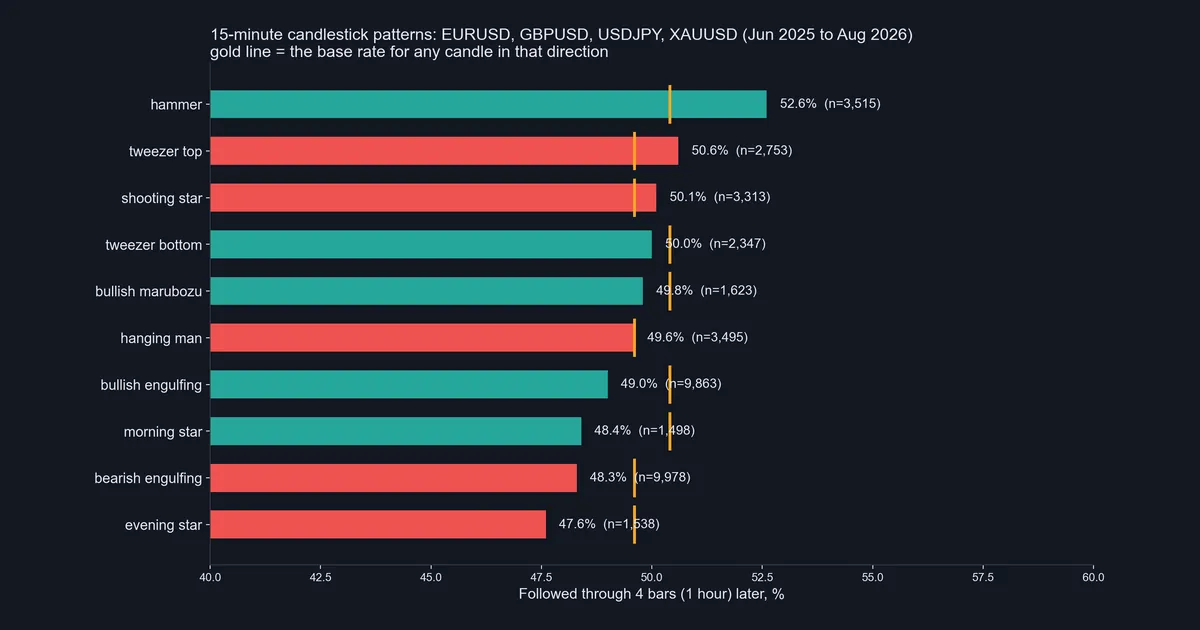
This chart is our own measurement, drawn from the MT4 data above. Each bar is a pattern’s one-hour follow-through. The gold line is the base rate for any bar in that direction. Only the hammer sits clearly to the right of its line.
Four common mistakes in day trading candlesticks
- Trading every pattern. With roughly eleven bullish engulfing bars per symbol per day, taking them all means paying the spread again and again for a near coin flip.
- Ignoring the hour. A 2-pip shooting star at 21:30 UTC is not the same signal as a 30-pip engulfing bar at the London open.
- Fighting the hourly trend. The EURUSD bullish engulfing at 06:00 UTC pointed against the hourly decline and failed within half an hour.
- Judging from a few trades. Our figures rest on thousands of cases per pattern. Ten trades in a journal cannot show an edge of one or two points. Our page on backtest sample size explains the math.
Where to go next
Start with the context tools. The trading sessions open and close indicator marks the hours on MT4 and MT5. Then add a pattern scanner such as the engulfing candle alert indicator, which flags bars so you can check context yourself.
For more reading on the shapes, the candlestick charts article at StockCharts ChartSchool is a clear reference. For risk, set a daily loss limit before your first trade of the day.
FAQ
Is candlestick day trading profitable?
Not on patterns alone, based on our data: most 15-minute patterns were within a point or two of the base rate, before costs.
Which candlestick pattern did best on the 15-minute chart?
The hammer, at 52.6% follow-through after one hour against a base rate of 50.4%, though its typical move was small.
Do engulfing patterns work for day trading?
On their own they did worse than a random bar in our test: 49.0% for bullish and 48.3% for bearish engulfing at one hour.
Is the 15-minute or the hourly chart better for candlestick patterns?
We measured only 15-minute bars, but hourly candles gave clearer context in our chart examples, so we use them to filter 15-minute entries.
What is a base rate in pattern testing?
It is how often any bar moves in a given direction over the same horizon, which in our data was 50.4% for a higher close one hour later.
Why does spread matter more on the 15-minute chart?
Because 15-minute bars are small, so a spread of 1.7 to 1.8 pips can be most of a quiet-hour pattern’s range.
When should I avoid trading candlestick patterns intraday?
Avoid quiet hours with low ATR and the minutes around major data releases, when one bar can print any shape and reverse at once.
Can an indicator find these patterns for me?
Yes, a scanner can flag the shapes, but it cannot judge the session, the level or the trend, and results are not guaranteed; past performance is not indicative of future results.
Last updated: 1 October 2026.

About the author
Written by Dominic Walsh, a Forex trader and MT4/MT5 indicator, Expert Advisor and script developer. Every tool on forexmt4systems.com is tested on live charts before release and ships with ready-to-use compiled MT4 (.ex4) and MT5 (.ex5) files. Learn more about the trader and developer behind this site.
How we build, test and correct every tool: Editorial & Testing Policy. Trading carries risk; see the disclaimer.