
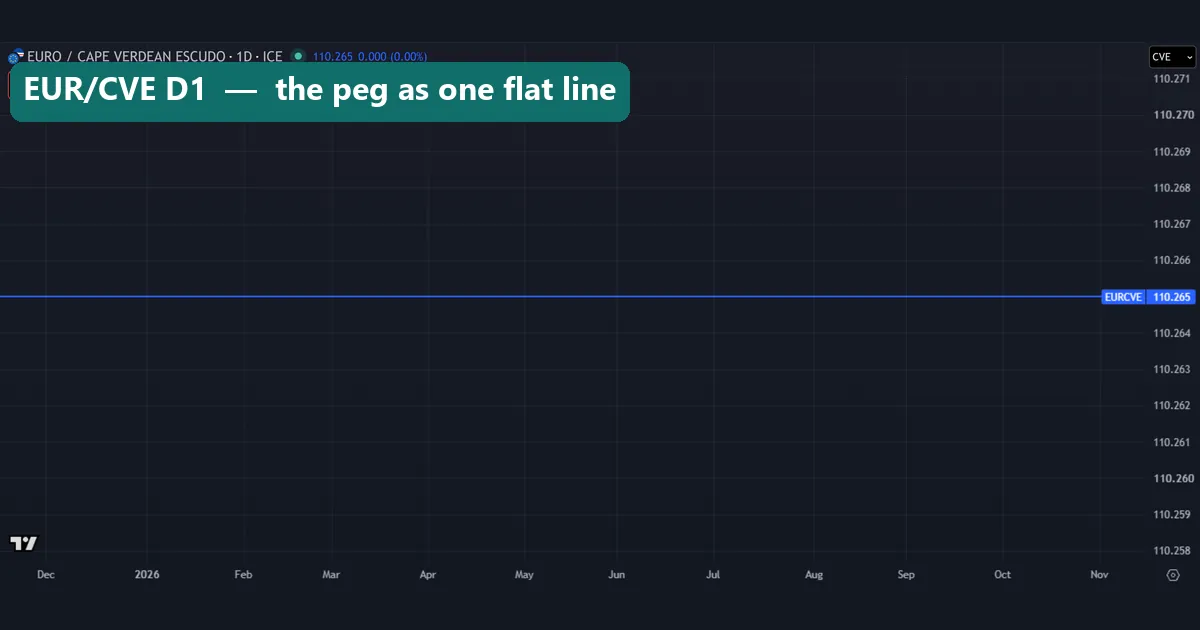
The Cape Verde escudo (CVE) trades at a fixed 110.265 escudos per euro. In our TradingView data, EUR/CVE closed on exactly that number on every trading day from 2017 to 13 November 2026. So the escudo’s dollar price is just the euro’s dollar price, turned upside down. This guide uses our own measurements to settle how the peg works, how closely quotes follow it, and why old escudo charts look broken.
What the Cape Verde escudo is
The escudo is the money of Cabo Verde, the island nation off West Africa that most English sources still call Cape Verde. Banco de Cabo Verde, the central bank, issues the notes and coins and runs monetary policy. On charts the code is CVE, in pairs such as EUR/CVE and USD/CVE.
What makes the escudo unusual is its anchor. Cape Verde does not let its currency float. Instead, it fixes the escudo to the euro. The central bank calls that parity its policy anchor on its Banco de Cabo Verde monetary policy strategy page (in Portuguese). The bank dates the fixed regime to 1998. It names three aims: a convertible escudo, stable prices and a protected value for the currency.
That puts the escudo in a small club of currencies that borrow their value from a bigger one. Bulgaria’s lev ran a euro peg too, as our BGN currency guide shows. Macao’s pataca follows the Hong Kong dollar instead, which our Macau patacas guide measures. For the wider picture, see our guide to African currencies.
How the Cape Verde escudo peg works
The peg began with Portugal, not the euro. On 13 March 1998, Portugal’s finance minister and Cape Verde’s minister for economic coordination signed an exchange cooperation agreement in Praia. Its first article ties the Cape Verdean currency to the Portuguese one at a fixed parity. In the second, Portugal undertakes to keep the escudo convertible. The third gives Cape Verde a credit line to top up its reserves. You can read the text in Portugal’s Decree 24/98, hosted by its Public Prosecution Service (PDF, in Portuguese).
The starting rate was 0.55 escudos per Portuguese escudo. When the euro replaced Portugal’s currency on 1 January 1999, that link carried over as 110.265 escudos per euro. Banco de Portugal’s 2020 review of the agreement (PDF, in Portuguese) gives both figures. It also reports that the rate stayed where it started across the 20 years it studied. Cape Verde drew on the credit line every year until 2004, and the review found reserves above the trigger level ever since.
The choice of anchor followed trade. The same study notes a heavy concentration of Cape Verde’s trade, remittances, aid and direct investment in Portugal and the future euro countries before the deal. One stated goal was to break the link between devaluation and inflation.
The one formula behind every escudo price
For prices, a single line does all the work. A euro always buys 110.265 escudos, so the escudo’s rate against any other currency follows from the euro’s rate against it.
EUR/CVE = 110.265 (fixed)
USD/CVE = 110.265 / EUR/USD
When EUR/USD rises, USD/CVE falls and each escudo buys more dollars. When EUR/USD falls, the escudo buys fewer. Nothing about Cape Verde’s own economy enters that line on a normal day. The same rule gives escudos per pound or per yen: divide 110.265 by the euro’s rate in that currency.
How we tested
We pulled daily bars for three symbols from the TradingView web chart on 16 November 2026. The bar dated 16 November was still forming, so we dropped it, and every series ends on Friday 13 November 2026. FX_IDC stamps its daily bars at 22:00 UTC the evening before, and we moved each one to its trading date.
- FX_IDC:EURCVE, daily, 13 October 2006 to 13 November 2026 (4,996 days), plus a weekly chart of the same span.
- FX_IDC:USDCVE, daily, 4 December 1997 to 13 November 2026 (6,710 days), plus a monthly chart.
- FX_IDC:EURUSD, daily, to build the peg-implied rate 110.265 / EUR/USD on 6,701 matching days from 1999. OANDA:EURUSD daily supplied the euro chart in this guide.
First, we removed single prints that sat far from the days on either side: 33 EUR/CVE prints and 31 USD/CVE prints. Then we counted how often EUR/CVE closed on exactly 110.265. Next, we measured the daily gap between USD/CVE and the peg-implied rate, and we correlated monthly changes in the two pairs. Our editorial testing policy explains how we capture and check data like this.
The peg’s parameters at a glance
The escudo has no indicator settings, but the peg does have parameters. Here they are, with the source for each one.
| Parameter | Value | Source |
|---|---|---|
| Anchor currency | Euro (Portuguese escudo before 1999) | Banco de Portugal review |
| Central rate | 110.265 escudos per euro | Banco de Portugal review; our EUR/CVE data |
| Starting parity | 0.55 escudos per Portuguese escudo | Banco de Portugal review |
| Agreement signed | 13 March 1998, Praia | Decree 24/98 |
| Agreement term | Four years, renewing for four-year periods | Decree 24/98, article 6 |
| Exit clause | Either side, with six months’ written notice | Decree 24/98, article 7 |
| Backstop | Portuguese credit line for reserves | Decree 24/98, article 3 |
| Dollar rate | 110.265 / EUR/USD | Arithmetic |
| Last USD/CVE close | 99.75 on 13 November 2026 | FX_IDC feed |
For chart readers, two rows matter most. EUR/CVE should be a flat line, and USD/CVE should move tick for tick against EUR/USD.
Reading USD/CVE and EUR/USD on a chart
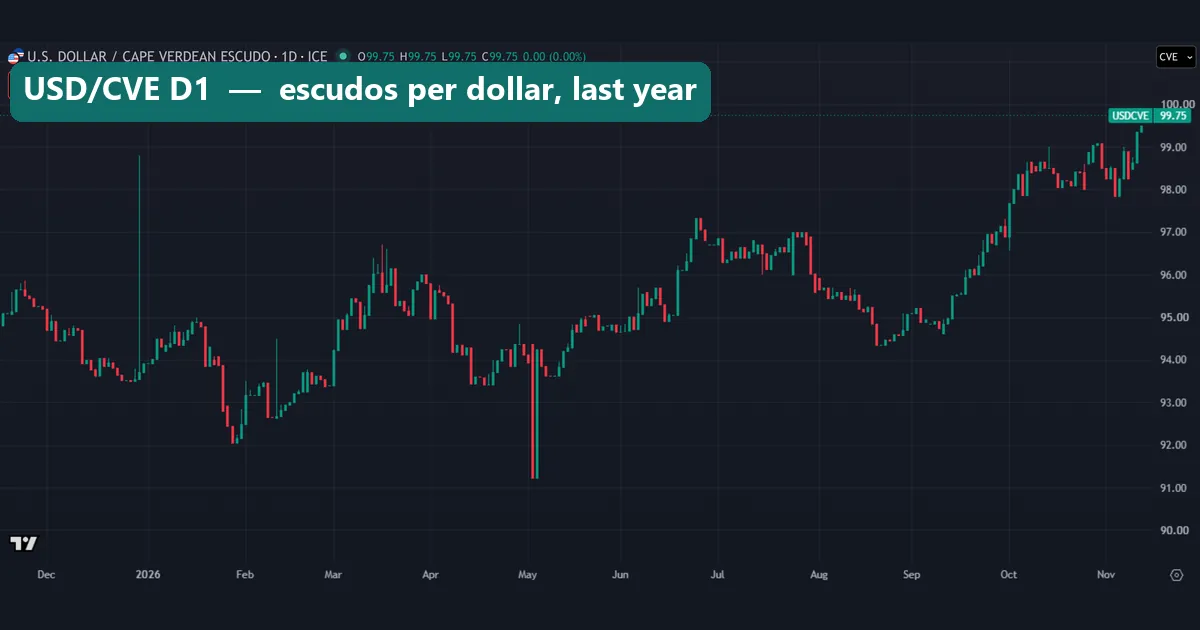
The daily USD/CVE chart covers the year to 13 November 2026. It climbs from near 92 at the turn of January and February to a close of 99.75. A higher number means more escudos per dollar, so the escudo lost ground against the dollar.
Two candles stand out. A thin wick in late December reaches above 98, and another in early May drops close to 91. Neither has a partner on the euro chart below, so treat both as bad prints. The SELL 99.75 and BUY 100.00 boxes show a quoted spread of 0.25 escudos. Our bid and ask price explainer covers those two numbers.
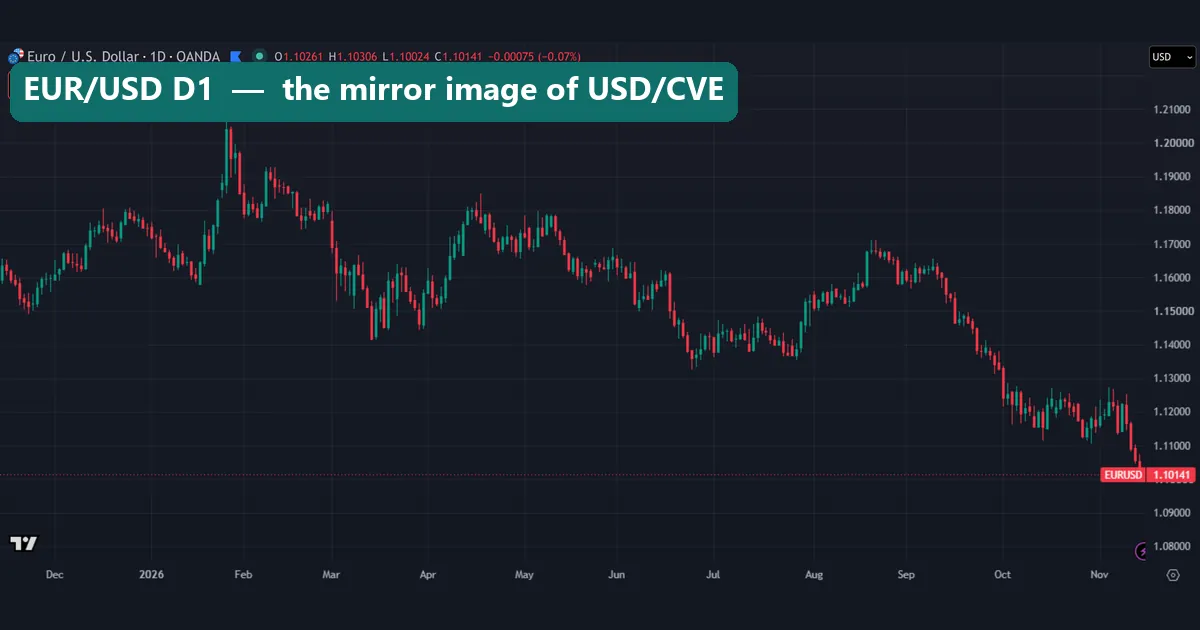
Now compare the OANDA EUR/USD daily chart for the same window. The euro peaks just above 1.20 in late January, as USD/CVE bottoms. From September the euro slides toward 1.10, and USD/CVE climbs in step. One chart is the other drawn upside down and scaled by 110.265. To judge the escudo’s direction, study EUR/USD; our EUR/USD technical analysis guide covers that pair.
Worked example: 10,000 escudos over two years
Take 10,000 escudos held in Cape Verde, and price them with the feed’s year-end closes.
- In euros the sum never moves: 10,000 / 110.265 = 90.69 euros, at the end of 2024, the end of 2025 and on 13 November 2026.
- USD/CVE closed 2024 at 106.15, so 10,000 escudos bought $94.21.
- USD/CVE closed 2025 at 93.92, so the same sum bought $106.47, a 13.0% gain for the escudo.
- On 13 November 2026 USD/CVE printed 99.75, so the sum bought $100.25, a 5.8% loss so far this year.
Next, run the peg backwards. Dividing 110.265 by 99.75 gives an implied EUR/USD of about 1.1054 for 13 November. Dividing it by 93.92 gives about 1.1740 for the end of 2025. In other words, the escudo’s 5.8% slide in 2026 is the euro’s own slide against the dollar. A saver who thinks in euros saw no change, while anyone paid in dollars felt every swing. Our currency converter handles the euro and dollar legs of sums like these. For an official EUR/USD figure, use the ECB’s euro foreign exchange reference rates.
Measuring the peg in the TradingView feed
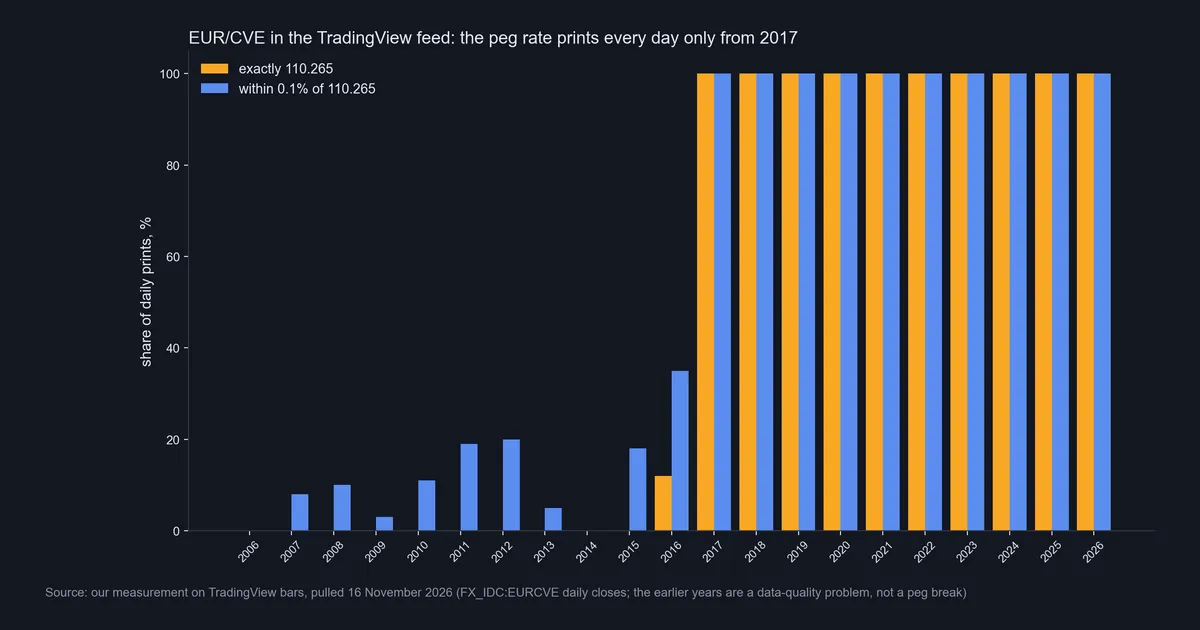
Our first data chart works year by year. It counts how often the FX_IDC EUR/CVE close was exactly 110.265, and how often it sat within 0.1%. From 2017 through 2026, both bars reach 100% in every year. Before that, the picture falls apart. From 2007 to 2015 the feed never printed the exact peg. It came within 0.1% on only 0% to 20% of days. 2016 is the turning year, with 12% exact and 35% close.
That pattern tells a data story, not a policy story. The vendor’s quote wandered; the official rate did not, according to the Banco de Portugal review. Over all 4,996 days, EUR/CVE closed on exactly 110.265 on 50.6% of days. Yet its closes ranged from 99.19 to 118.73.
Since 2017: the dollar rate sits on the formula line
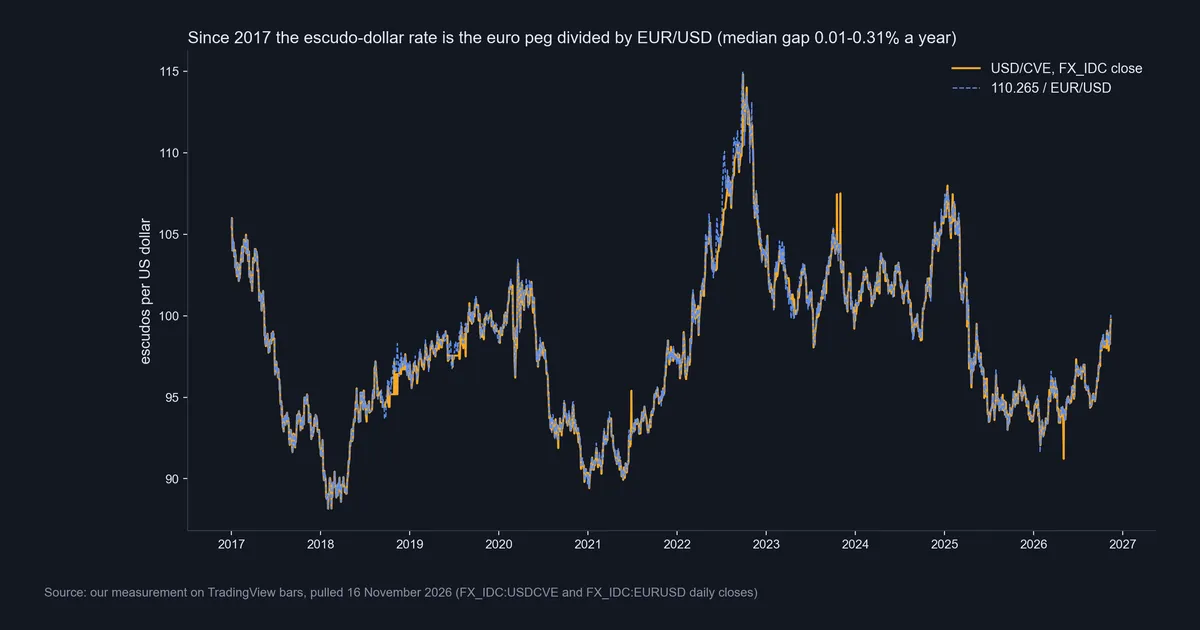
The second chart tests the dollar side from 2017. The orange line is the FX_IDC USD/CVE close, and the dashed blue line is 110.265 divided by EUR/USD. They sit on top of each other, with a median gap of 0.01% a year (2017) to 0.31% (2022). Since 2015, monthly changes in USD/CVE correlate at -0.97 with EUR/USD, close to a perfect mirror. Our guide to currency correlation in forex explains how to read a figure like that. A few orange spikes still break away, such as one in late 2023 and the early-May 2026 print near 91.
Download the complete indicator database
Put these concepts on your charts. One email unlocks the full library of 1,380+ indicators with compiled MT4 and MT5 files, plus my TradingView scripts. No paywall, no spam, unsubscribe any time.
Get free access to my indicator database
One email unlocks 1,380+ free MT4, MT5 and TradingView indicators — the complete library. No single-tool download; you get the whole database.
Where it fails
The first limit is the source. FX_IDC is a data vendor’s quote, not Banco de Cabo Verde’s official rate. The central bank publishes its own exchange rates, and contracts, invoices and customs forms should use those. A bank or exchange desk will also add its own margin to any rate on a chart.
The second limit is history. Before 2017 the vendor’s escudo quotes are unreliable. In 2002, 2003 and 2004, USD/CVE sat a median 5.61%, 12.17% and then 18.38% away from the peg-implied rate. Across all years, daily USD/CVE changes correlate at only -0.31 with EUR/USD. Stale prints and catch-up jumps cause that weak link, not the peg.
The third limit is policy risk, and no price series can measure it. The 1998 agreement runs in four-year terms, and either side can end it with six months’ written notice. Our data shows a rate that held; it cannot give you the odds of a change. Finally, a chart says nothing about cash. How freely you can swap escudos outside the islands depends on banks and rules we did not test.
The long record: stale quotes before 2017
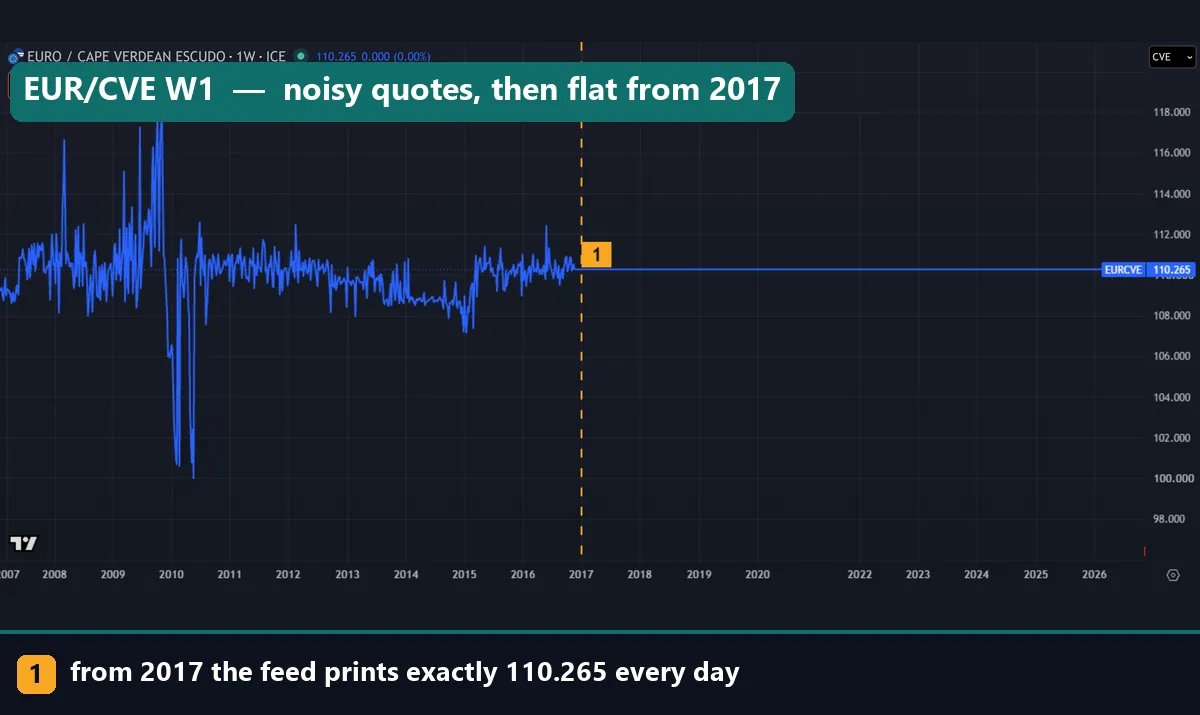
The weekly EUR/CVE chart shows the whole feed history in one frame. From late 2006 to 2016 the line wobbles around 110, with spikes toward 118 around 2009 and drops toward 100 in 2010. Marker 1 sits at the start of 2017. From there the line stays flat at 110.265 to November 2026. The currency did not change in 2017; the quality of the quote did.
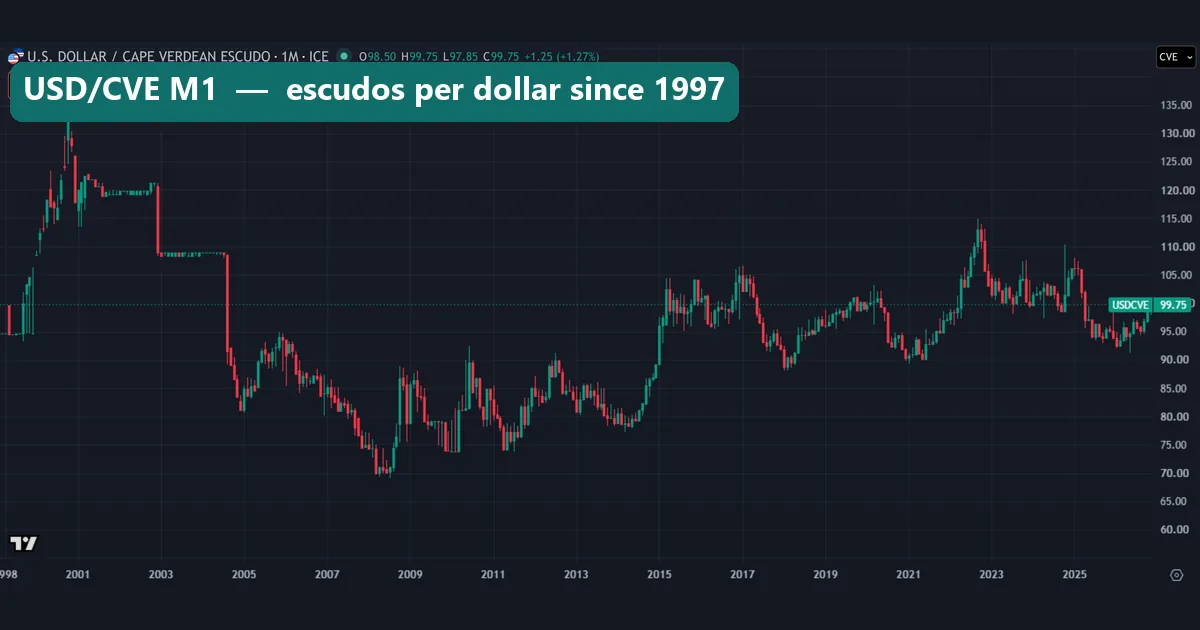
The monthly USD/CVE chart shows the same fault on the dollar side. Look for the flat shelves. One ran 223 days near 119.8, from 17 September 2001 to 23 October 2002. Another ran 138 days near 108.95, from 16 December 2003 to 21 July 2004. A pegged rate cannot sit still while the euro moves, so these are prints that stopped updating. Each shelf ends in a cliff. The rate fell from 121.25 to 109.52 on 5 December 2002. Then it fell from 108.63 to 90.5 on 10 August 2004, a 16.69% drop in one print. That is the feed catching up after a gap, not a revaluation.
Away from the shelves, the record behaves. The highest print, 133.254 on 31 October 2000, implies EUR/USD near 0.8275. The lowest, 69.1 on 16 July 2008, implies about 1.5957. Our guide on whether the euro is stronger than the dollar follows that pair across the same years.
Common mistakes with the Cape Verde escudo
- Reading feed jumps as devaluations. The 16.69% drop on 10 August 2004 came weeks after a 138-day frozen stretch. The March 2010 jump came right after a 53-day flat stretch near 73.9. Check the gap to 110.265 / EUR/USD before you call any move a policy event.
- Trading USD/CVE as if it had its own story. Since 2017 the pair is EUR/USD inverted, with a wider spread. Any view on the escudo against the dollar is a view on the euro.
- Using a chart quote as the official rate. For anything legal or contractual, use the rate Banco de Cabo Verde publishes.
- Multiplying instead of dividing. Escudos per dollar equal 110.265 divided by EUR/USD. Multiplying gives about 121 when EUR/USD sits at 1.10, which is far off.
Where to go next
To compare the escudo with other currencies, start with our lists of the most valuable currencies in the world and the weakest currencies in the world. To see how a national currency becomes a fixed slice of the euro, read our guide to German money before the euro. For the basics of money backed by policy rather than metal, see our explainer on fiat currency. Our four primary sources are linked in the sections above.
FAQ about the Cape Verde escudo
What does CVE stand for?
CVE is the code for the Cape Verde escudo. Charts pair it as EUR/CVE or USD/CVE, which show the escudos that one euro or one dollar buys.
How many escudos are in one euro?
One euro buys 110.265 escudos at the peg. Our FX_IDC data closed on that exact figure every trading day from 2017 to 13 November 2026, so one escudo is worth about 0.0091 euros.
Why does the escudo’s dollar rate keep changing?
The escudo follows the euro, and the euro floats against the dollar. USD/CVE equals 110.265 divided by EUR/USD. As the euro lost ground in 2026, it rose from 93.92 at the end of 2025 to 99.75 on 13 November.
What was the escudo linked to before the euro?
It followed the Portuguese escudo, at 0.55 Cape Verde escudos per Portuguese escudo, under the March 1998 agreement. When Portugal moved to the euro in 1999, the link carried over as 110.265 per euro.
Has the 110.265 rate ever changed?
Banco de Portugal’s 2020 review found the parity unchanged since its first fixing, and our feed agrees from 2017 on. Older feed values away from 110.265 reflect stale or noisy quotes, not official changes.
Why do old charts show EUR/CVE at 100 or 118?
Those are vendor quotes that drifted, froze or spiked. From 2007 to 2015 the FX_IDC series never closed on exactly 110.265. Use data from 2017 on, or the central bank’s own rates, for anything that matters.
Is USD/CVE worth watching for trades?
Not on its own. Since 2017 it has tracked 110.265 / EUR/USD within a median gap of 0.31% or less each year. So it adds nothing that EUR/USD does not show. It also carries a wider spread and the odd bad print.
Could Cape Verde change the peg?
Yes, in principle. The 1998 agreement renews in four-year terms, and either side can end it with six months’ written notice. Our data shows only that the rate has held so far. As with any market history, results are not guaranteed; past performance is not indicative of future results.
Last updated: 16 November 2026.

About the author
Written by Dominic Walsh, a Forex trader and MT4/MT5 indicator, Expert Advisor and script developer. Every tool on forexmt4systems.com is tested on live charts before release and ships with ready-to-use compiled MT4 (.ex4) and MT5 (.ex5) files. Learn more about the trader and developer behind this site.
How we build, test and correct every tool: Editorial & Testing Policy. Trading carries risk; see the disclaimer.