
JOLTS job openings are the US jobs that employers want to fill but have not filled yet. The Bureau of Labor Statistics (BLS) counts them each month in its Job Openings and Labor Turnover Survey. This guide settles what the number means, how to read it next to the jobless count, and what 310 months of data show. In September 2026 there were 7.52 million openings, or 1.06 for every unemployed person. At the March 2022 peak there were 12.30 million, and 2.04 per person. In short, openings show how hungry firms are for staff. But the figure arrives late, and it gets revised.
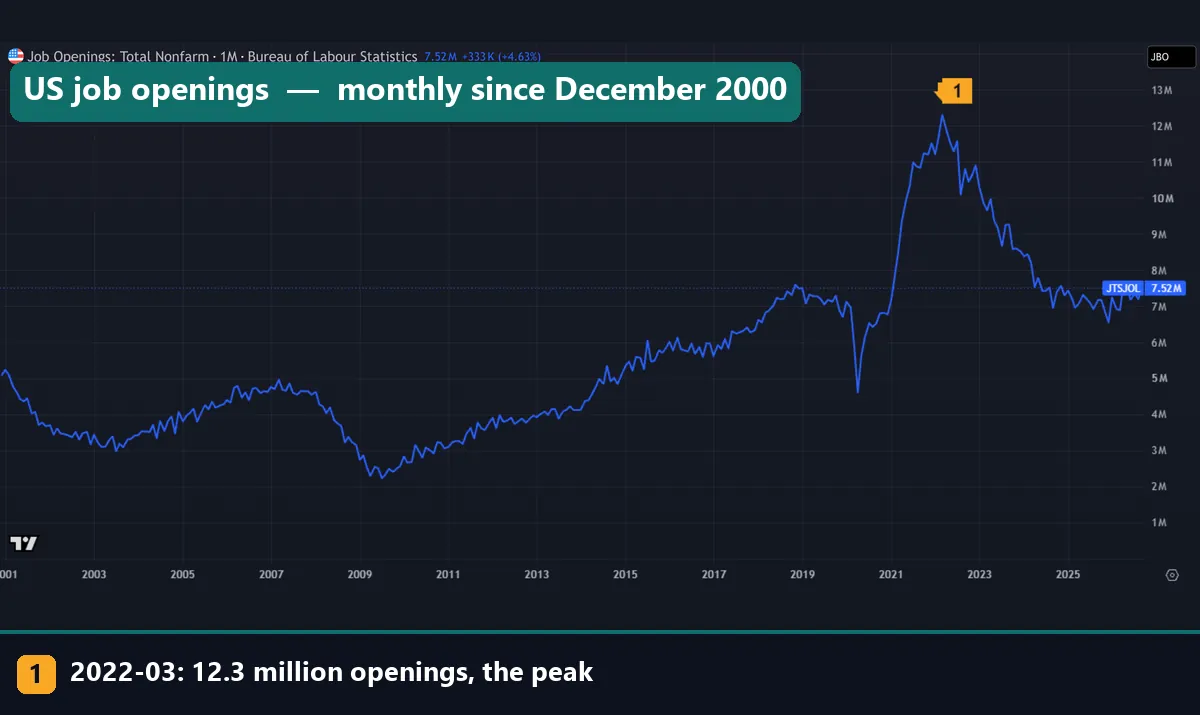
This is the openings line, one value per month from December 2000 to September 2026. Marker 1 is the March 2022 peak. Also note the deep trough in 2009 and the sharp drop in 2020.
What JOLTS job openings actually measure
JOLTS is a monthly survey run by the BLS. It tracks openings, hires and separations. Separations split into quits, layoffs and discharges, and other exits such as retirement.
Investopedia’s explainer on the JOLTS survey sums up the method. The BLS asks a sample of about 21,000 private firms and government employers. A job counts as open only if three things hold at month end. First, the position exists and there is work to do. Next, the job could start within 30 days. Last, the employer is actively recruiting from outside the firm. Part-time and temporary roles count too.
So an opening is a seat, not a person. That makes it a gauge of labor demand. It differs from the payroll count in the monthly jobs report (NFP), which counts people who already have a job.
How the numbers are built: three formulas
A raw level in millions hides a lot, so analysts turn it into a rate and a ratio. Investopedia describes the openings rate as a share of all jobs, filled and unfilled.
openings rate (%) = openings / (employment + openings) x 100
openings per unemployed person = openings / unemployed people
quits rate (%) = quits / employment x 100
The rate matters because the economy grows. A level of 5.09 million in December 2000 gave a rate of 3.7%. Then 7.52 million in September 2026 gave 4.5%. So the level rose by about half, but the rate rose far less.
The ratio mixes two surveys. Openings come from employers, while the unemployed count comes from the household survey behind the jobs report. For September 2026, 7.52 million openings over 7.11 million unemployed people gives 1.06. Meanwhile the quits rate read 2.1%: about two of every hundred workers left a job by choice that month.
How we tested
We pulled seven monthly series on the TradingView web chart on 16 November 2026. Five are FRED copies of BLS JOLTS data: FRED:JTSJOL, JTSJOR, JTSQUR, JTSHIL and JTSLDL. The other two are FRED:UNEMPLOY and FRED:UNRATE. All seven are seasonally adjusted, and the table below says what each one holds.
The window runs from December 2000 to September 2026, which is 310 months. Each point is a data month, not a release month. JOLTS comes out about five weeks after the month it covers.
We built the ratio as JTSJOL divided by UNEMPLOY. Then we plotted the openings rate against the unemployment rate to get the Beveridge curve. After that we counted months above 1.0 and found each series’ highs and lows.
We did not study any market move around JOLTS releases. With no file of release dates, we make no claim about EUR/USD or the dollar. Our editorial testing policy sets out how we collect and check numbers like these.
The series we pulled and their latest values
Here is what each symbol holds, with its value for September 2026.
| Symbol | What it measures | Units | September 2026 |
|---|---|---|---|
| FRED:JTSJOL | Job openings, total nonfarm | Millions | 7.52 |
| FRED:JTSJOR | Openings rate | % of filled plus open jobs | 4.5 |
| FRED:JTSQUR | Quits rate | % of employment | 2.1 |
| FRED:JTSHIL | Hires | Millions | 5.40 |
| FRED:JTSLDL | Layoffs and discharges | Millions | 1.64 |
| FRED:UNEMPLOY | Unemployed people | Millions | 7.11 |
| FRED:UNRATE | Unemployment rate | % of labor force | 4.2 |
| JTSJOL / UNEMPLOY | Openings per unemployed person | Ratio | 1.06 |
Unlike an indicator, there are no inputs to tune. What matters is which ratio you build and which months you compare. On TradingView you can type a ratio such as FRED:JTSJOL/FRED:UNEMPLOY into the symbol box. Our guide to using the TradingView chart covers the basics.
Reading openings per unemployed person on a chart
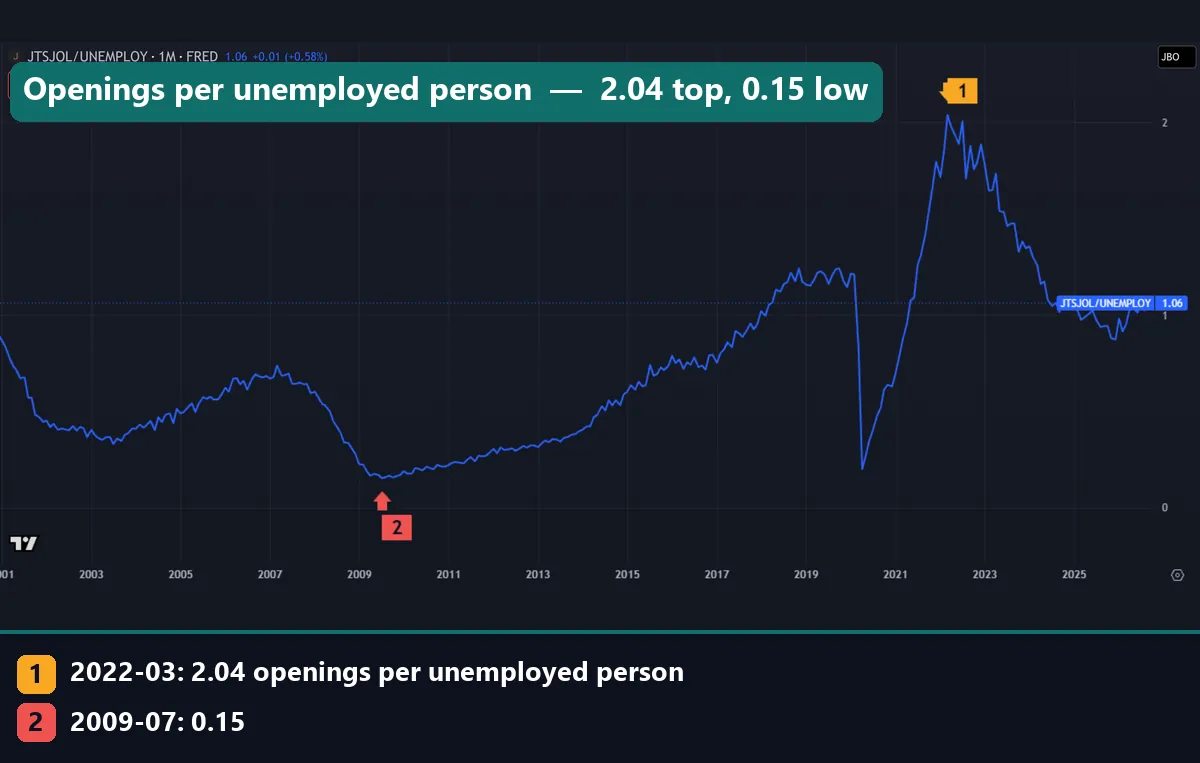
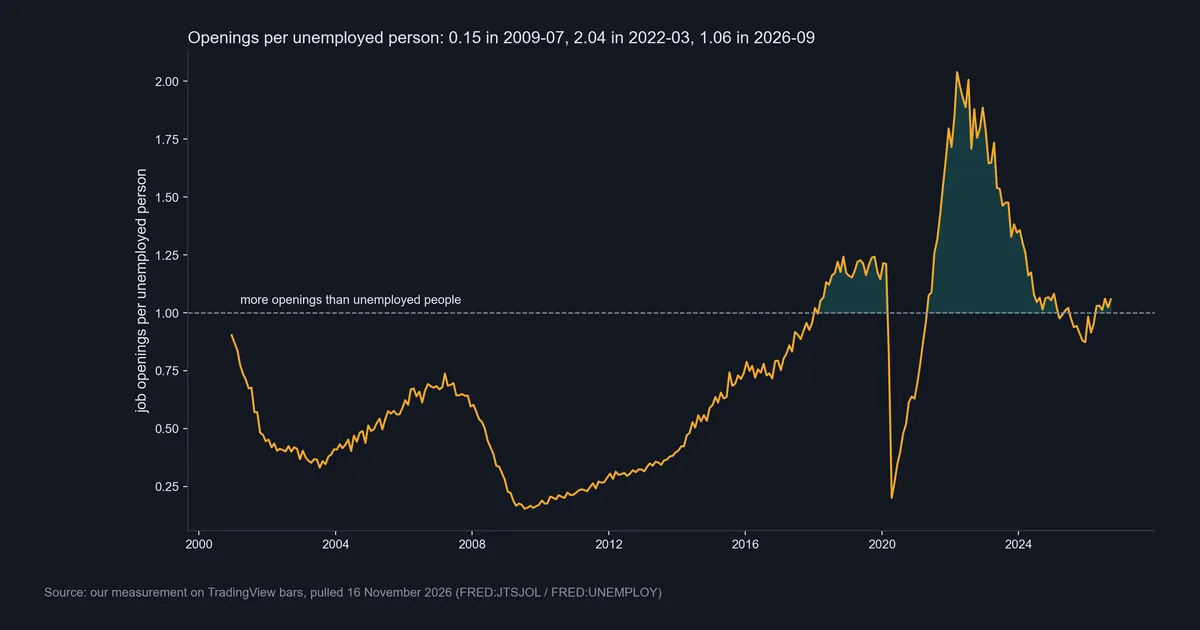
This chart divides openings by unemployed people. Marker 1 is March 2022, at 2.04 openings per unemployed person. Marker 2 is July 2009, at 0.15. At that low there was less than one opening for every six people out of work.
Read the ratio against 1.0. Above it, open jobs outnumber the people looking for work. Below it, job seekers outnumber openings. The last value is 1.06, close to even.
The climb after 2009 was slow, and the ratio first reached 1.0 in January 2018. Then the 2020 drop looks like a cliff, because two things hit it at once. Openings fell while the jobless count jumped, and the ratio sank to 0.2 in April 2020. To see how such turns fit the cycle, read our guide to the business cycle and economic indicators.
Reading the quits rate next to openings
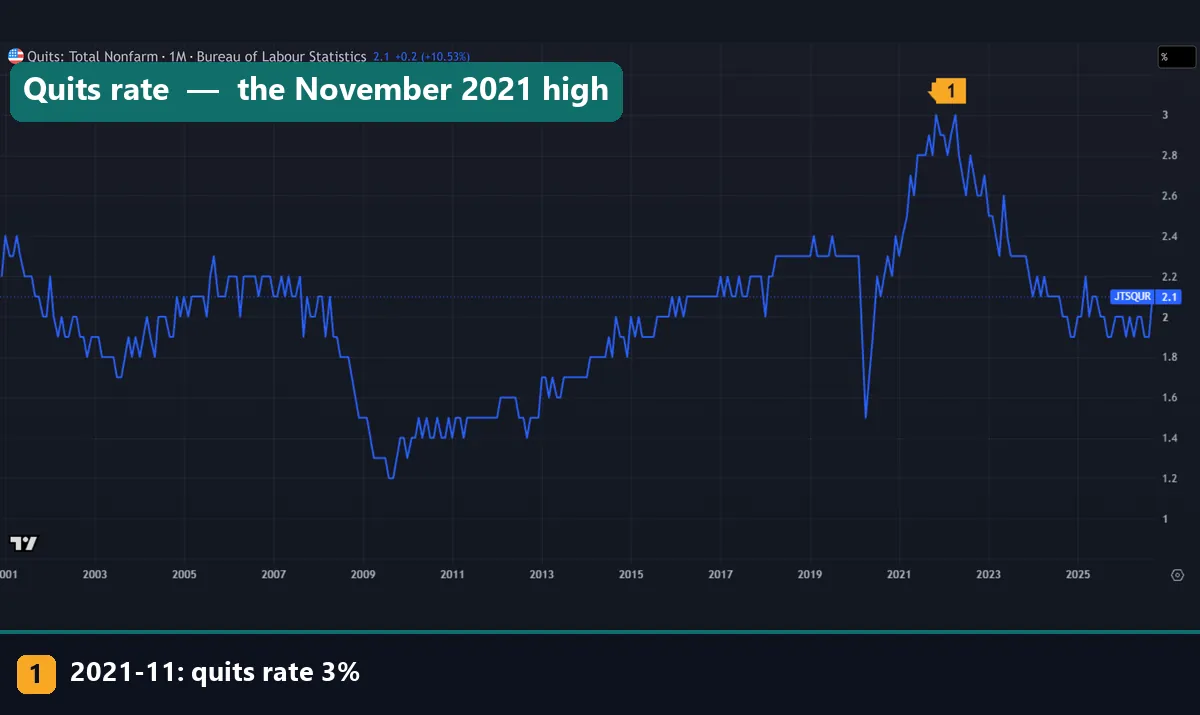
Quits are people who leave a job by choice. Workers quit more when they think a new job is easy to find. So the quits rate checks the openings line: it shows whether workers believe those openings are real.
Marker 1 is November 2021, at 3.0%, the top of our series. The rate touched 3.0% again in April 2022. The low was 1.2% in August 2009. In September 2026 it read 2.1%, up 0.2 points on the month, as the chart header shows.
After 2022, both lines fell. Openings went from 12.30 million to 7.52 million, and quits slid to around 2%. Together they say the hunt for staff of 2021 and 2022 has faded. One caution: the rate moves in steps of 0.1 point, as the stair shape shows. So a single 0.1 change is often just noise.
Worked example: the September 2026 report
Here is how we would read the latest month, using only numbers from our charts and data.
- Start with the level. Openings were 7.52 million, up 333K from August, or 4.63%, as the first chart’s header shows.
- Check the rate. It rose from 4.3% to 4.5%, so the rise is more than a bigger workforce.
- Divide by the unemployed. 7.52 million over 7.11 million gives 1.06. That is the sixth month in a row above 1.0, a run that began in April 2026.
- Look at hires. Firms made 5.40 million hires. Openings are a stock at month end and hires a flow during the month, so the two do not cancel out.
- Check exits. Quits rose to 2.1% from 1.9%. Layoffs and discharges fell by 127K to 1.64 million.
- Add context. At the March 2022 peak, the rate was 7.5% and the ratio 2.04. In June 2018, with unemployment at 4.0%, the openings rate was 4.6%.
Our reading: a job market close to balance. It is a little firmer than in January to March 2026, when the ratio sat below 1.0. And it sits near the 2018 level, far from 2022. To find JOLTS in a busy week, our guide on how to read an economic calendar walks through the layout.
The Beveridge curve from 310 months of data
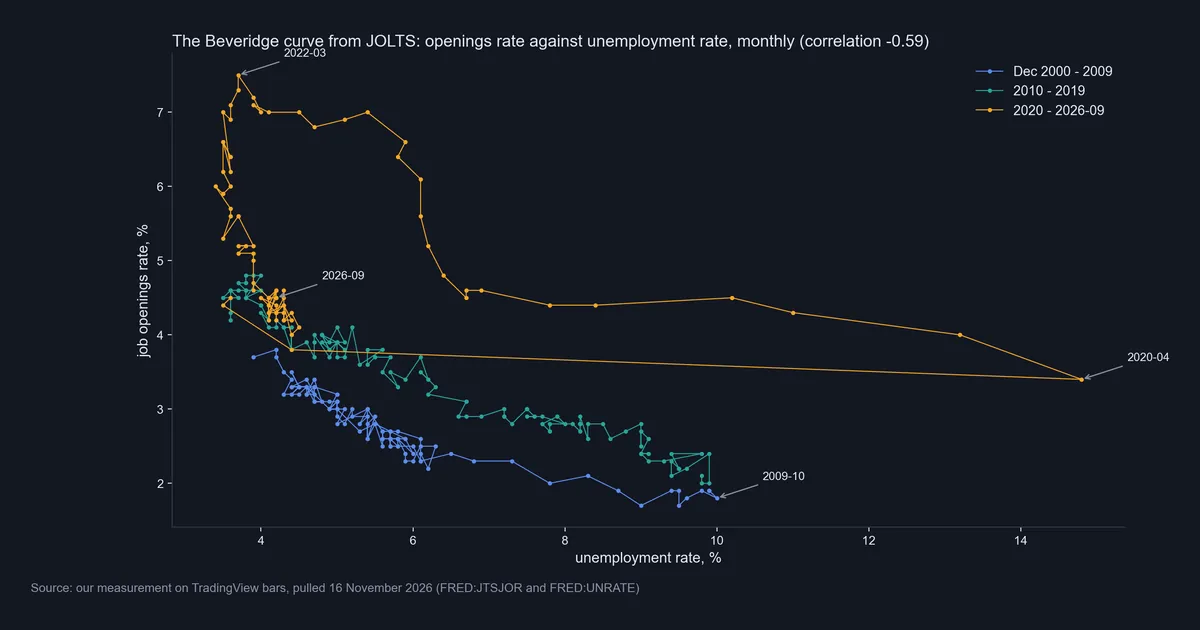
The Beveridge curve plots the openings rate against the unemployment rate, one dot per month. When firms want more staff, openings rise and joblessness falls, so the dots slope down to the right. Across our 310 months the correlation is -0.59: clearly negative, but far from a tight line.
The colors tell the real story. Blue dots, from December 2000 to 2009, run lowest. Green dots for 2010 to 2019 sit a little higher. Then the orange dots from 2020 on sit above both. So at a similar jobless rate, firms now post more openings than in the 2000s.
Our data shows this near 4% unemployment. In June 2018 the openings rate was 4.6%, with unemployment at 4.0%. In June 2024 it was 4.5%, and in June 2025 it was 4.3%, both at 4.1% unemployment.
The labels mark the corners: October 2009 at 10% unemployment, April 2020 at 14.8%, and March 2022 at the top. September 2026 is back in the cluster near 4%. Fed staff study this trade-off too, as the next section shows. Our guide to the FOMC meeting explains where the Fed sets rates.
After the peak: the 2022 debate and the 1.0 line
In July 2022 two groups read the Beveridge curve in opposite ways. The Peterson Institute policy brief by Blanchard, Domash and Summers argued that openings could not fall far without a clear rise in unemployment. Then a Federal Reserve Board FEDS Note by Andrew Figura and Chris Waller replied that a soft landing was plausible.
Our data shows what came next, though it does not settle the theory. Between March 2022 and September 2026 the openings rate fell from 7.5% to 4.5%. Over the same span the jobless rate went from 3.7% to 4.2%. Its low was 3.4% in April 2023 and its high 4.5% in November 2025.
This chart shows the same path as a ratio. The shaded areas are the 79 months with more openings than unemployed people. The long runs were March 2018 to February 2020 and May 2021 to February 2025. Short runs followed in May and June 2025 and from April 2026 on, plus one lone month in January 2018.
One path does not prove a model. Still, check it before you trust any rule that ties openings to joblessness. Our guide to hawkish versus dovish central banks shows how such debates turn into rate talk.
Download the complete indicator database
Put these concepts on your charts. One email unlocks the full library of 1,380+ indicators with compiled MT4 and MT5 files, plus my TradingView scripts. No paywall, no spam, unsubscribe any time.
Get free access to my indicator database
One email unlocks 1,380+ free MT4, MT5 and TradingView indicators — the complete library. No single-tool download; you get the whole database.
Where it fails
It is late. JOLTS describes a month that ended about five weeks before the release. By then, the jobs report for a later month is usually out.
It gets revised. Investopedia notes that JOLTS ties its job counts to the payroll survey each month and revises with it once a year. Its explainer, written from earlier data, gives a lower March 2022 peak than the 12.30 million in our pull. So never mix a first print with revised history.
An opening is not a hire. A post can sit open, get pulled, or go to someone who already has a job. In September 2026, hires were 5.40 million against 7.52 million openings.
New firms show up late. Investopedia also notes that a new business takes about a year to enter the list the BLS samples from. So fast-growing corners of the economy can lag in the count.
Gaps happen. Our unemployment series has no value for October 2025, so the ratio has a hole too. The Atlanta Fed’s Wage Growth Tracker page says the government shutdown stopped household survey collection that month.
The curve moves. A correlation of -0.59 means a shared trend, not a fixed formula. Since the 2020s loop sits above the 2000s line, a given level means something different now.
No market claim. We did not test price moves around JOLTS. Anyone who says the report lifts or sinks the dollar should show the release-day data first.
What openings miss: layoffs and the jobless rate
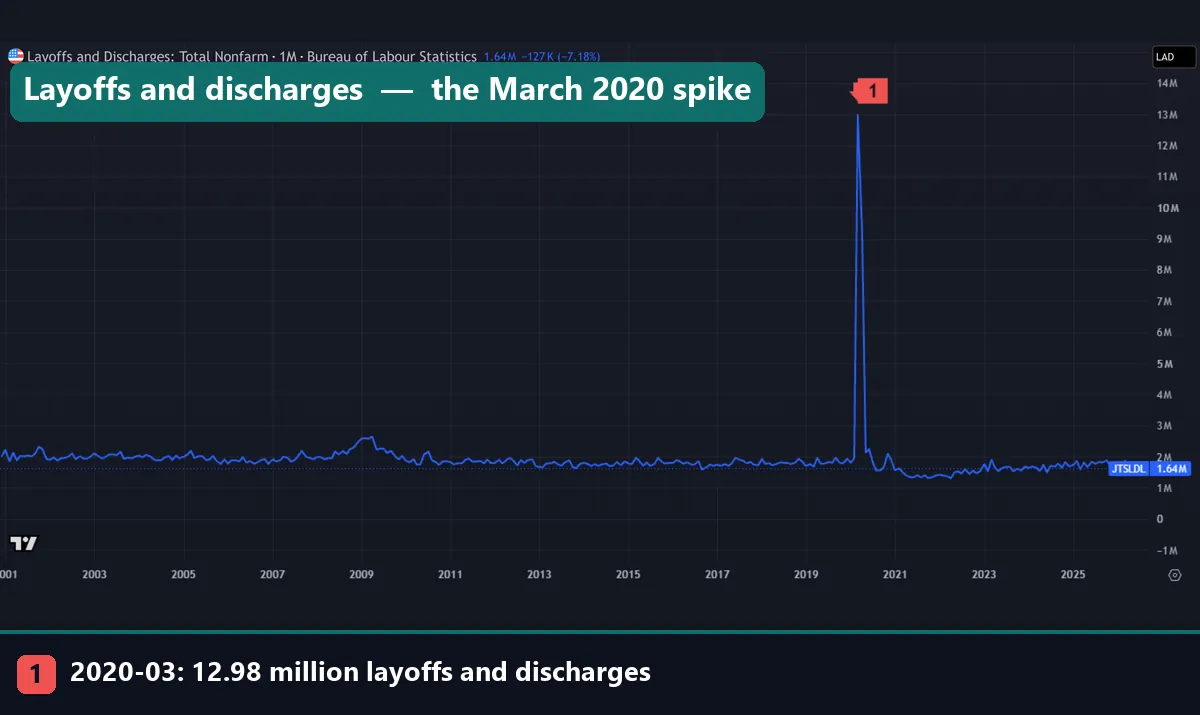
Openings show demand, but they say little about sudden job loss. Marker 1 is March 2020, when layoffs and discharges hit 12.98 million in one month. Yet openings in April 2020 were still 4.61 million. A trader who watched openings alone would have missed the scale of that shock.
Outside 2020, this line is nearly flat, and the 2008 to 2009 bump looks small beside the spike. In September 2026 it read 1.64 million. For a faster read on job losses, see our guide to initial jobless claims.
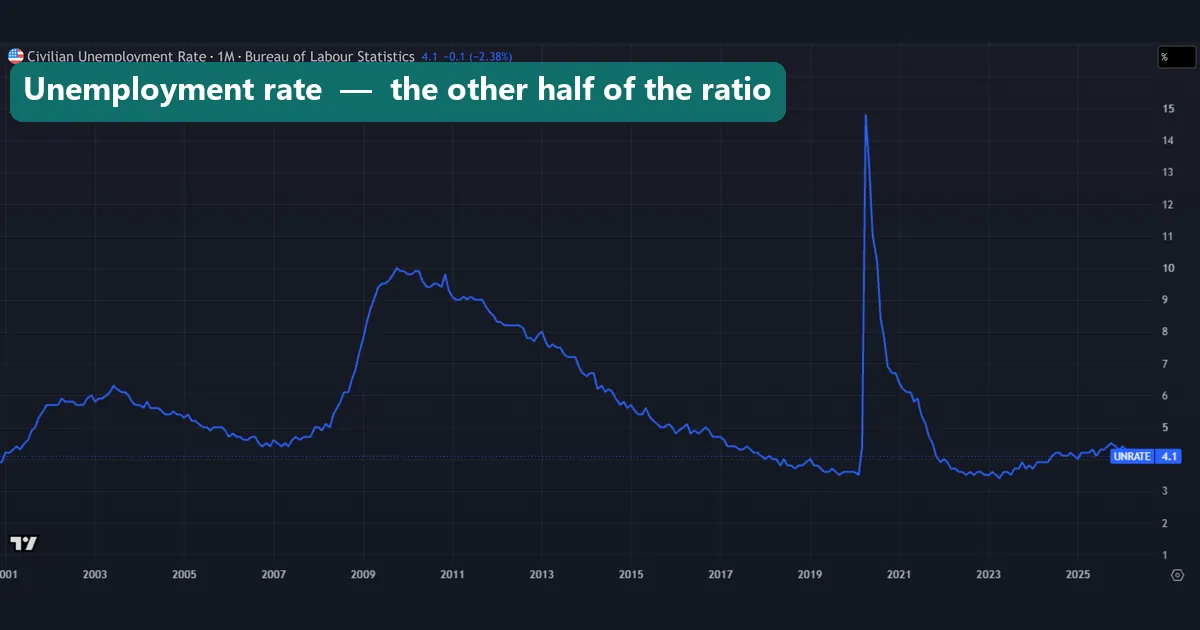
The unemployment rate is the other half of the ratio. In our data it peaked at 14.8% in April 2020 and at 10% in October 2009. The last value on this chart reads 4.1, one print newer than the 4.2% we use for September. That is the lag at work: the jobs report for a month arrives well before JOLTS covers it.
Four common mistakes
1. Reading the release month as the data month. A JOLTS report out in early November describes September. Line it up with the wrong month, and every comparison breaks.
2. Treating openings as jobs created. Openings are empty seats. Payroll growth counts people on the books. The two can move apart for months.
3. Judging the level alone. About 7.1 million openings meant 1.21 per unemployed person in January 2020. A year later, a similar level meant only 0.70. Check the rate and the ratio first.
4. Treating a 1.0 cross as a signal. The ratio crossed 1.0 several times in 2025 and 2026. We tested no trading rule on it, and a cross tells you about balance, not about price.
Where to go next
JOLTS works best as one piece of a wider labor picture. Start with which news releases count as high impact in forex. Then check our economic calendar and our list of forex news release times.
For mood and output, read our guides to University of Michigan consumer sentiment and gross national product. For policy, see how to read the Fed dot plot and what bond yields are. Outside our site, the four sources linked above go deeper, and the Atlanta Fed tracker splits wage growth for job switchers and stayers.
FAQ: JOLTS job openings
What does JOLTS stand for?
It stands for the Job Openings and Labor Turnover Survey, which the Bureau of Labor Statistics runs each month to count openings, hires and separations.
When does the JOLTS report come out?
About five weeks after the month it covers, so September data appears in early November; check an economic calendar for the exact day.
What counts as a job opening in JOLTS?
The position must exist with work to do, it could start within 30 days, and the employer must be recruiting from outside the firm at month end.
What is a high or low number of job openings?
No fixed line exists, so compare openings with unemployed people: the ratio was 0.15 in July 2009, 2.04 in March 2022 and 1.06 in September 2026.
Why does the quits rate matter?
People quit more when they feel sure of finding new work, so it tracks worker confidence; it peaked at 3.0% in November 2021 and bottomed at 1.2% in August 2009.
How is JOLTS different from the jobs report?
The jobs report counts people on payrolls and the jobless rate, while JOLTS counts open seats and job changes, and it arrives a month later.
Does JOLTS move EUR/USD?
We did not measure it, since we had no file of release dates, so we make no claim; treat any such rule as untested until you see release-day data.
Can I chart JOLTS job openings on TradingView?
Yes: type FRED:JTSJOL into the TradingView symbol search, set the chart to monthly, and try FRED:JTSJOL/FRED:UNEMPLOY for the ratio; use it as background only, because results are not guaranteed; past performance is not indicative of future results.
Last updated: 16 November 2026.

About the author
Written by Dominic Walsh, a Forex trader and MT4/MT5 indicator, Expert Advisor and script developer. Every tool on forexmt4systems.com is tested on live charts before release and ships with ready-to-use compiled MT4 (.ex4) and MT5 (.ex5) files. Learn more about the trader and developer behind this site.
How we build, test and correct every tool: Editorial & Testing Policy. Trading carries risk; see the disclaimer.