
The Liberian currency is the Liberian dollar, code LRD, and it shares its home market with the US dollar. Below, we answer three questions with daily quotes from May 2005 to November 2026. First, how much value it lost: from 57 Liberian dollars per US dollar to 169.06, a fall of 66.3%. Second, which big moves on a USD/LRD chart are real and which are holes in the data feed. Third, where to find the rate the central bank itself publishes.
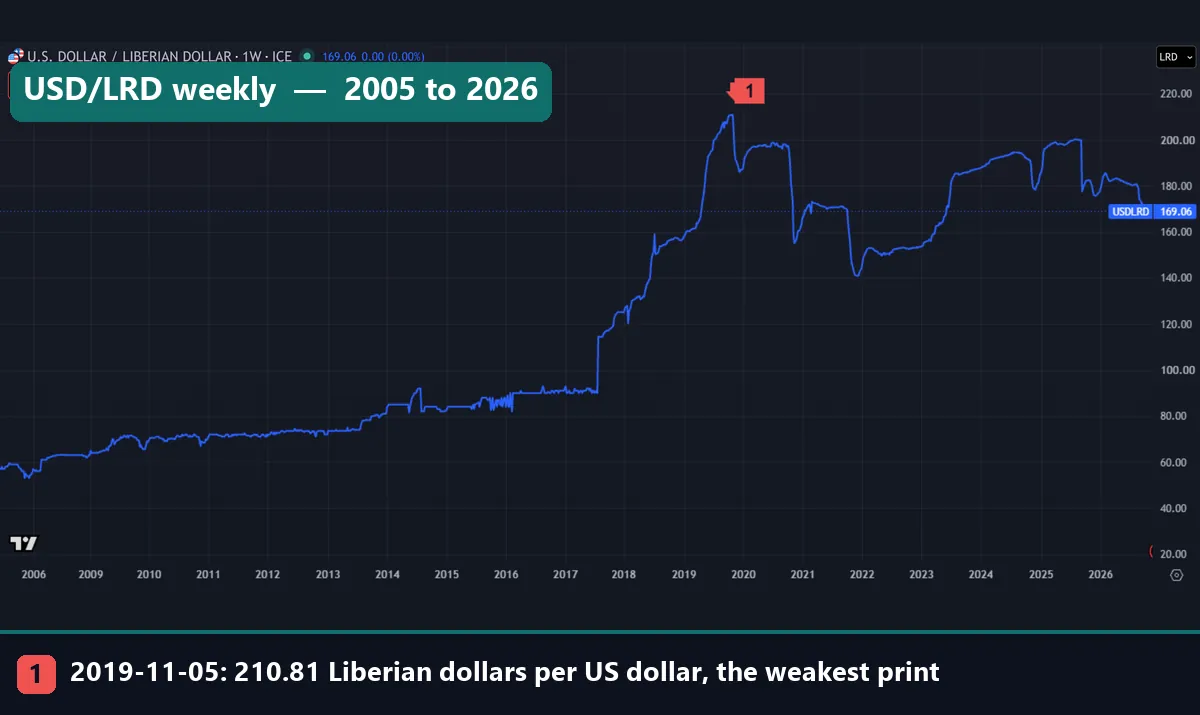
Marker 1 on the weekly chart is the weakest Liberian dollar in our data: 210.81 per US dollar on 5 November 2019. The vertical step in 2017 is a gap in the feed, which we cover below.
What the Liberian currency is
The Liberian dollar is the national money of Liberia, and the Central Bank of Liberia issues it. Its ISO code is LRD. The central bank writes its rates in the form L$ per US$1.00, so the L$ sign marks Liberian money.
But the Liberian dollar does not have the country to itself. The IMF working paper on dedollarization in Liberia traces a dual currency regime back to the founding of the state. In that regime, the US dollar holds legal tender status too. The same paper called the economy heavily dollarized when it came out. So the LRD trades against the very currency it shares the country with.
On a chart, the pair shows up as USD/LRD: the number of Liberian dollars that one US dollar buys. A rising line therefore means a weaker Liberian dollar. For the wider region, see our guide to African currencies, or compare a West African peer in our GHC currency guide.
How the USD/LRD rate is set and quoted
The US International Trade Administration’s Liberia trade financing guide on trade.gov describes a managed floating exchange rate system. It names both the Liberian and the US dollar as legal tender. The guide adds that the central bank requires commercial banks to display the official market exchange rates. In a managed float, the market sets the price, but the central bank can step in to slow or steer it.
Because the quote counts Liberian dollars per US dollar, the arithmetic runs backwards. For the change in the Liberian dollar’s value, divide the earlier rate by the later one and subtract 1.
LRD value change = earlier USD/LRD rate / later USD/LRD rate - 1
Over the whole feed, that gives 57 / 169.06 – 1 = -0.663, a loss of 66.3%. Now turn the question around. The dollar’s gain in Liberian dollars is 169.06 / 57 – 1, or about +197%. Both numbers describe the same move, seen from opposite sides of the pair.
How we tested
We read FX_IDC:USDLRD on the TradingView web chart, where the chart header names ICE as the source. TradingView’s USD/LRD symbol page lists the same pair. On 16 November 2026 we pulled daily, weekly and monthly bars. The 16 November bars had not closed yet, so we dropped them. Our final complete day is therefore Friday 13 November 2026. Each FX_IDC daily bar carries a 22:00 UTC stamp from the previous evening, and we shifted each one to the trading day it belongs to.
The daily window runs from 4 May 2005 to 13 November 2026, a total of 4,817 closes. First, we screened for bad prints: any close more than 5% away from the median of the 11 closes around it went out. That removed 12 prints, and ten of them fall between August 2015 and February 2016. Next, we measured year-end changes, flat stretches, repeated prints and every pause of more than five calendar days between two prints.
None of this is a trading test, so no spread, swap or commission enters any figure. Our editorial testing policy explains how we treat reference data like this. We drew the fourth and fifth images ourselves from those same bars. One more note: the price in each chart header and the SELL and BUY boxes reflect capture day, not the dates we discuss.
The USD/LRD feed in numbers
These are the settings of our test and the headline figures it produced. Every value comes from the same FX_IDC daily closes.
| Setting or measure | Value |
|---|---|
| Symbol and platform | FX_IDC:USDLRD on the TradingView web chart (header: ICE) |
| Bars | Daily for every figure; weekly and monthly for the long charts |
| Window | 4 May 2005 to 13 November 2026 |
| Daily closes used | 4,817, after dropping 12 bad prints |
| Bad-print screen | More than 5% from the median of the 11 closes around it |
| First and last close | 57 and 169.06 Liberian dollars per US dollar |
| Change in the Liberian dollar’s value | -66.3% |
| Weakest Liberian dollar | 210.81 on 5 November 2019 |
| Strongest Liberian dollar | 53 on 2 November 2005 |
| Median daily move (absolute) | 0.02% |
| Prints unchanged from the day before | 42.7% |
| Pauses of more than 5 days | 32; the longest ran 517 days, 21 April 2006 to 20 September 2007 |
| Longest flat stretch | 98 prints, 24 May to 6 October 2021, all from 169.72 to 171 |
Two rows need a warning. The strongest print, 53 on 2 November 2005, came straight after a 14-day pause in the feed. And the 517-day hole means the feed tells us nothing about most of 2006 and 2007, so we leave both years out of the yearly figures.
The August 2017 jump: the feed catching up
The daily chart for May to November 2017 shows this feed at its worst.
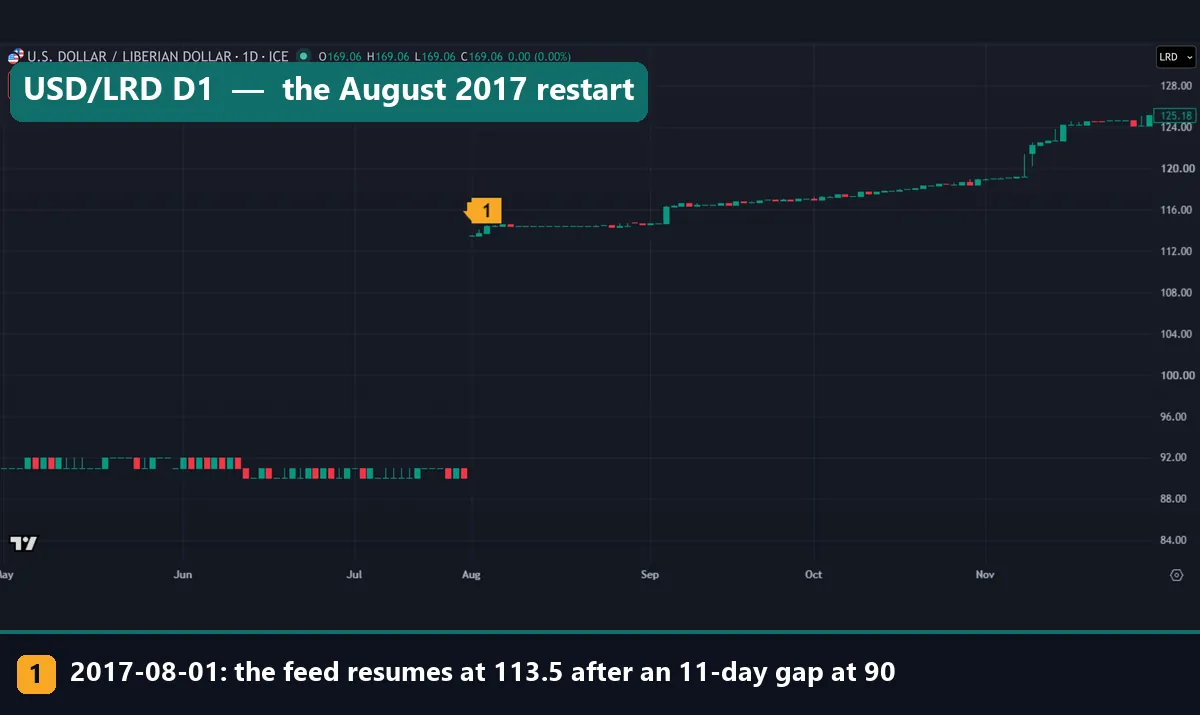
Through May, June and July, the candles sit in a tight band near 90 to 91. Then the bars stop. The last print before the break is 90, on 21 July 2017. The next one, marker 1, arrives on 1 August at 113.5.
On paper, that is a 26.1% rise in a single day. In fact, 11 calendar days passed between the two prints with nothing recorded. So read the jump as the feed catching up with a rate that moved while no quotes came through. It is not a one-day crash, and the chart shows no price at which anyone dealt in between.
After the restart, the line climbs in small steps to about 125 by late November. The year closed at 125.17, which makes 2017 the worst calendar year in our data: the Liberian dollar lost 27.3%.
From 2019 to 2021: the weakest print, then two good years
The second daily chart covers January 2019 to December 2021.
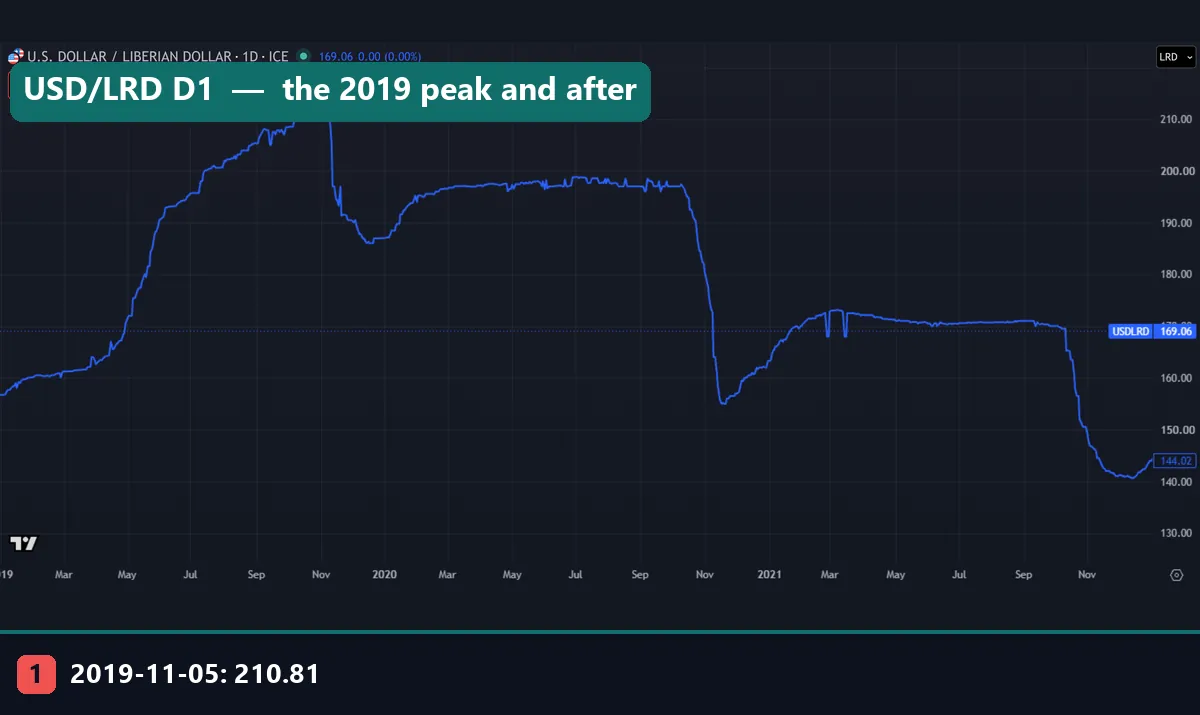
It opens near 157 and climbs almost without a pause. Marker 1 is the top: 210.81 on 5 November 2019, the weakest the Liberian dollar has been in this feed. Then the line turns. By the end of December the rate stood at 186.99. Through most of 2020 it held near 197 to 198, before a sharp fall in November toward 155.
Across 2020 the Liberian dollar gained 14.5%, closing the year at 163.3. In 2021 it gained another 13.4% and ended at 144.02. Those are the first yearly gains in our data.
Also notice the flat shelf from May to October 2021. That is the 98-print stretch from our table, with every close from 169.72 to 171. From the feed alone, we cannot tell whether the market really sat that still or the quotes simply went stale.
Worked example: 5,000 Liberian dollars from 2022 to 2026
Here is the arithmetic on real closes. Suppose someone held 5,000 Liberian dollars at the end of 2022 and wanted to know their worth in US dollars each year. Divide the amount by the year-end rate.
- End of 2022: 5,000 / 153.4 = 32.59 US dollars.
- End of 2023: 5,000 / 187.61 = 26.65 US dollars, a loss of 18.2% in one year.
- End of 2024: 5,000 / 183.56 = 27.24 US dollars, a gain of 2.2%.
- End of 2025: 5,000 / 177.36 = 28.19 US dollars, a gain of 3.5%.
- 13 November 2026: 5,000 / 169.06 = 29.58 US dollars, a gain of 4.9% so far this year.
Check the first step with the formula from earlier: 153.4 / 187.61 – 1 = -0.182. The answer matches, because the amount cancels out. Even after three better years, 5,000 Liberian dollars buy 29.58 US dollars, still less than the 32.59 of late 2022. Small yearly gains do not undo one bad year of 18.2%. Our currency converter does this division for other pairs, but for a real LRD payment, use the central bank’s published rate.
The yearly picture in one data chart
The first data chart sets the whole line next to its yearly changes.
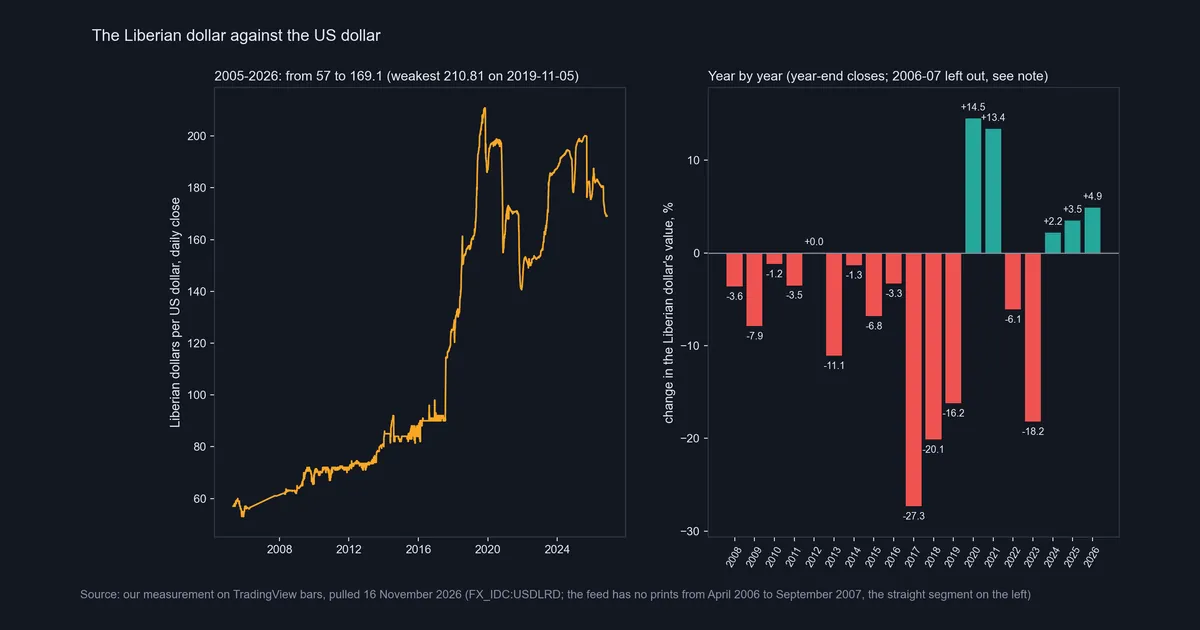
On the left, the line runs from 57 to 169.1, with the weakest close of 210.81 on 5 November 2019. The straight segment on the far left is the feed’s silence from April 2006 to September 2007. With nothing to plot, the line just joins the dots.
The right panel shows year-end changes in the Liberian dollar’s value, with 2006 and 2007 left out. Of its 19 bars, 13 show a loss, 2012 is flat, and five show a gain, counting the unfinished 2026. The worst run is 2017 to 2019: -27.3%, -20.1% and -16.2% in a row. Over those three years the rate went from 91 to 186.99, roughly a doubling.
What the feed chart says about data quality
The second data chart tracks the feed, not the currency.
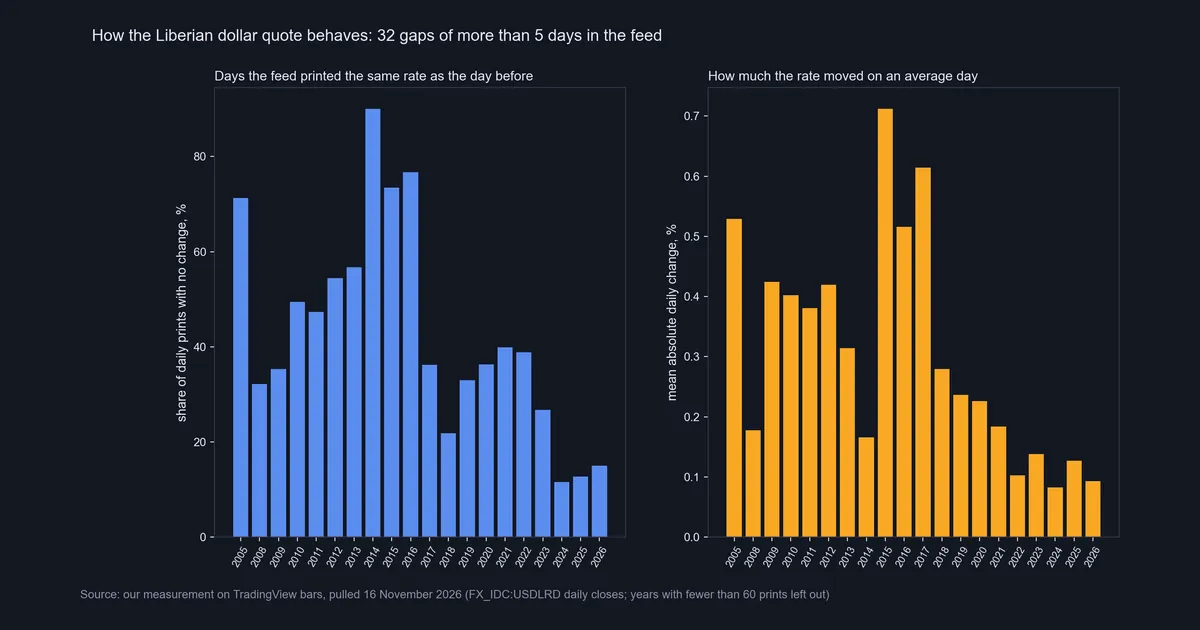
Its title counts 32 gaps of more than 5 days. The left panel shows how often a daily print matched the one before. In 2014, close to nine prints in ten repeat the previous close. From 2024 to 2026, only about one print in seven or eight does. The right panel shows the average size of a daily move. It peaks in 2015 at about 0.7%, and recent years sit near 0.1%. The chart skips years with fewer than 60 prints, so 2006 and 2007 do not appear.
Read the two panels together and 2015 stands out: about three prints in four repeat the day before, yet the average move is the largest of any year. In other words, the feed sat still, then lurched.
Download the complete indicator database
Put these concepts on your charts. One email unlocks the full library of 1,380+ indicators with compiled MT4 and MT5 files, plus my TradingView scripts. No paywall, no spam, unsubscribe any time.
Get free access to my indicator database
One email unlocks 1,380+ free MT4, MT5 and TradingView indicators — the complete library. No single-tool download; you get the whole database.
Where it fails
Our numbers describe one vendor’s feed, and that feed has clear weak spots.
- The feed is not the official rate. FX_IDC shows where a data vendor’s quote sat. The central bank posts its own market buying and selling rates on the Central Bank of Liberia’s daily exchange rates page, and the two need not match on any given day.
- Pauses turn into fake jumps. The feed has 32 pauses of more than five days. The 26.1% “day” in August 2017 and the strongest print of 53 in November 2005 both come right after one.
- Repeated prints hide the market. Exactly 85 for 83 prints in 2014, or exactly 90 for 90 prints in 2016, may mean a calm market or a quote nobody refreshed. The data cannot say which.
- Single prints set the extremes. On 4 August 2014 the feed went from 92 to 82 in one print. Check any high or low against the central bank’s table.
- Year-end figures hide the path. The Liberian dollar gained 3.5% across 2025, yet the rate touched about 200 in August before the September drop.
- No causes in the numbers. The feed gives a size and a date, never a reason, so we name no cause for any move here.
September 2025 and the long monthly view
The daily chart for April to December 2025 shows the largest recent move between two prints.
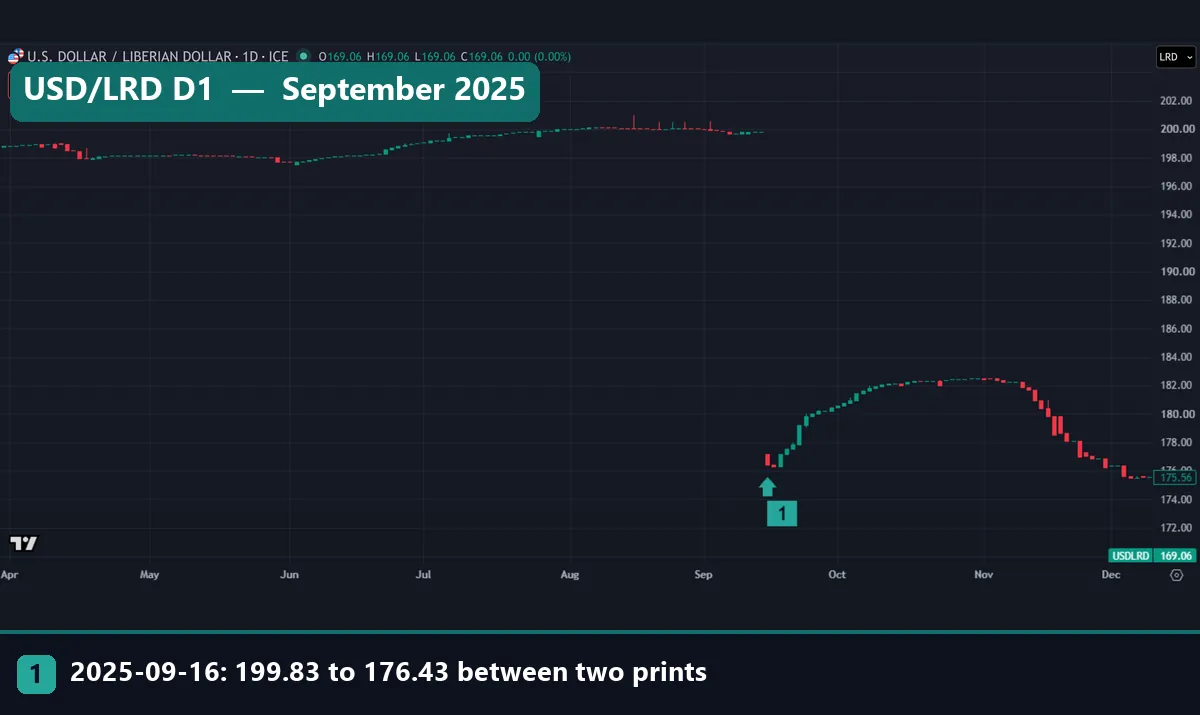
Through spring and summer, the rate drifts from about 198 to 200. Then comes marker 1. The print before 16 September reads 199.83, and the 16 September print reads 176.43. That is an 11.7% fall in the rate. For the Liberian dollar it means a gain: 199.83 / 176.43 – 1 = 0.133, or 13.3%.
Unlike August 2017, this move does not follow a pause of more than five days. Even so, confirm it in the central bank’s table first. After the drop, the rate climbs back to about 182 in October and slides to about 175.6 by early December.
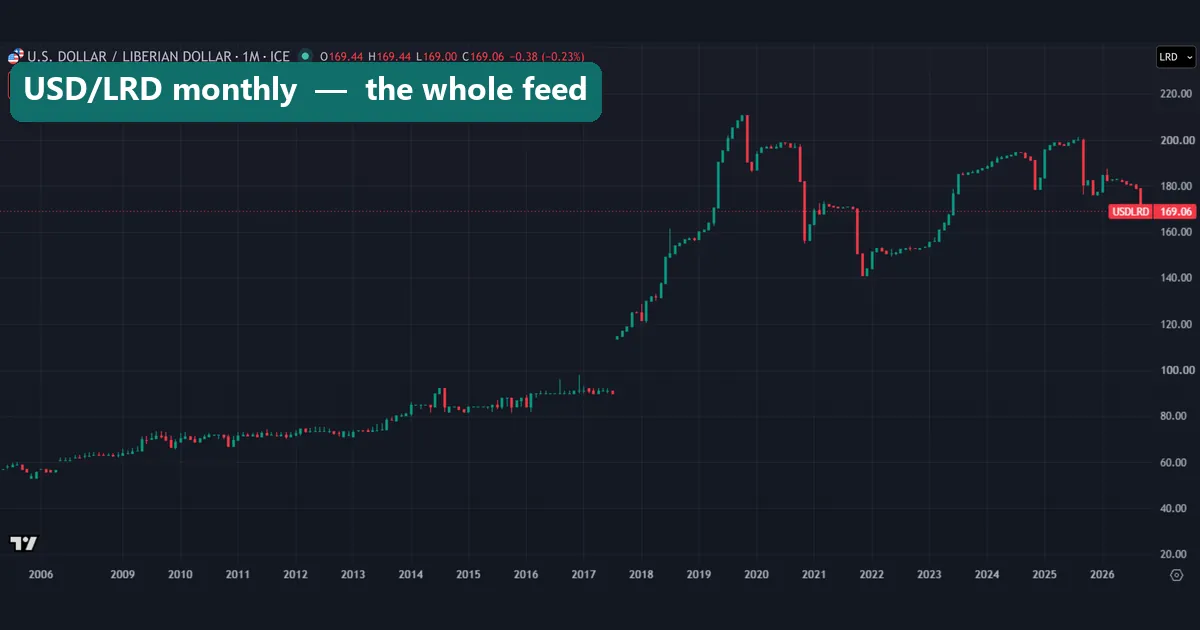
The monthly chart packs 21 years into one view, and two things stand out. First, the gap of mid-2017, where the candles jump from about 91 to about 113 with nothing in between. Second, the time axis: the label for 2006 sits close to 2009, because the chart drops months with no data instead of leaving a blank. So a monthly view hides how long the feed went quiet.
Four mistakes people make with USD/LRD
- Reading the quote upside down. A rising USD/LRD line means a weaker Liberian dollar. The 11.7% fall in the rate in September 2025 was a 13.3% gain for the LRD.
- Calling a pause a crash. The August 2017 jump covers 11 silent days. Treat any big one-print move as suspect until you see what came before it.
- Using the vendor line for a real payment. For an actual conversion, use the central bank’s daily rates. The FX_IDC line suits the long-run shape, not a figure on an invoice.
- Mixing directions in comparisons. “The dollar rose about 197%” and “the Liberian dollar lost 66.3%” describe the same move. When you rank it against other money in our weakest currency in the world guide or our most valuable currency in the world list, keep one direction.
Where to read more
Our guide to the Egyptian pound follows a currency whose chart rises in sudden steps. The Honduras lempira shows a slow, managed slide against the dollar. And San Salvador money covers a country where the US dollar is the everyday legal money.
For the forces behind long declines, read how inflation affects forex and what the M2 money supply measures. For chart work, our guide to line charts in forex helps with long series like this one. Also, our TradingView real-time data guide shows how to tell a live feed from a delayed one.
Outside our site, start with the four sources linked above: the IMF paper, the trade.gov guide, the central bank’s daily table and TradingView’s symbol page.
FAQ on the Liberian currency
What is the Liberian currency called?
The money is the Liberian dollar (LRD), and the Central Bank of Liberia issues it. The US dollar also has legal tender status, as the IMF paper linked above explains, so the two circulate side by side.
How many Liberian dollars make one US dollar?
On 13 November 2026, the FX_IDC feed closed at 169.06 Liberian dollars per US dollar. For an actual exchange, use the central bank’s daily buying and selling rates instead.
How much value has the Liberian dollar lost?
From 4 May 2005 to 13 November 2026, the rate went from 57 to 169.06. So the Liberian dollar lost 66.3% of its value against the US dollar.
When was the Liberian dollar at its weakest?
In our feed, the low point came on 5 November 2019, at 210.81 per US dollar. It then gained 14.5% in 2020 and 13.4% in 2021.
Did the Liberian dollar fall 26% in one day in 2017?
No. The feed printed 90 on 21 July 2017 and then nothing until 113.5 on 1 August. The 26.1% jump spans 11 days with no quotes, so it shows the feed catching up, not a one-day collapse.
Why does the USD/LRD chart stay flat for weeks?
The feed often repeats itself: 42.7% of daily closes match the day before. A flat line can mean a quiet market or a stale quote, and the chart alone cannot tell them apart.
Has the Liberian dollar gained value lately?
Yes, in our data. It gained 2.2% in 2024, 3.5% in 2025 and 4.9% in 2026 up to 13 November. Even so, 169.06 per US dollar leaves it far weaker than the 57 of May 2005.
Can these charts tell me where USD/LRD goes next?
No. They describe a reference feed with gaps and stale stretches, not a tradable price, and past moves do not set the next one. Use them as history and context: results are not guaranteed; past performance is not indicative of future results.
Last updated: 16 November 2026.

About the author
Written by Dominic Walsh, a Forex trader and MT4/MT5 indicator, Expert Advisor and script developer. Every tool on forexmt4systems.com is tested on live charts before release and ships with ready-to-use compiled MT4 (.ex4) and MT5 (.ex5) files. Learn more about the trader and developer behind this site.
How we build, test and correct every tool: Editorial & Testing Policy. Trading carries risk; see the disclaimer.