
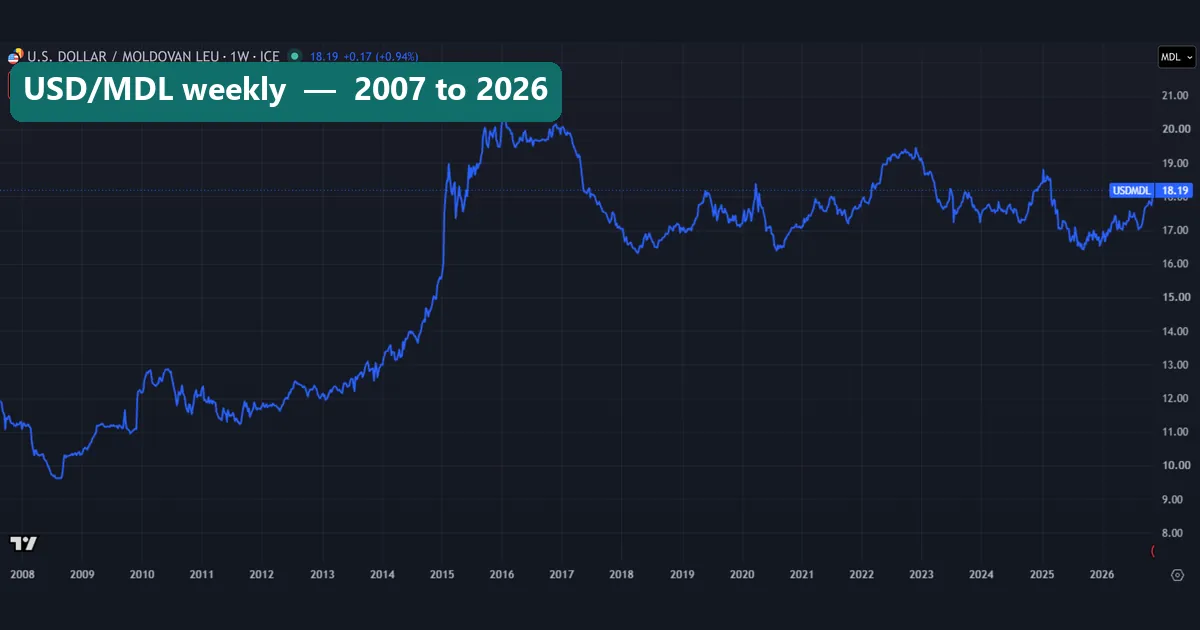
The Moldova leu, or Moldovan leu (code MDL), is the money of the Republic of Moldova. This guide settles what it has done against the dollar and the euro since 2007, using our own measurements. We read 4,999 daily USD/MDL closes from 10 August 2007 to 16 November 2026. Over that span the rate rose from 11.91 to 18.02 lei per dollar, so the leu lost 33.9% of its dollar value. Against the euro it lost far less. Below we show when the damage happened, what the IMF says caused the worst of it, and where a chart quote can mislead you.
What the Moldova leu is
The Moldovan leu entry on Wikipedia gives the basics. Moldova set up the leu on 29 November 1993, after the Soviet ruble fell apart. It replaced the temporary cupon and the Russian ruble at 1,000 to one leu. One leu splits into 100 bani, and the plural of leu is lei.
The National Bank of Moldova issues the leu. Transnistria, the breakaway region, is an exception: it uses its own Transnistrian ruble. Also, do not mix the leu up with Romania’s leu. That is a separate currency, with the code RON.
Like most money today, the leu is a fiat currency, so its worth rests on policy and trust rather than metal. Our weekly chart above shows how that worth moved. The line starts near 11.9 in 2007 and dips to a low in 2008. Then it climbs hard through 2014 and 2015 and peaks in early 2016. Since 2018 every close has sat between 16.288 and 19.455.
How the leu is quoted and measured
Most screens quote the pair as USD/MDL: the number of lei one dollar buys. So when the line rises, the leu has lost ground. That trips up many readers, because a rising chart looks like good news.
A rate change and a currency change also differ in size. To turn a rate move into the leu’s change in value, divide the old rate by the new one:
leu value change = old USD/MDL / new USD/MDL - 1
example: 11.91 / 18.02 - 1 = -33.9%
Over the same span, the rate itself rose 51.3%. Both figures are correct, but only the first tells you what a leu holder lost. In addition, EUR/MDL ties back to the dollar through a cross:
EUR/MDL = EUR/USD x USD/MDLThat link explains how the leu can fall against one currency and hold against another. When the dollar gains on the euro, USD/MDL can climb while EUR/MDL barely moves.
There is also an official rate. The National Bank of Moldova’s official exchange rates page lists rates by date, and it states that they serve accounting purposes only. Our numbers come from a data vendor’s feed, not from that list.
How we tested
We pulled daily bars for FX_IDC:USDMDL and FX_IDC:EURMDL on the TradingView web chart on 16 and 17 November 2026. The 17 November bars had not closed yet, so they stay out of our file. That left 4,999 USD/MDL closes from 10 August 2007 to 16 November 2026, and the EUR/MDL file spans the same dates. The chart header names ICE as the source of these quotes.
Next, we checked the feed. Our bad-print filter removed nothing from this series. We found two gaps of more than five calendar days: 14 August to 14 September 2007, and 28 April to 4 May 2023. On 12.5% of days the close did not change at all.
Then we built the yearly figures from the last close of each year, and the daily moves from close to close. No trading test took place, so spreads and fees play no part in our figures. Our editorial testing policy sets out how we treat vendor data like this.
The leu’s numbers at a glance
| Item | Figure | Source |
|---|---|---|
| ISO code | MDL (numeric 498) | Wikipedia |
| Smaller unit | 100 bani to the leu | Wikipedia |
| In use since | 29 November 1993 | Wikipedia |
| USD/MDL, 10 August 2007 | 11.91 | Our bars |
| USD/MDL, 16 November 2026 | 18.02 | Our bars |
| Strongest leu close | 9.57 (11 August 2008) | Our bars |
| Weakest leu close | 20.525 (26 January 2016) | Our bars |
| EUR/MDL, first and last | 16.334 and 19.862 | Our bars |
| Median daily move | 0.17% vs USD, 0.39% vs EUR | Our bars |
| Days with no change | 12.5% | Our bars |
| Largest one-print move | +5.37% (19 January 2015) | Our bars |
A currency has no inputs to tune, so this table holds facts rather than settings. What you do choose is the pair, the bar size and the data source, and each choice changes the picture.
Reading the 2014 to 2015 slide on a daily chart
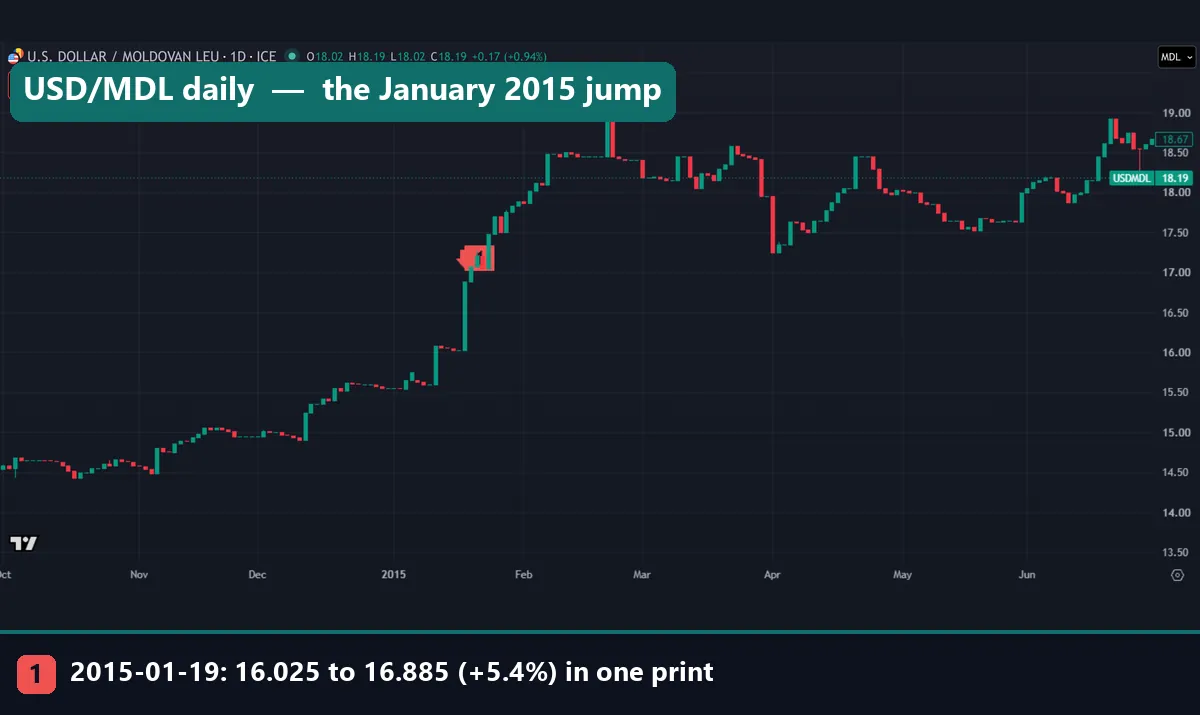
This daily chart runs from October 2014 to June 2015. In October and November the bars drift between about 14.4 and 15.1. Then the climb speeds up. In mid-December the rate steps higher, and by early January it sits near 15.6. Later in January it jumps again.
Marker 1 is 19 January 2015, the largest single print in our file. The close went from 16.025 to 16.885, up 5.37% in one step. For a leu holder, that was a loss of about 5.1%. The move did not end there. By early February the bars sat near 18.5, and in late February one spike reached about 19.0.
After that the rate settled into a range. On 1 April it fell from 17.95 to 17.25, a drop of 3.9% that shows as the tall red bar. By late June it stood back above 18.5. Across the two years, the leu lost 16.7% against the dollar in 2014 and 20.8% in 2015.
What drove the fall: the 2014 bank fraud
The IMF’s 2016 staff report on Moldova, IMF Country Report No. 16/343 on the IMF eLibrary, names the main shock. It describes a large, well-planned fraud in the banking system that came to light from late 2014. Three banks closed, at a public cost of 10 percent of GDP. The report adds that confidence collapsed, reserves fell by one third and monetary conditions tightened sharply.
A National Bank of Moldova statement of 25 March 2016, on its Kroll inquiry, names the three lenders: Banca de Economii, Banca Sociala and Unibank. Our data fits that timeline, but only in part. The leu was already weakening before the fraud surfaced: it ended 2013 at 12.955 per dollar, down 6.9% on the year. Still, the steepest prints came later, in January 2015.
So a chart shows when the price moved, and a source such as the IMF tells you why. Our guides on how interest rates affect forex and how inflation affects forex cover the usual links between policy and a currency.
The euro side: EUR/MDL over the last year
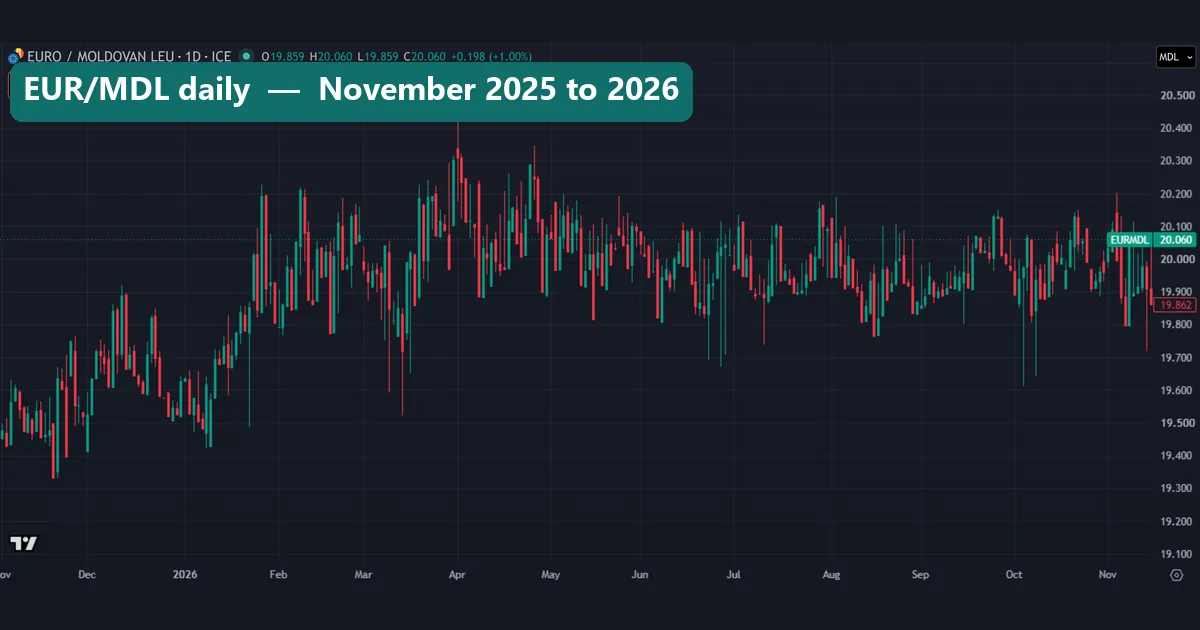
This daily chart covers EUR/MDL from November 2025 to mid-November 2026. Late in 2025 the bars sit mostly between 19.35 and 19.9. From February 2026 they move into a band of roughly 19.7 to 20.2, with a spike near 20.4 at the start of April. Our last close is 19.862, the red figure on the price scale. The 20.060 in the header belongs to the 17 November bar, which was still forming.
Notice how much busier this chart looks than a dollar chart of the leu. Its median daily move was 0.39%, against 0.17% for USD/MDL. We did not test why. One plausible reading is the cross itself: EUR/MDL carries the daily EUR/USD swing on top of the leu’s own move.
Over the long run, the euro story is milder. EUR/MDL rose from 16.334 to 19.862, so the leu lost 17.8% against the euro, about half its dollar loss. Our guide on whether the euro is stronger than the dollar covers the EUR/USD side of that gap.
Worked example: 1,000 lei through the record
- On 10 August 2007, USD/MDL closed at 11.91. So 1,000 lei bought 1,000 / 11.91 = 83.96 dollars.
- On 16 November 2026 it closed at 18.02. The same 1,000 lei bought 1,000 / 18.02 = 55.49 dollars.
- Divide the two: 55.49 / 83.96 = 0.661. That is the 33.9% loss, seen from a wallet.
- Against the euro: 1,000 / 16.334 = 61.22 euros then, and 1,000 / 19.862 = 50.35 euros now. The loss is 17.8%.
- Check the cross: 19.862 / 18.02 = 1.102, the EUR/USD rate our two closes imply for 16 November.
Now take the worst stretch. At the end of 2013 the rate stood at 12.955, and at the end of 2015 it stood at 19.65. So 1,000 lei fell from 77.19 dollars to 50.89 dollars in two years, a loss of 34.1%. In other words, those two years account for slightly more than the whole loss since 2007. Since the end of 2015, the leu has won back about 9% against the dollar.
Finally, the single worst print. On 19 January 2015, 1,000 lei went from 62.40 dollars to 59.22 dollars. Our currency converter runs the same division for any pair you need.
What our two data charts show
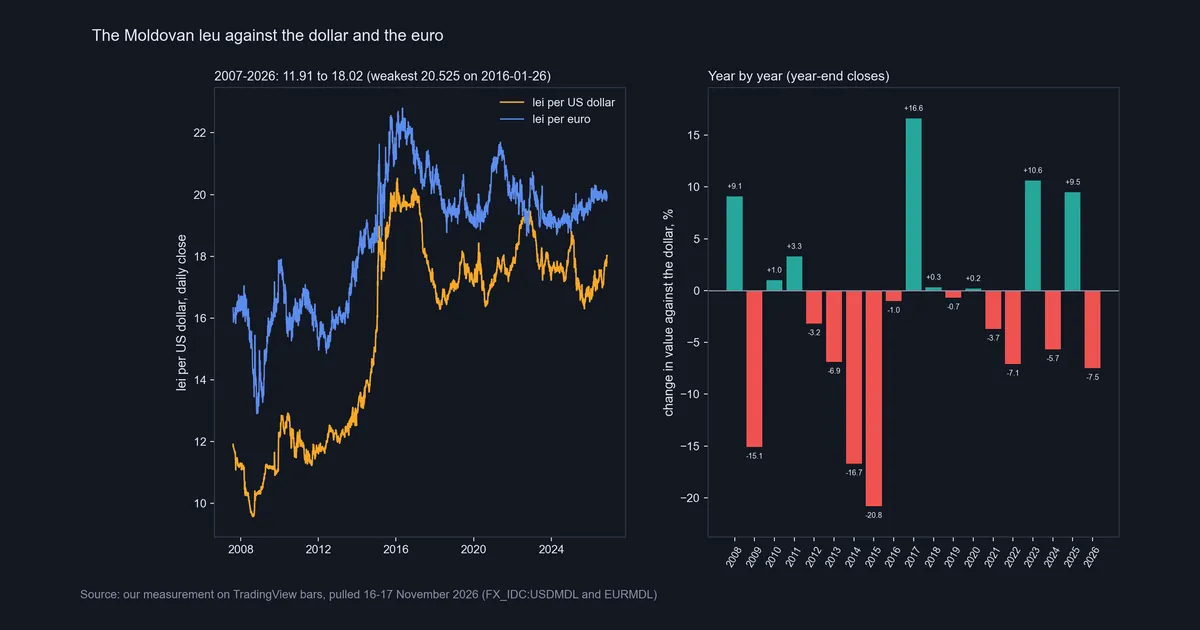
On the left, both lines share one scale. The orange line, lei per dollar, sits below the blue line, lei per euro, for almost the whole period. The exception comes in late 2022, when the lines touch and briefly cross. For those weeks a euro bought fewer lei than a dollar, so EUR/USD sat below 1. They nearly meet again in early 2025.
On the right sit the leu’s yearly changes against the dollar, from year-end closes. In 18 full years from 2008 to 2025, the leu gained in 8 and lost in 10. Its two worst bars are 2014 (-16.7%) and 2015 (-20.8%). The best is 2017, a gain of 16.6%, after a 2016 spent near its weakest level.
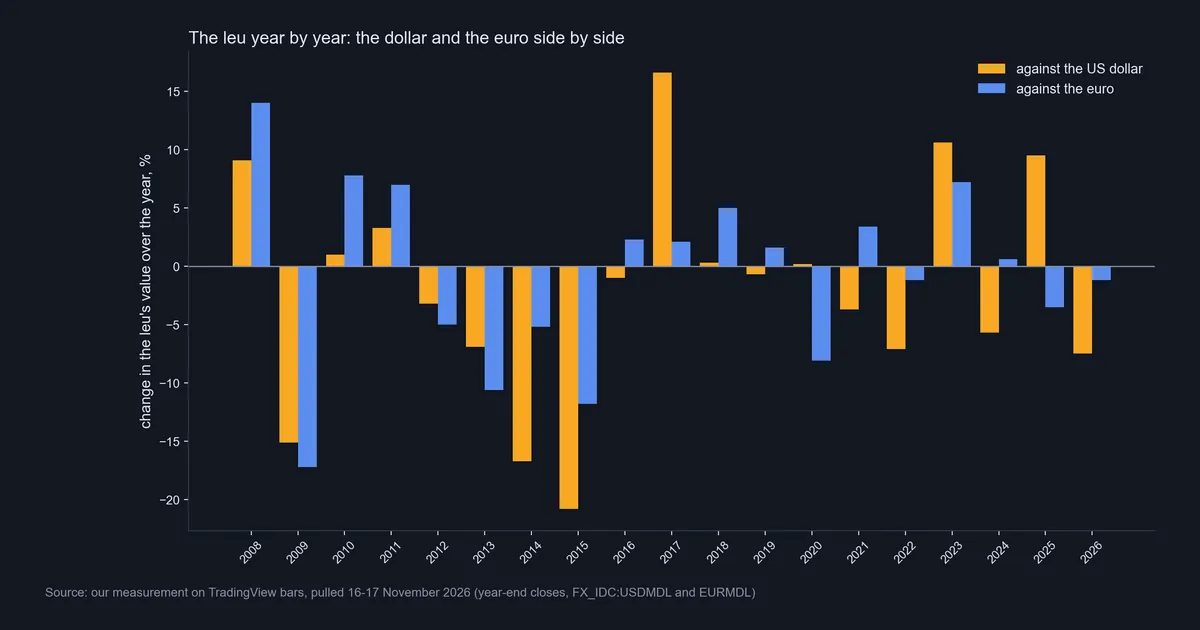
The second chart sets the dollar and euro bars side by side. They often point the same way, but not always. In 2025 the leu gained 9.5% on the dollar yet lost 3.5% on the euro. Against the euro, full years split 10 gains to 8 losses, the reverse of the dollar count.
Download the complete indicator database
Put these concepts on your charts. One email unlocks the full library of 1,380+ indicators with compiled MT4 and MT5 files, plus my TradingView scripts. No paywall, no spam, unsubscribe any time.
Get free access to my indicator database
One email unlocks 1,380+ free MT4, MT5 and TradingView indicators — the complete library. No single-tool download; you get the whole database.
Where it fails
Our rates are a vendor’s quotes, not the National Bank of Moldova’s official rates. The two can differ, and for tax, accounting or a contract the official figure is the one that counts. So use the central bank’s page for those jobs, and treat our numbers as a record of the feed.
The feed also has holes. Our file opens with a 31-day gap, from 14 August to 14 September 2007, and the rate fell 1.86% across it. That bar shows the feed catching up, not a one-day move. Our guide to types of gaps in forex covers gaps that come from trading; this one comes from missing data.
Some single prints look wrong. On 22 November 2013 the close dropped from 12.96 to 12.515, and on the next print it jumped to 13.00. A 3.4% fall and a 3.9% rise back to back look more like one stray quote than two real moves. Our filter kept it, so it still sits in our daily figures.
Yearly bars rest on one print each, so a stale year-end close shifts two bars. Also, the quote on screen is not a dealing price. The header of our USD/MDL captures showed a sell of 18.19 and a buy of 18.29. That gap of 0.10 lei is about 0.55% of the rate, over three times the median daily move. Our guide to the spread in forex explains what such a gap costs.
The past year, and the monthly bars
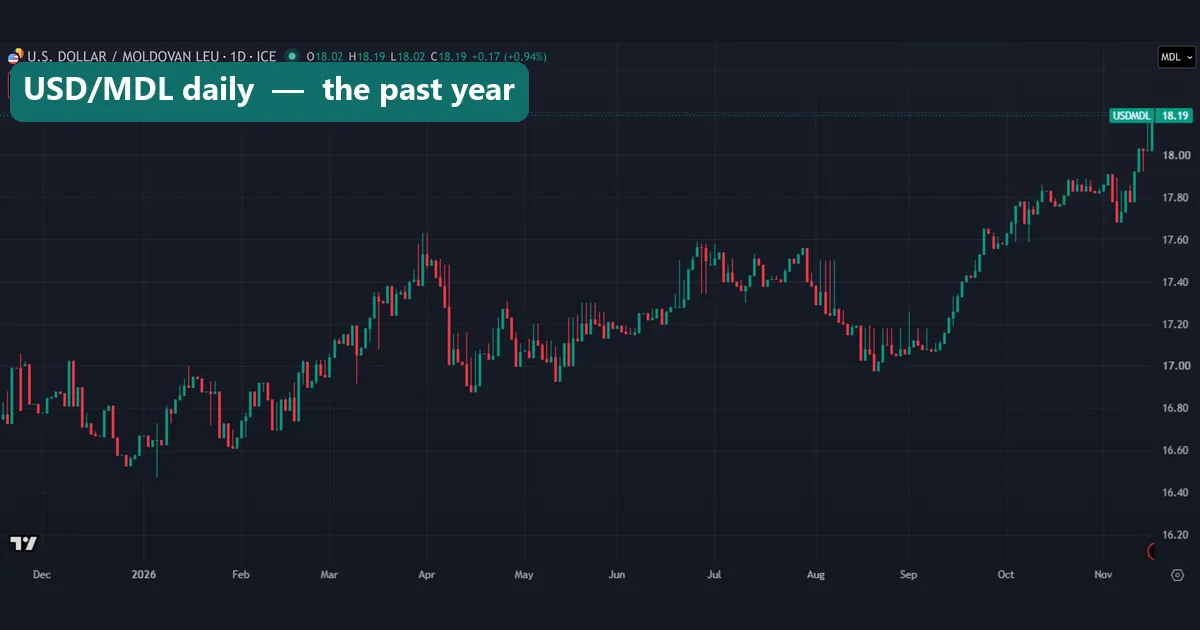
This daily USD/MDL chart runs from late November 2025 to mid-November 2026. The rate dipped near 16.6 at the turn of the year and again in late January. It then climbed to about 17.6 by the end of March, and in April it fell back to about 16.9. From September the bars rise almost without a pause.
So far in 2026 the leu has lost 7.5% against the dollar, from 16.67 at the end of 2025, but only 1.2% against the euro. Most of this year’s move reflects a firmer dollar: the cross implied by our closes fell from 1.178 to 1.102. Note that the header’s 18.19 belongs to the forming 17 November bar, so it is not in our numbers.
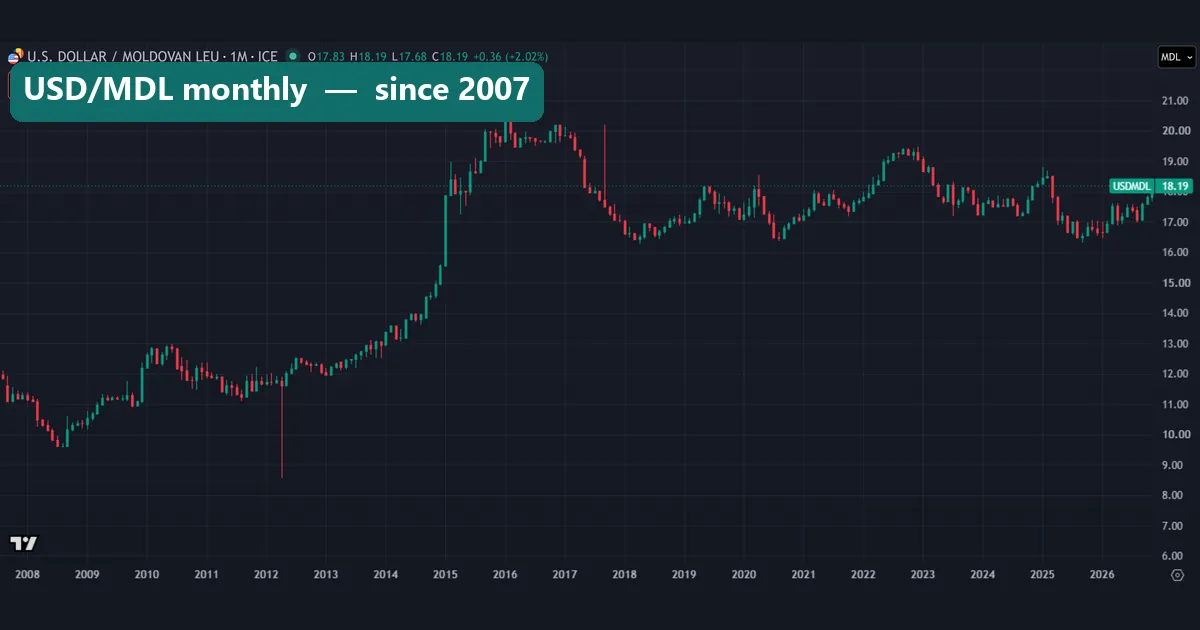
The monthly chart tells the same long story in fewer bars, but its wicks need care. An early 2012 candle carries a long lower wick below 9.00, under even the 2008 low. Yet every daily close in 2012 sat between 11.607 and 12.53. Monthly highs and lows keep stray ticks that closes leave out, which is why we measure on closes.
Common mistakes with the leu
Reading a rising USD/MDL line as a stronger leu. The pair counts lei per dollar, so a climb means each leu buys fewer dollars.
Quoting the rate change as the leu’s loss. The rate rose 51.3% from 2007 to 2026, but the leu lost 33.9%. Divide old by new to get the second figure.
Judging the leu by the dollar alone. Against the euro the loss was 17.8%, and in 2025 the two pairs went opposite ways. A currency tied to the euro, like the lev in our BGN currency guide, barely moves against it. The leu has no such tie on our chart.
Treating every tall bar or wick as news. The 2007 gap, the November 2013 print pair and the 2012 monthly wick all look like feed problems, not market events. Check the prints around a big bar before you hunt for a cause.
Where to go next
For other currencies with a turbulent past, read our guides to the Egyptian pound and the Latvian currency, the lats that gave way to the euro in 2014. To place the leu on a world scale, compare the weakest currency in the world with the most valuable currency in the world.
On method, our guide to line charts in forex explains why closes tell a cleaner story. You can open the same pair on TradingView’s USD/MDL symbol page. For official figures, return to the central bank’s rates page, and for the 2014 crisis, start with the IMF report linked above.
FAQ about the Moldova leu
What code and subunit does the Moldovan leu use?
Its ISO code is MDL. One leu splits into 100 bani, and the plural of leu is lei.
Is the Moldovan leu the same as the Romanian leu?
No. They share a name but not a currency. Romania’s leu carries the code RON, while the National Bank of Moldova issues the MDL.
How many lei does one US dollar buy?
Our last full close was 18.02 lei per dollar on 16 November 2026. For an official figure on a given date, use the National Bank of Moldova’s rates page.
When was the leu at its weakest against the dollar?
The weakest close in our file was 20.525 lei per dollar on 26 January 2016. The strongest was 9.57 on 11 August 2008.
Why did the leu fall so hard in 2014 and 2015?
The IMF points to a large fraud in the banking system that closed three banks from late 2014. In our data the leu lost 16.7% against the dollar in 2014 and 20.8% in 2015.
Has the leu held up better against the euro?
Yes, over our window. Between August 2007 and November 2026 it lost 17.8% against the euro and 33.9% against the dollar.
How much does USD/MDL move on a normal day?
The median daily move was 0.17%, about three hundredths of a leu at the current rate, and on 12.5% of days the close did not change.
Can the chart tell me where the leu goes next?
No chart can do that. Against the dollar the leu gained in 8 of 18 full years and lost in 10, with no fixed rhythm. Read the record as history only: results are not guaranteed; past performance is not indicative of future results.
Last updated: 17 November 2026.

About the author
Written by Dominic Walsh, a Forex trader and MT4/MT5 indicator, Expert Advisor and script developer. Every tool on forexmt4systems.com is tested on live charts before release and ships with ready-to-use compiled MT4 (.ex4) and MT5 (.ex5) files. Learn more about the trader and developer behind this site.
How we build, test and correct every tool: Editorial & Testing Policy. Trading carries risk; see the disclaimer.