
A quadruple top is a chart pattern with four highs at about the same price. It completes when price closes below the lowest point between those highs. This guide shows how to spot one, where the neckline and target sit, and what our scan of eight years of daily forex data found. In short, four equal highs are rare, most of our examples never broke, and the samples are too small for firm rules.
What a quadruple top is
A quadruple top has four peaks near one price and three dips between them. The lowest of those dips is the neckline. The pattern only counts as complete when a candle closes below that line. Until then, it is a range with a ceiling.
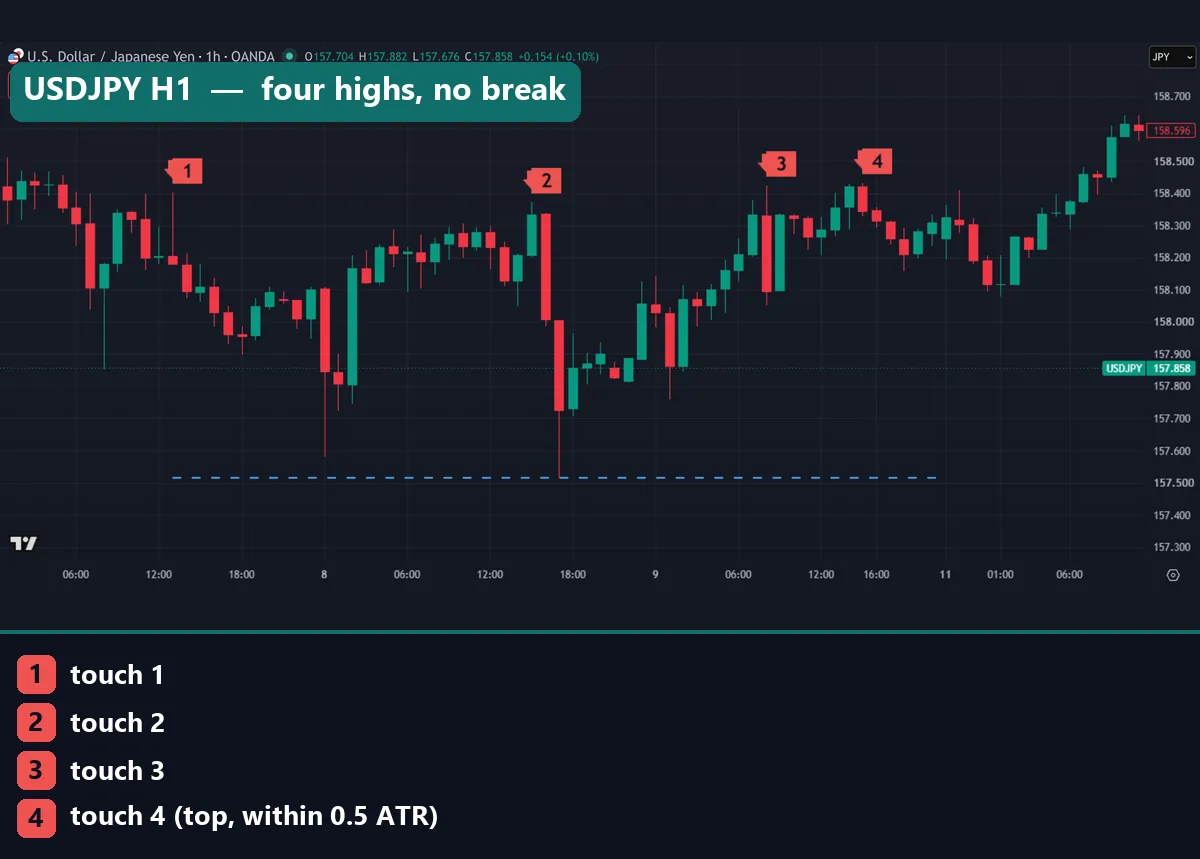
The chart above shows a tight example on USDJPY H1. The four highs printed between 7 and 9 October 2026, at 158.402, 158.371, 158.423 and 158.432. That is a spread of just 6.1 pips. Yet price never closed below the 157.514 neckline. Instead, after the weekend, USDJPY closed above all four highs.
The shape extends the double top pattern with two extra tests of the high. If one middle peak stands clearly above the rest, most chartists would call it a head and shoulders pattern instead. Smart money traders call four matching highs equal highs and read them as a pool of resting stop orders.
How the quadruple top works: neckline, height and target
The story is simple. Buyers push price to the same level four times, and sellers turn it back each time. A close below the neckline should show that buyers have given up. The measured target then subtracts the pattern height from the neckline:
height = highest touch - neckline
target = neckline - height
Take the USDJPY hourly chart above. The highest touch was 158.432 and the neckline 157.514. So the height was 91.8 pips, and the target would have sat at 156.596. Our guide to measured move targets explains the method.
The classic stop goes above the highest touch. Thomas Bulkowski uses the same confirmation rule for triple tops. Price must close below the lowest valley, as his triple top notes at ThePatternSite explain. His statistics come from stocks, not forex, so we do not quote them here.
The quadruple bottom: the same shape upside down
A quadruple bottom is the mirror image. Four lows sit at about the same price, and the neckline is the highest high between them. It completes on a close above that line. So the height is the neckline minus the lowest touch, and the target is the neckline plus the height. Meanwhile, the stop sits below the lowest low. Our triple bottom chart pattern guide covers the three-touch version with a larger sample.
How we tested the quadruple top
Patterns picked by eye are easy to bias, because the ones that worked stand out. So every pattern in our statistics came from a fixed scan.
Our data came from MetaTrader 4, build 1471, using Capital Point Trading terminal history. The daily scan covered 23 forex pairs from 12 June 2018 to 24 August 2026. We also scanned hourly bars on EURUSD, GBPUSD and USDJPY from 22 December 2025 to August 2026. For gold (XAUUSD), the hourly window ran from 1 July 2025 to 20 August 2026.
The chart examples come from the TradingView web chart with OANDA data, from March to October 2026. They cover USDJPY (H1 and D1), USDCHF (M15), AUDUSD (H1), GBPJPY (M15) and gold (H1). The same rule found them, but four of the six needed a looser tolerance. Every marker and line is our measurement.
All results are before spread, swap and commission. We placed no trades; we counted what price did after each pattern. Our method follows our editorial testing policy. Also, MT4 and OANDA only show tick volume, which counts price changes rather than traded size. So we left volume out.
Our detection rules and settings
Here is the exact rule set behind the numbers. Different choices would find a different sample.
| Parameter | Our setting | Why it matters |
|---|---|---|
| Touch (swing high) | Highest high of 11 bars, five on each side | Only clear peaks count |
| Touches | 4 consecutive swing highs within 120 bars | No other swing high between them |
| Tolerance | All four within 0.5 ATR | Scales “the same price” to volatility |
| Chart examples | 0.75 ATR when 0.5 ATR found nothing | Looser, so read them with care |
| Neckline | Lowest low from touch 1 to touch 4 | The level a close must clear |
| Minimum height | 1.5 ATR | Filters out tiny, flat ranges |
| Break | A close below the neckline within 30 bars | Closes only, never wicks |
| Target | Neckline minus height, within 40 bars | Time limit for the move |
| Failure | A close above the highest touch first | The classic stop level |
| ATR | 14 bars, simple average of true range | The volatility yardstick |
Bottoms use the mirror of every rule. Each touch is a swing high: the highest high within five bars on each side. Bill Williams’ indicator uses two, as TradingView’s Williams fractal help page shows, so our touches are rarer. Our Williams fractals guide covers the standard version. For ATR, see the MetaTrader 4 Help page on Average True Range or what ATR means in trading.
Reading a quadruple top on a chart
On our charts, red markers 1 to 4 are the touches of a top, and green ones mark a bottom. The blue dashed line is the neckline. Where a blue marker 5 appears, it shows the first close through that line.
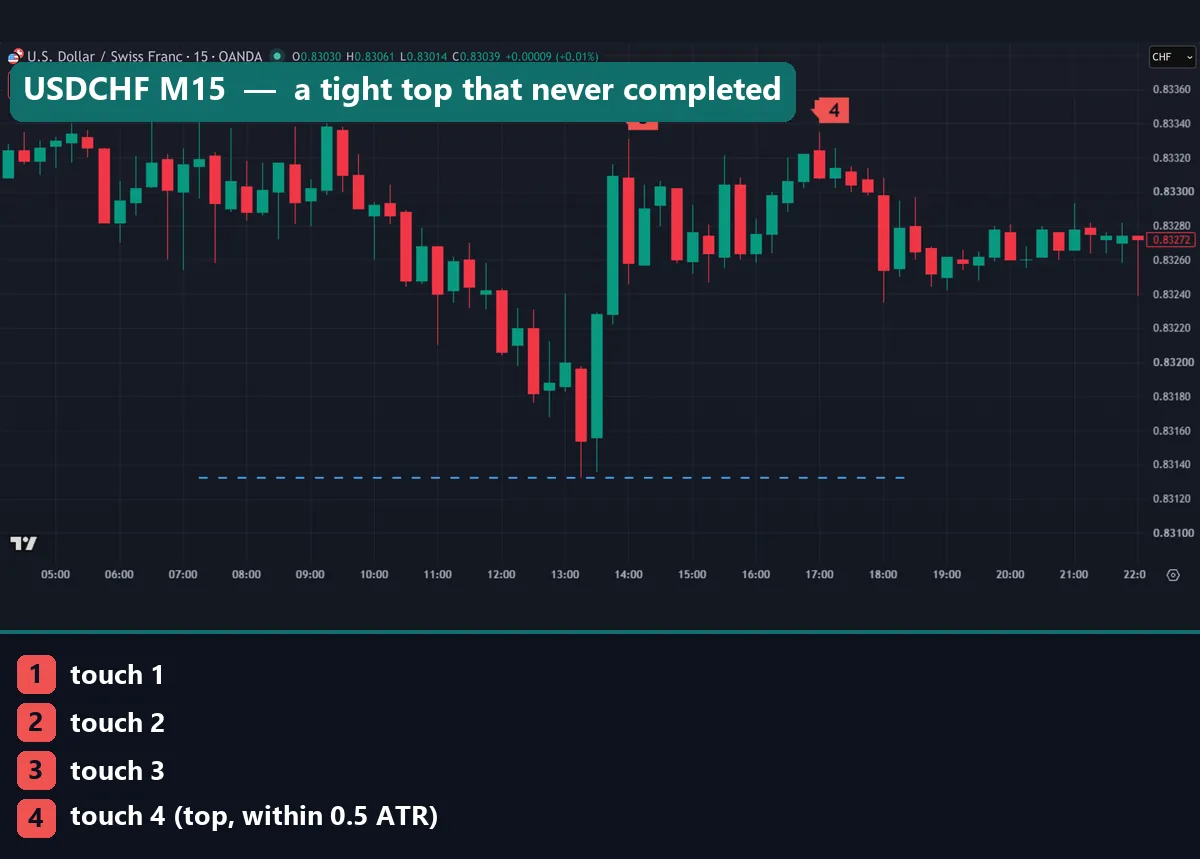
The USDCHF 15-minute chart shows a tight top on 13 October 2026. The highs were 0.83345 at 07:15 UTC and 0.83340 at 09:15. Then came 0.83331 at 14:00 and 0.83335 at 17:00. They sit just 1.4 pips apart.
Now look at the dip between touches 2 and 3. Price fell straight to 0.83132 and shot back up. That one fast dip set the neckline 21.3 pips below the top. After touch 4, price drifted lower but never closed below the line. So the shape looks textbook, yet it never completed.
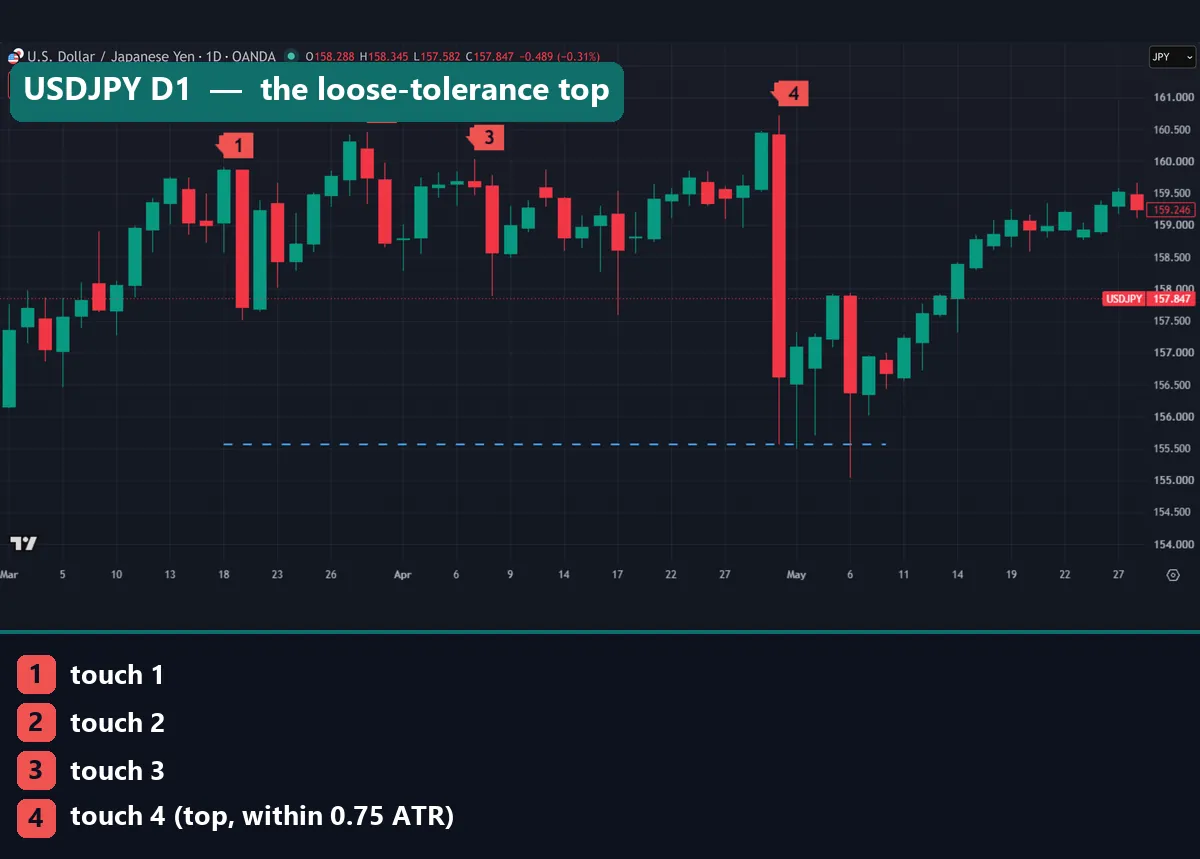
The daily USDJPY chart covers March to May 2026. It is our widest example, and it only qualifies under the looser 0.75 ATR tolerance. The next section works through it.
Worked example: the USDJPY daily quadruple top
Here are the numbers for that daily pattern, straight from our example log.
- Touches: 159.904 on 18 March 2026, 160.464 on 30 March, 160.032 on 7 April and 160.726 on 30 April.
- Spread: 160.726 minus 159.904 equals 0.822 yen, or 82.2 pips.
- Neckline: 155.556, the lowest low from touch 1 to touch 4.
- Height: 160.726 minus 155.556 equals 5.170 yen, or 517 pips.
- Target: 155.556 minus 5.170 equals 150.386.
Now check where the neckline came from. The 155.556 low belongs to the touch 4 bar itself. The same daily bar that made the 160.726 high on 30 April also traded down to 155.556. So our rule took the neckline from one violent day, not from the range.
Drawn by hand, the neckline would more likely run through the March and April swing lows at 157.51 and 157.59. Those lows also formed our triple bottom example on this chart. With that line, the break came on the touch 4 day, and the target sat near 154.29.
So one chart gives two readings. Wicks poked under 155.556 in early May, but no daily bar closed below it. So our rule logged no break. The hand-drawn version broke at once, but price got no lower than about 155.0. By late May, USDJPY was back above 159. Either way, a stop above 160.726 put about the full height at risk for a 1 to 1 payoff before costs.
What 22 daily quadruple tops and bottoms did
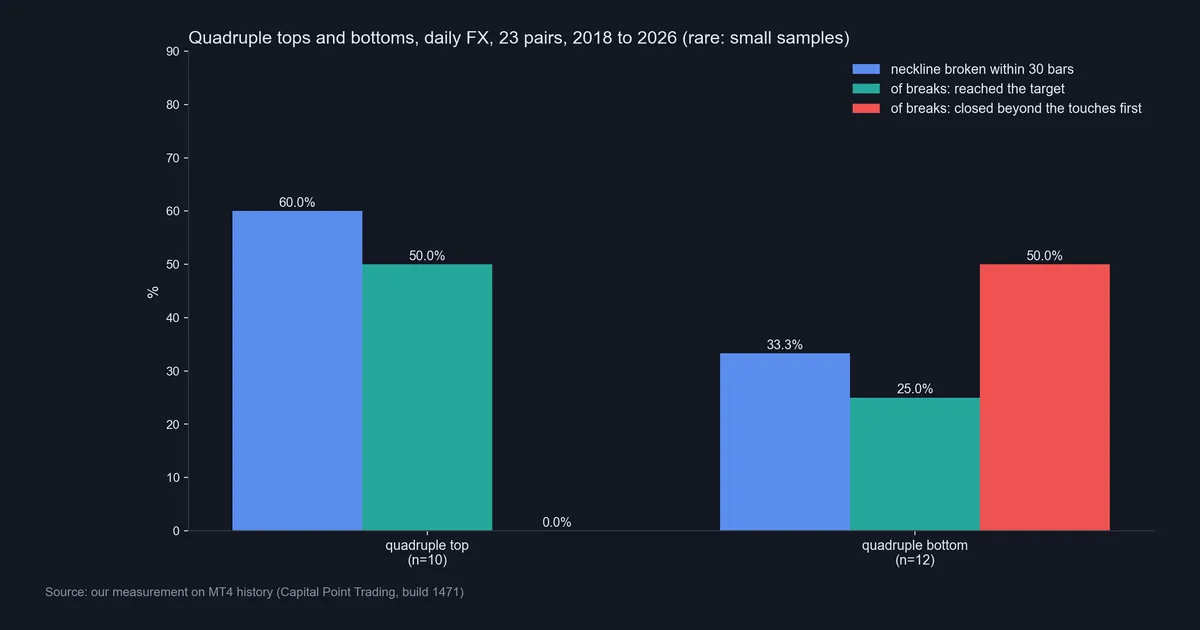
The chart above is our measurement. Across 23 daily pairs and eight years, the scan found just 10 quadruple tops and 12 quadruple bottoms. For scale, a similar scan found 77 triple bottoms on the same data.
Of the 10 tops, 6 closed below the neckline within 30 days, or 60%. Half of those 6 breaks reached the target within 40 days, and none closed above the highest touch first. Yet ten days after the break, only 1 of the 6 sat lower. The median move over those ten days was 0.65 ATR higher, against the pattern.
The bottoms looked weaker. Only 4 of 12 closed above the neckline, or 33.3%. One of those 4 reached the target, and 2 closed below the lowest touch first. Ten days after the break, the median move was 0.93 ATR lower.
For context, price was higher ten days later on 52.3% of all days in the sample. But with 6 and 4 breaks, one pattern moves a percentage by 17 to 25 points. Our guide to backtest sample size explains why that is far too few. So we draw no conclusion. The hourly scan found even fewer: 2 tops and 3 bottoms, with one break each.
An hourly quadruple top that never broke
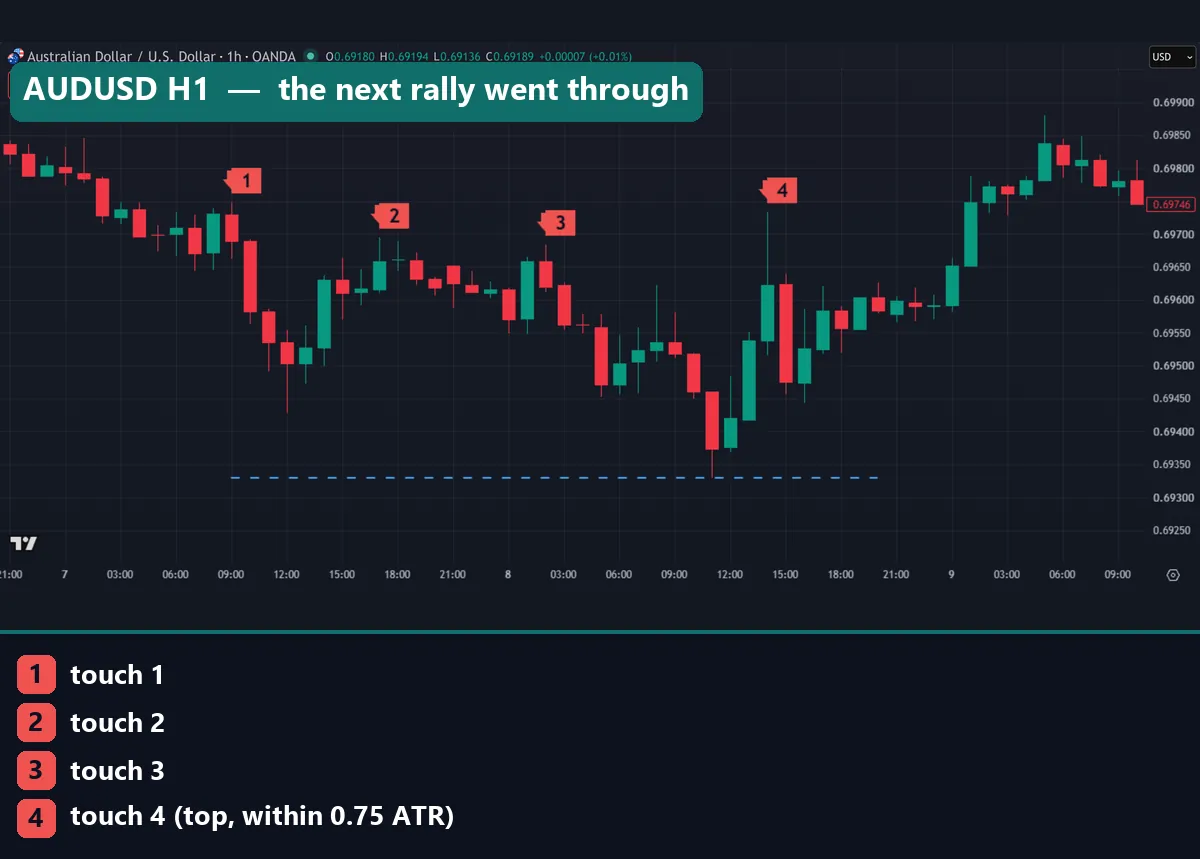
The AUDUSD hourly chart shows the most common outcome in our examples: no break. The highs were 0.69748 and 0.69695 on 7 October 2026, then 0.69684 and 0.69733 on 8 October. They spread over 6.4 pips, so this one needed the 0.75 ATR tolerance.
The neckline sat at 0.69329. Touch 4 left a long upper wick, which many traders read as bearish. However, price never closed below the neckline. On 9 October it rallied above all four highs, just like the USDJPY hourly chart at the top. In both cases, a sell at touch 4 would have run into its stop.
Download the complete indicator database
Put these concepts on your charts. One email unlocks the full library of 1,380+ indicators with compiled MT4 and MT5 files, plus my TradingView scripts. No paywall, no spam, unsubscribe any time.
Get free access to my indicator database
One email unlocks 1,380+ free MT4, MT5 and TradingView indicators — the complete library. No single-tool download; you get the whole database.
Where it fails
The quadruple top has clear weak points, and our own numbers show most of them.
- It is rare. We found 10 tops and 12 bottoms on 23 daily pairs in eight years.
- Many never complete. 4 of 10 tops and 8 of 12 bottoms did not close through the neckline within 30 days. Five of our six chart examples did not break either.
- Examples need a loose rule. Four of six chart examples only qualified at 0.75 ATR. Looser tolerances turn plain ranges into “patterns”.
- The neckline depends on the rule. On USDJPY D1, one spike day set it. On gold, one extra low moved it by $57.09.
- The stop is wide. It risks about the full height, at least 1.5 ATR under our rule.
- No real volume. Tick volume does not measure traded size.
Above all, four touches feel like proof of a strong level. Our data cannot confirm that. In two of our hourly examples, the next rally after touch 4 cleared all four highs.
Two quadruple bottoms on intraday charts
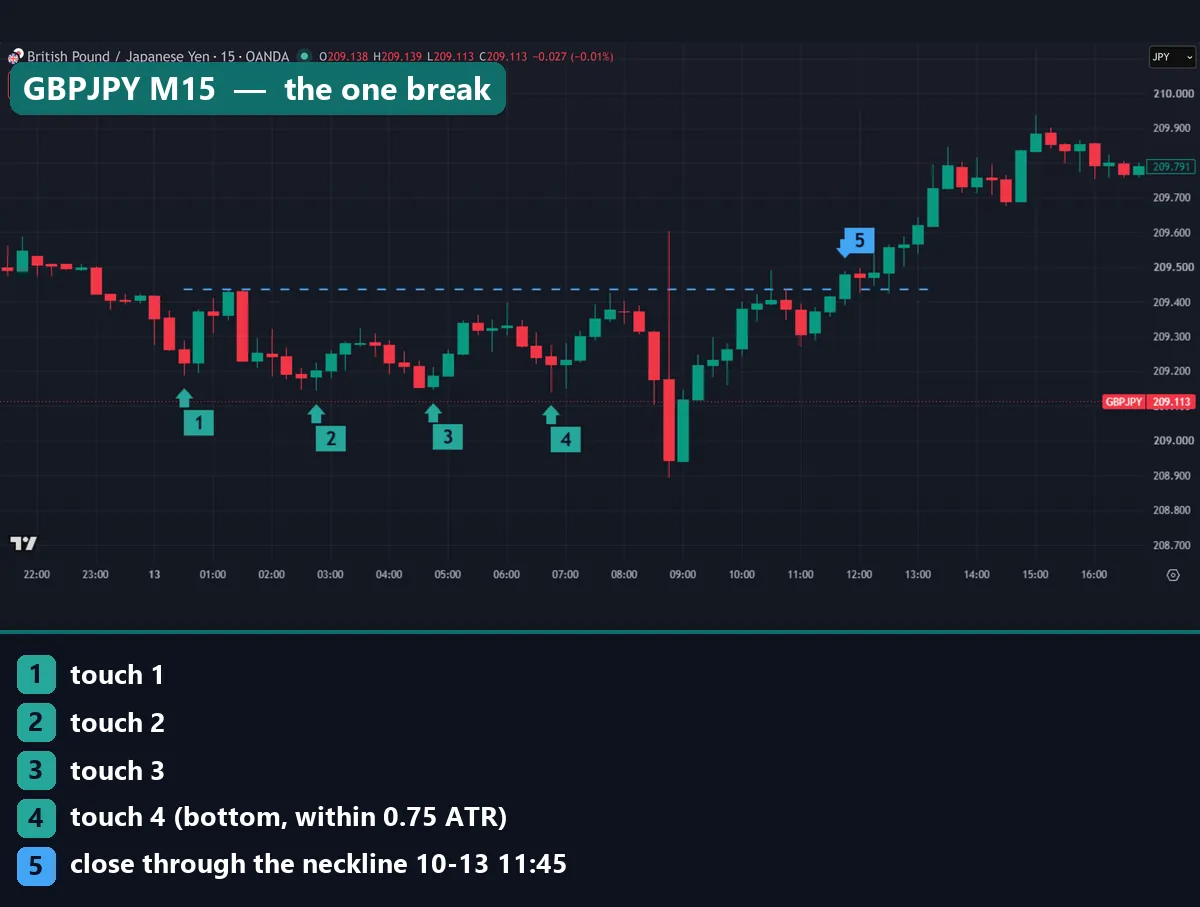
The GBPJPY 15-minute chart is our only example that broke. On 13 October 2026, four lows printed between 209.188 and 209.140, from 00:30 to 06:45 UTC. The neckline was 209.435. Marker 5 is the first close above it, at 209.478 at 11:45 UTC.
The height was 29.5 pips, so the target sat at 209.730. Price cleared it by 15:00 UTC. But look at the bar just before 09:00. It spiked both ways and closed below all four lows. A strict trader would have called the pattern void there. Our rule only checks for failure after the break, so it kept the pattern alive.
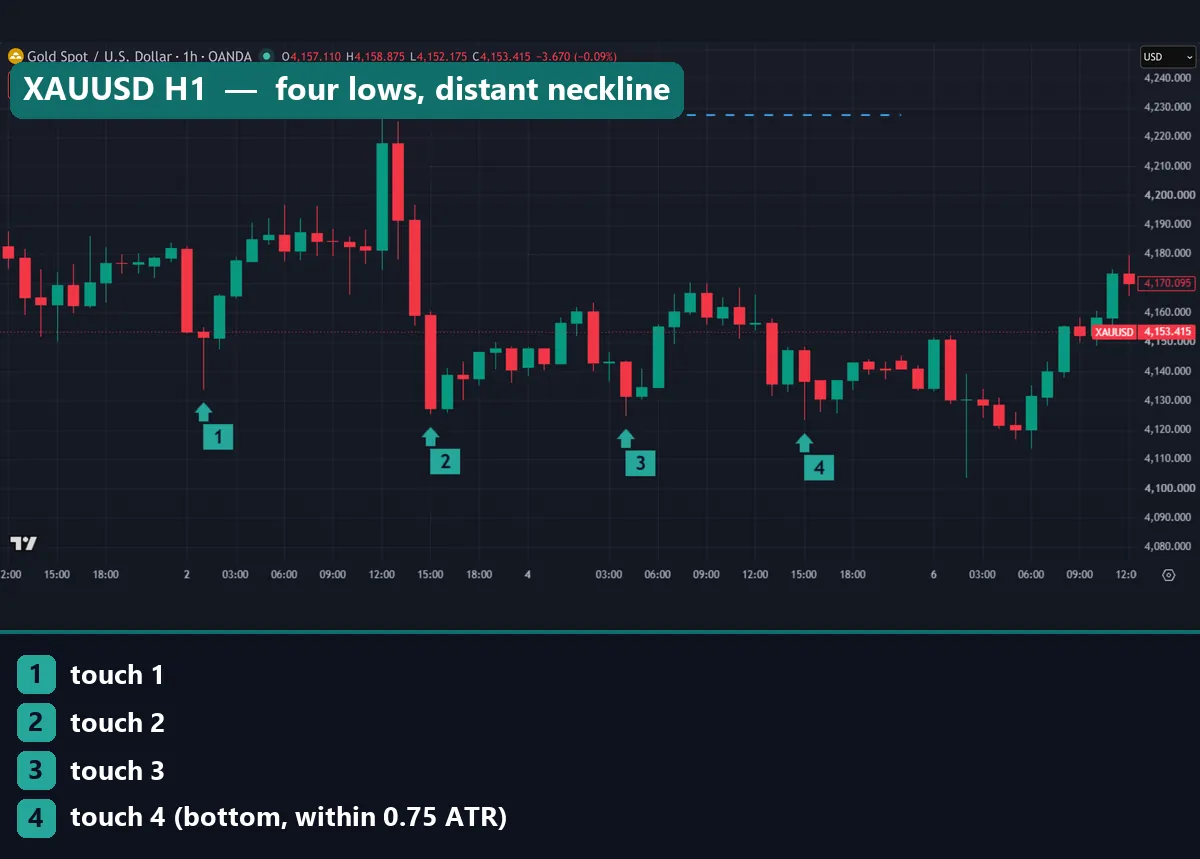
The gold hourly chart tells the opposite story. Its lows were $4,133.72 and $4,125.28 on 2 October 2026, then $4,124.75 and $4,123.36 on 5 October. The neckline is the $4,227.53 spike high from midday on 2 October. Price never came close. Instead, two hourly closes on 6 October dipped below all four lows.
Here is the twist. The last three lows formed the gold example in our triple bottom guide. There, the neckline was $4,170.44, and gold closed above it at 11:00 UTC on 6 October. One earlier low pulled the spike into the pattern and lifted the neckline by $57.09. So the touch count alone flipped the verdict.
Common mistakes with the quadruple top
- Selling the fourth touch. The fourth high is not a signal. Wait for a close below the neckline.
- Treating a wick as the break. On USDJPY D1, wicks poked under the neckline, but no bar closed below it. Our break and retest strategy test shows how often first breaks fail.
- Stretching the tolerance. At 0.75 ATR, ranges qualify that few traders would call a top. Fix your tolerance before you look. Our guide to chart pattern failure covers the trap.
- Ignoring size against costs. The risk is close to the full height. On a 21-pip M15 pattern, costs take a large share. Read how to use a stop loss for sizing.
Where to go next
Our fractal indicator for MT4 marks fractal highs and lows for you. Keep in mind that our scan used a wider swing, so it finds fewer touches.
For the two- and three-touch versions, read the double top pattern guide and our triple bottom chart pattern test. Since every result here is before costs, our note on backtesting transaction costs helps too. For outside reading, see the triple top reversal article at StockCharts ChartSchool. It makes a fair point: treat the shape as neutral until support breaks.
FAQ about the quadruple top
Is a quadruple top bullish or bearish?
It turns bearish only when a candle closes below the neckline. Before that, it is a range. In our daily test, 6 of 10 quadruple tops closed below the neckline within 30 days.
How do you calculate the quadruple top target?
Subtract the neckline from the highest touch to get the height. Then subtract that height from the neckline. In our USDJPY daily example, that gave a target of 150.386.
How close do the four highs need to be?
No standard exists. We required 0.5 ATR for our statistics. Four of our six chart examples needed 0.75 ATR, which lets in looser shapes.
Where does the stop loss go on a quadruple top?
The classic stop sits above the highest touch, where the pattern is clearly void. That makes the risk close to the full height, so size the position to that distance.
Is a quadruple top stronger than a triple top?
Many traders assume so. We cannot confirm it. On the bottom side, only 33.3% of our quadruple patterns broke the neckline, against 51.9% of triple bottoms under similar rules.
What is a quadruple bottom?
It is the mirror image: four equal lows, with the neckline at the highest high between them. We found 12 on daily charts, and only 4 broke.
Does volume confirm a quadruple top in forex?
Not in the classic sense. MT4 and OANDA show tick volume, which counts price changes, so we left volume out of our test.
How often does a quadruple top reach its target?
In our daily scan, 3 of 10 quadruple tops broke the neckline and then reached the target within 40 days. For bottoms, it was 1 of 12. These samples are far too small to rely on, and the figures are before costs; results are not guaranteed; past performance is not indicative of future results.
Last updated: 15 October 2026.

About the author
Written by Dominic Walsh, a Forex trader and MT4/MT5 indicator, Expert Advisor and script developer. Every tool on forexmt4systems.com is tested on live charts before release and ships with ready-to-use compiled MT4 (.ex4) and MT5 (.ex5) files. Learn more about the trader and developer behind this site.
How we build, test and correct every tool: Editorial & Testing Policy. Trading carries risk; see the disclaimer.