
Renko trading means reading price from bricks of a fixed size instead of from time-based candles. A new brick prints only when price moves a set distance, so quiet hours vanish from the chart. This guide settles two questions. First, how a Renko chart is built and read. Second, whether a simple Renko flip rule beat the same idea on plain candles in our own test on three major pairs.
What a Renko chart is
A Renko chart plots one brick each time price travels a chosen distance. The name comes from the Japanese word for bricks. Time is not on the x-axis in any normal sense. If price sits still for a day, no brick prints. If price runs 100 pips in an hour, five 20-pip bricks may print in a row.
Each brick has the same height. Green bricks mean price rose by one brick size. Red bricks mean it fell by one brick size. So a Renko chart never shows a small candle, a doji or a long wick in the brick body itself. It only answers one question: did price move far enough to count?
Many traders find a plain bar or candlestick chart too busy on low timeframes. Renko sits in the same family as Heikin Ashi candles and the line chart: all three trade detail for a calmer picture.
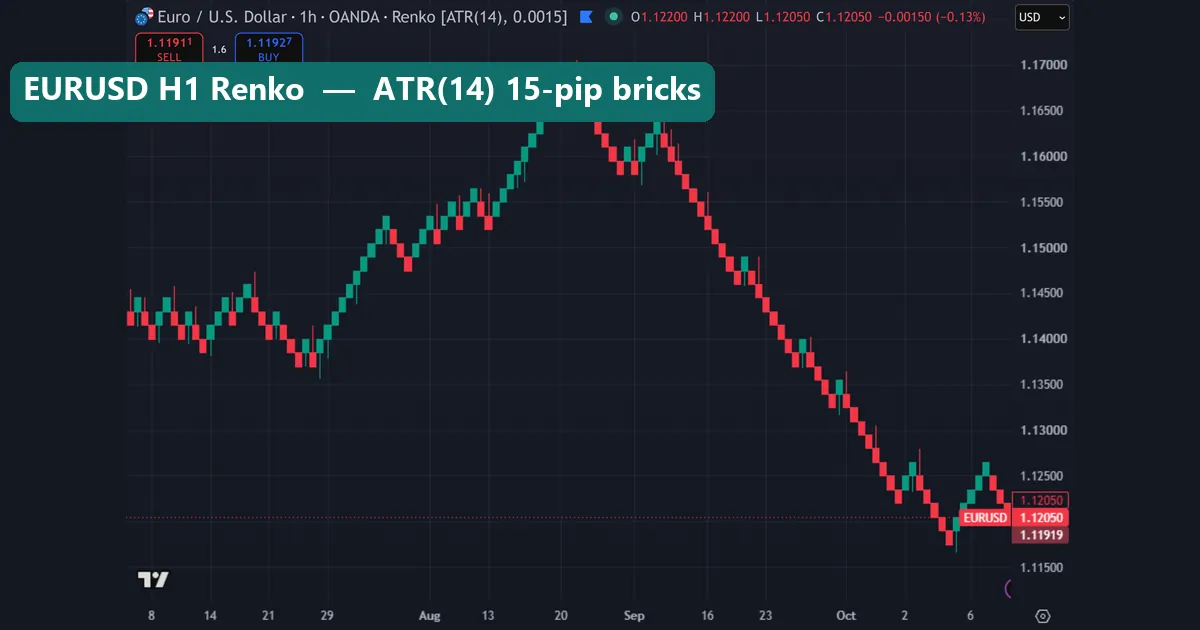
The TradingView help page on Renko charts gives the platform’s own description of the settings. Our image above uses those defaults on EURUSD H1.
How renko trading builds each brick
Pick a brick size, B. Then compare each closing price with the edges of the last brick. The rule is short.
- Up brick: if the close is at or above
last brick top + B, draw a green brick. Repeat while the move allows more bricks. - Down brick: if the close is at or below
last brick bottom - B, draw a red brick. - Reversal: after green bricks, a red brick needs a fall of
2 x Bfrom the top of the last green brick. The same applies in reverse.
That two-brick reversal is the classic style, and it is the one we used. So with 20-pip bricks, price must fall 40 pips from the last brick top before the chart turns red. Anything less leaves the chart unchanged.
Brick size can be fixed in pips, or it can come from volatility. TradingView’s default uses ATR(14). It measures the average true range on normal candles and uses that number as the brick. Our charts show the result in the title bar: Renko [ATR(14), 0.0015] on EURUSD means 15-pip bricks. If ATR is new to you, read our guide on what ATR means in trading and the average true range entry at BabyPips.
Note what Renko throws away: the open, high and low inside each brick. That is why the chart looks so tidy.
How we tested
We wanted a fair, simple test. So we built Renko from H1 closes in MetaTrader 4 history from Capital Point Trading, MetaTrader 4, build 1471. Then we compared it with a plain candle rule on the same bars.
- Symbols: EURUSD, GBPUSD and USDJPY.
- Timeframe: H1 closes.
- Date window: 22 December 2025 to 26 August 2026 for EURUSD, and 22 December 2025 to 13 August 2026 for GBPUSD and USDJPY.
- Brick size: fixed, 20 pips on EURUSD and 25 pips on GBPUSD and USDJPY. A reversal needed two bricks.
- Renko rule: flip long or short at the next H1 open each time the brick colour changes.
- Candle rule: flip after two same-colour H1 candles against the open position.
Both systems were always in the market. All results are in pips, before spread, swap and commission. The MT4 history had no usable spread, so we did not guess one. Our editorial testing policy explains how we run and report tests like this.
The chart images come from the TradingView web chart, captured on 7 October 2026 with OANDA data. They use TradingView’s default ATR(14) brick, not our fixed test bricks, so the brick sizes differ from the test.
Renko settings we used
The settings that matter, with the values behind our test and our images:
| Setting | What it does | Our MT4 test | Our TradingView images |
|---|---|---|---|
| Brick size method | Fixed distance, or a distance taken from ATR | Fixed pips | ATR, default |
| ATR length | Bars used to average the true range | Not used | 14 |
| Brick size | Height of one brick | 20 pips EURUSD, 25 pips GBPUSD and USDJPY | 0.0015 EURUSD and GBPUSD, 0.2 USDJPY, 0.25 GBPJPY, $100 gold |
| Price source | Which price builds the bricks | H1 close | Close |
| Reversal | Bricks needed to change colour | 2 | Classic two-brick turn |
| Signal timing | When a trade is placed | Next H1 open after a colour change | No trades placed |
Brick size is the setting that changes everything. Smaller bricks print more often and flip more often. Larger bricks wait longer and give back more on each turn. There is no neutral choice.
Reading Renko bricks on a chart
Start with the plain candles. The image below is EURUSD H1 as normal candles for the first week of October 2026. It covers the right-hand end of our first Renko image.
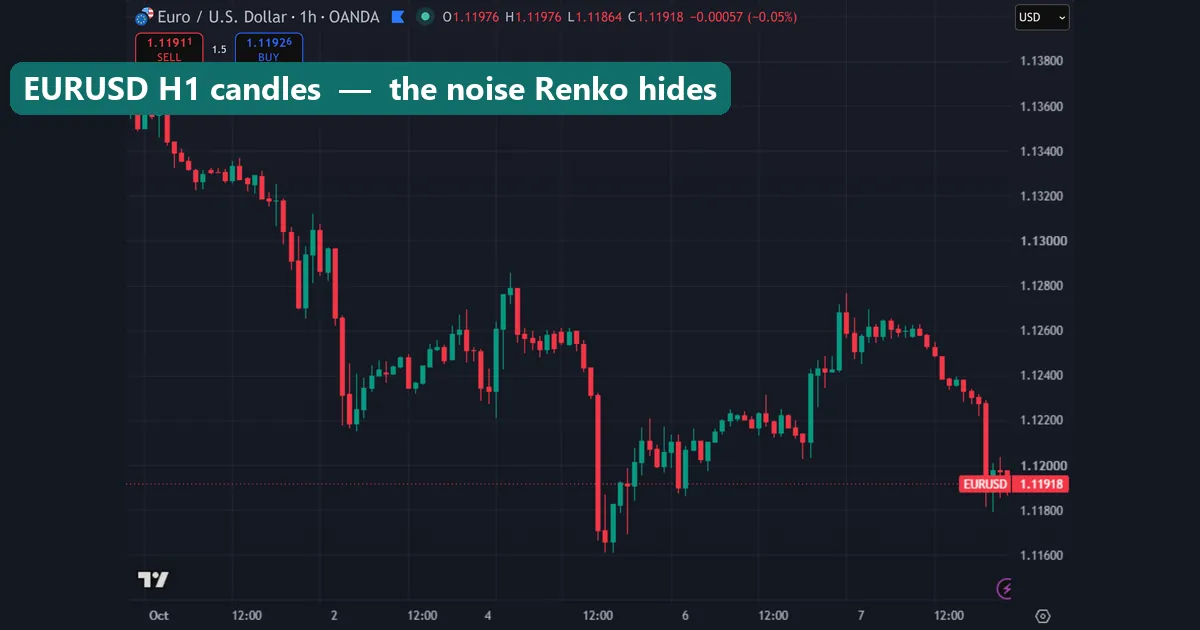
Look at how much noise sits in that week. The candles dip from the 1.13600 area to near 1.11600, then bounce, chop and drop again. A two-candle flip rule would change sides again and again here.
Now compare that with the Renko view. In our first image, the same stretch shows up as only a handful of bricks at the far right. The long slide from the 1.17000 area in late August reads as one clean staircase. That is what Renko is good at: it makes trend legs obvious.
Reading a trend leg on GBPUSD Renko
Next, look at GBPUSD with the same 15-pip ATR brick.
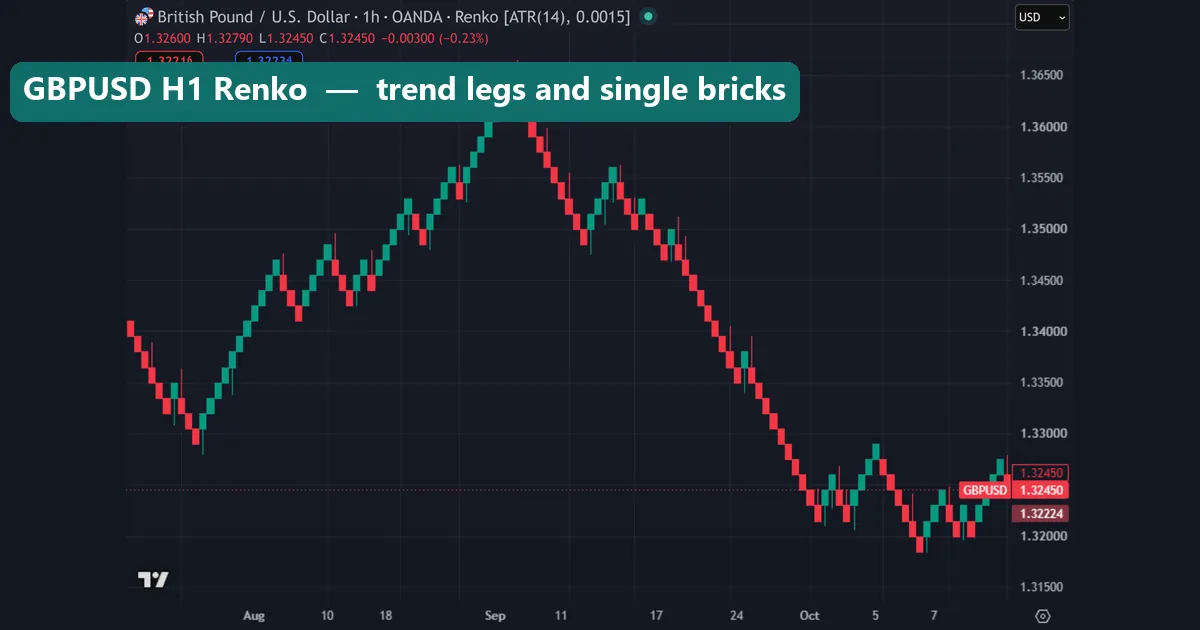
Here the shape tells the story. Price climbs from early August to a top near 1.36500 in early September. Then it falls in long red runs into October, near 1.32450 at the right edge. Short green runs interrupt the red ones. Each marks a bounce that was large enough to turn the chart.
So the reading rules are simple. Long runs of one colour mean a trend leg. Alternating single bricks mean a range. The thin lines on some bricks are wicks. They show how far price went inside the brick.
Worked example: renko trading on EURUSD
Here is how the test rule played out on EURUSD with 20-pip bricks. Each flip needed a 40-pip move against the last brick edge.
- The Renko flip rule made 79 trades between 22 December 2025 and 26 August 2026.
- The two-candle rule made 741 trades on the same bars.
- Renko lost 608.1 pips in total, an average of -7.7 pips per trade.
- The candle rule lost 1,057.5 pips, an average of -1.43 pips per trade.
- Only 30.4% of Renko trades closed in profit, against 35.0% for the candle rule.
So Renko cut the trade count by more than 600 and lost less in total. But each Renko trade lost more on average, and fewer ended in profit. The two-brick reversal is the reason: every turn gave back at least 40 pips before the rule flipped.
Costs make the gap larger. All these numbers are before spread. Yet the candle rule pays the spread 741 times, while Renko pays it 79 times. So the lower count is a real benefit. For more on fees, see our guide to transaction costs in backtests.
What all three pairs showed
The chart below is our measurement across the three pairs. The left panel counts trades. The right panel shows average pips per trade, before costs.
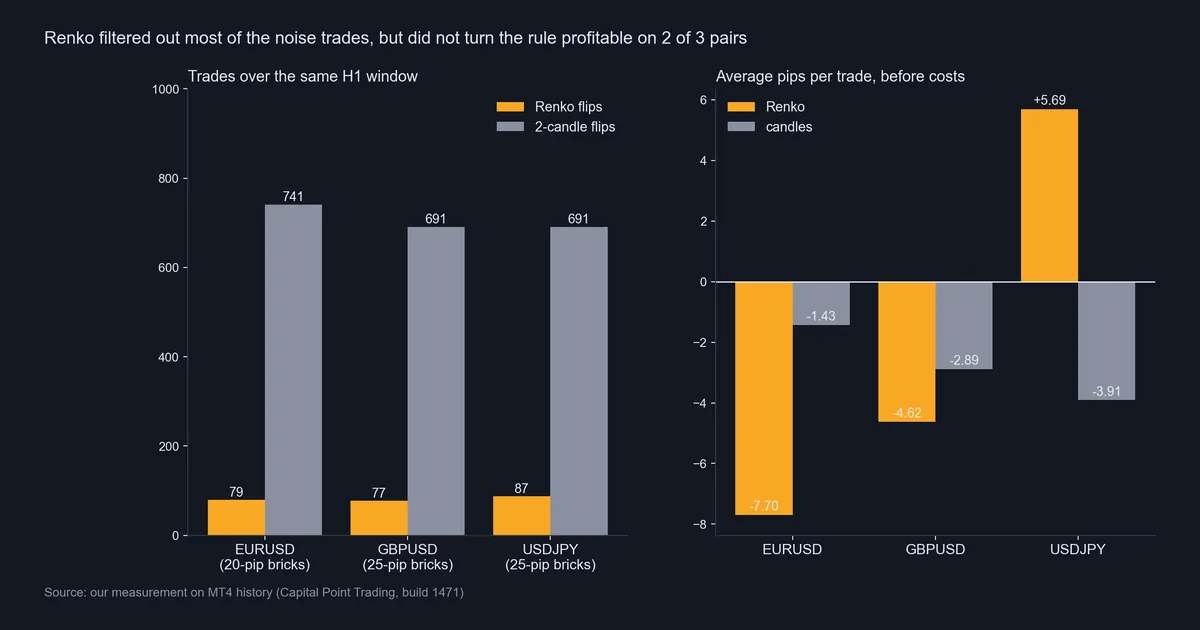
The pattern holds on all three. Renko made 79, 77 and 87 trades. The candle rule made 741, 691 and 691. In short, Renko removed about nine out of ten trades.
The results split. On GBPUSD with 25-pip bricks, Renko lost 356.0 pips over 77 trades, or -4.62 pips per trade. Only 32.5% of trades closed in profit. The candle rule lost far more, 1,997.9 pips, but at -2.89 pips per trade.
USDJPY was the one pair where Renko came out ahead. It made 494.6 pips over 87 trades, or +5.69 pips per trade, and 40.2% of trades closed in profit. The candle rule lost 2,698.4 pips on the same bars.
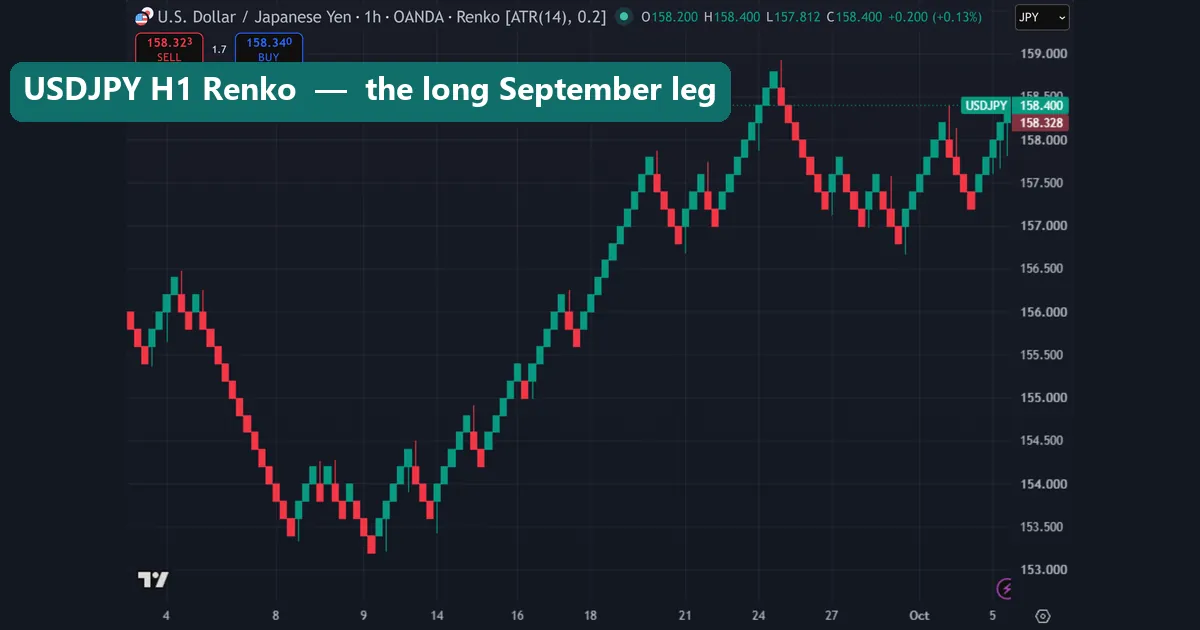
The USDJPY image shows why the brick rule had a better time there. Price fell into early September, then climbed in long green runs from near 153.500 to a top near 158.800 around 24 September. Long legs like that pay for the give-back. Still, one pair out of three is not an edge, and the sample is small.
Download the complete indicator database
Put these concepts on your charts. One email unlocks the full library of 1,380+ indicators with compiled MT4 and MT5 files, plus my TradingView scripts. No paywall, no spam, unsubscribe any time.
Get free access to my indicator database
One email unlocks 1,380+ free MT4, MT5 and TradingView indicators — the complete library. No single-tool download; you get the whole database.
Where it fails
It lags by design. A two-brick reversal means you are always late at turns. On EURUSD, that lateness drove the poor per-trade average.
It hides time. One brick can take ten minutes or ten days. A weekend gap or a news spike can sit inside one brick, and you cannot judge session timing from Renko alone.
The last brick is not final. A brick only prints when price closes beyond the edge. On ATR bricks, the box size also depends on recent volatility, so the same chart can show different bricks on another day. That is close to what traders call repainting, and it matters for any signal you read off the right edge.
Backtests on Renko are easy to fool. Filling trades at brick edges, which may never have traded at that moment, makes results look far better than they could be. We avoided this by filling at the next H1 open after a colour change.
Choppy markets punish it. When price swings about two bricks back and forth, Renko flips at the worst points. The GBPJPY image below shows this.
What gold and GBPJPY show about Renko
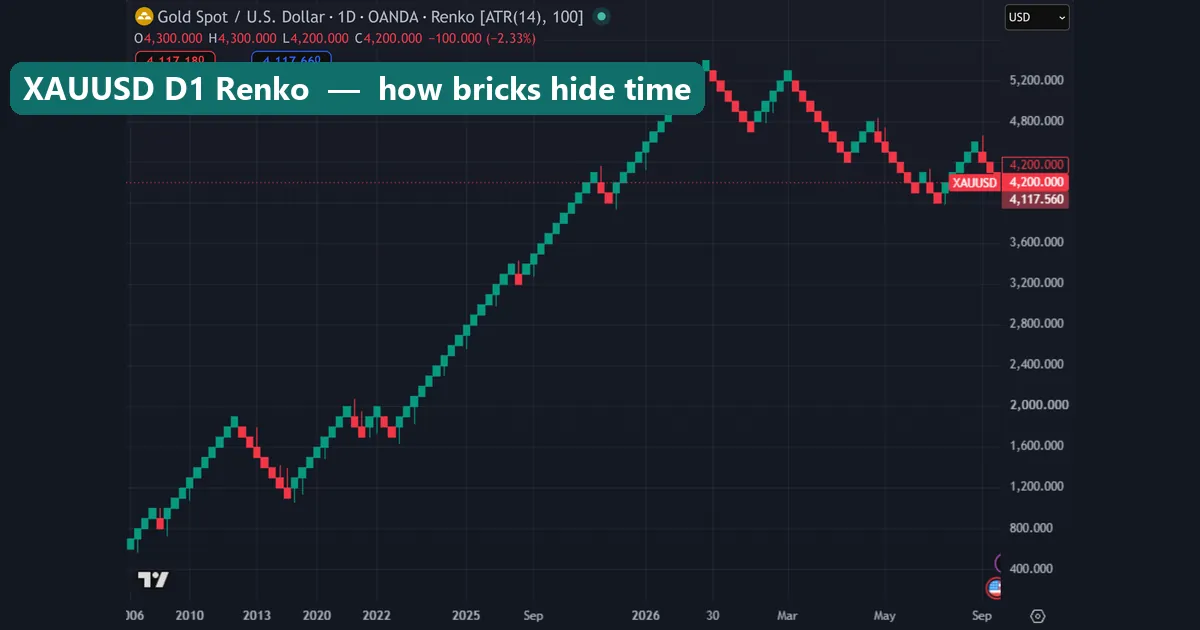
This is XAUUSD on the daily chart with a $100 brick. Look at the time axis. Labels from 2006 to 2022 sit packed into the left part of the chart, while 2026 alone takes up a wide stretch on the right. That is Renko hiding time. The fast run from about $2,000 to over $5,200 near early 2026 fills a large share of the chart.
So the chart shows a smooth climb but says nothing about how long each part took. At the right edge, gold sits near $4,200.
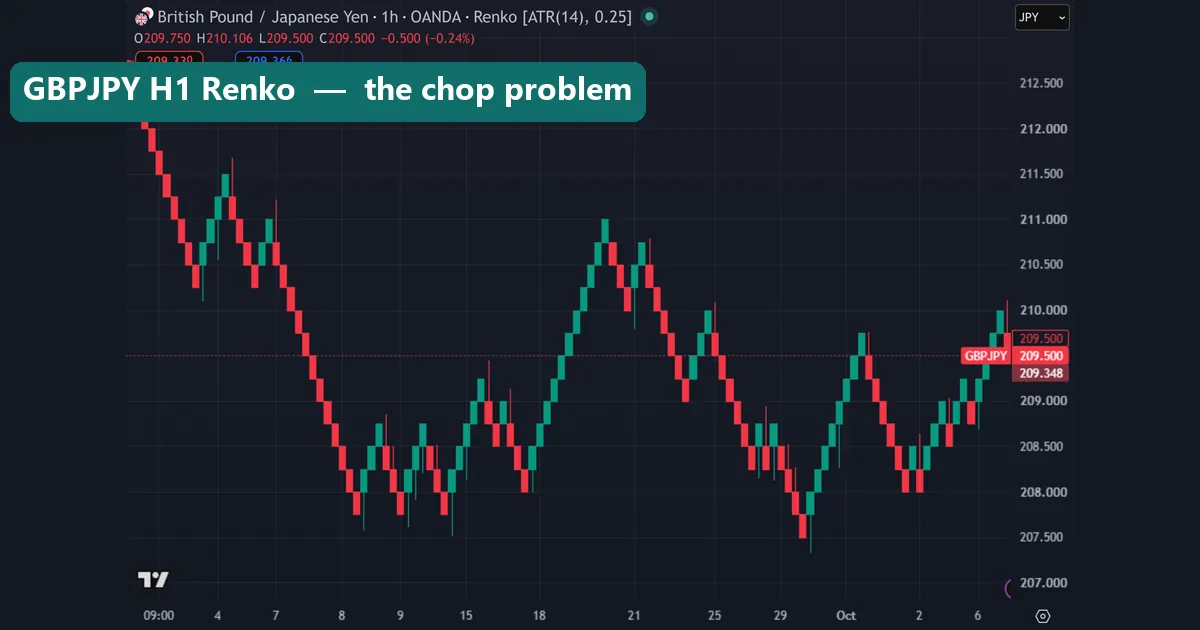
GBPJPY on H1 with 25-pip ATR bricks shows the chop problem. From early September into October, price swings between about 207.500 and 211.000. Runs of three to five bricks keep turning the other way. A colour-flip rule would trade every one of those turns, late each time. Renko does not remove a range; it only redraws it.
Common mistakes with Renko
These four errors are easy to make, and each one would have skewed our own test.
- Treating bricks as candles. A green brick is not a bullish candle. It has no real open or close time. Candle patterns such as engulfing bars do not carry over.
- Picking brick size after the fact. It is easy to try ten sizes and keep the one that looked best. That is curve fitting. Fix the size first, then test.
- Ignoring costs. Our numbers are all before spread, swap and commission. On low timeframes with small bricks, the spread can be a large part of each brick.
- Trusting a small sample. Our tests had 77 to 87 Renko trades per pair. That is too few to prove an edge. Our guide on backtest sample size explains why.
Where to go next
If you trade with trends, start with our guide to trend-following trading. Renko shows trend legs; it is not a system.
To compare chart styles, read Heikin Ashi vs candlesticks. Then set up your own Renko view with our TradingView chart guide. After that, step through the bricks bar by bar with TradingView Bar Replay.
MetaTrader 4 has no built-in Renko chart; our Renko scalping indicator page is one custom option. Before you trust any Renko rule, test it with walk-forward analysis, which we did not do here.
For outside reading, see StockCharts ChartSchool on Renko charts for the classic build rules. Also see the Renko chart definition at Investopedia for the general overview.
FAQ about renko trading
What is renko trading in simple terms?
It is trading from a chart that draws a fixed-size brick only when price moves that far. Time is ignored, so small moves and quiet hours drop out of view.
What brick size should I use on Renko?
There is no correct size. TradingView defaults to ATR(14), which gave 15-pip bricks on EURUSD H1 in our images. Our test used fixed 20 and 25-pip bricks. Pick a size before testing and keep it.
Did Renko beat normal candles in your test?
Only on USDJPY, which made +5.69 pips per trade before costs. On EURUSD and GBPUSD, Renko lost more per trade than the candle rule, even though it made about nine times fewer trades.
Why did Renko make so few trades?
Because a colour change needs a move of two full bricks. With 20-pip bricks, price must travel 40 pips the other way before the chart turns. Most H1 noise never gets that far.
Does a Renko chart repaint?
Closed bricks stay put on a fixed brick size. However, the newest brick only appears once price closes past its edge, and ATR-based bricks can resize when the chart reloads. So the right edge is never final.
Can I use Renko on MetaTrader 4?
Not as a built-in chart type. MT4 users rely on custom indicators or offline chart tools. We built our test bricks from MetaTrader 4 H1 history in a separate script.
Are candlestick patterns valid on Renko bricks?
No. Bricks have no real open, high, low and close for a time period. Patterns such as a doji or an engulfing bar need that data, so they do not carry over to Renko.
Is Renko trading profitable?
Our simple flip rule lost before costs on two of three pairs and gained on one, over about eight months of H1 data. That is not enough to call it profitable. Trading carries risk, and results are not guaranteed; past performance is not indicative of future results.
Last updated: 7 October 2026.

About the author
Written by Dominic Walsh, a Forex trader and MT4/MT5 indicator, Expert Advisor and script developer. Every tool on forexmt4systems.com is tested on live charts before release and ships with ready-to-use compiled MT4 (.ex4) and MT5 (.ex5) files. Learn more about the trader and developer behind this site.
How we build, test and correct every tool: Editorial & Testing Policy. Trading carries risk; see the disclaimer.