
One US dollar bought 14.5308 Seychelles rupees on 16 November 2026 in the TradingView feed we measured. When that history starts, in August 1997, the same dollar bought 5.0975. So the rupee has lost 64.9% of its dollar value, but not through a slow slide. Most of that loss came in the two years around the 2008 float. A second burst in 2020 mostly reversed in 2021. This guide settles how the rupee’s price works, what 29 years of quotes show, and where a free quote stops being reliable.
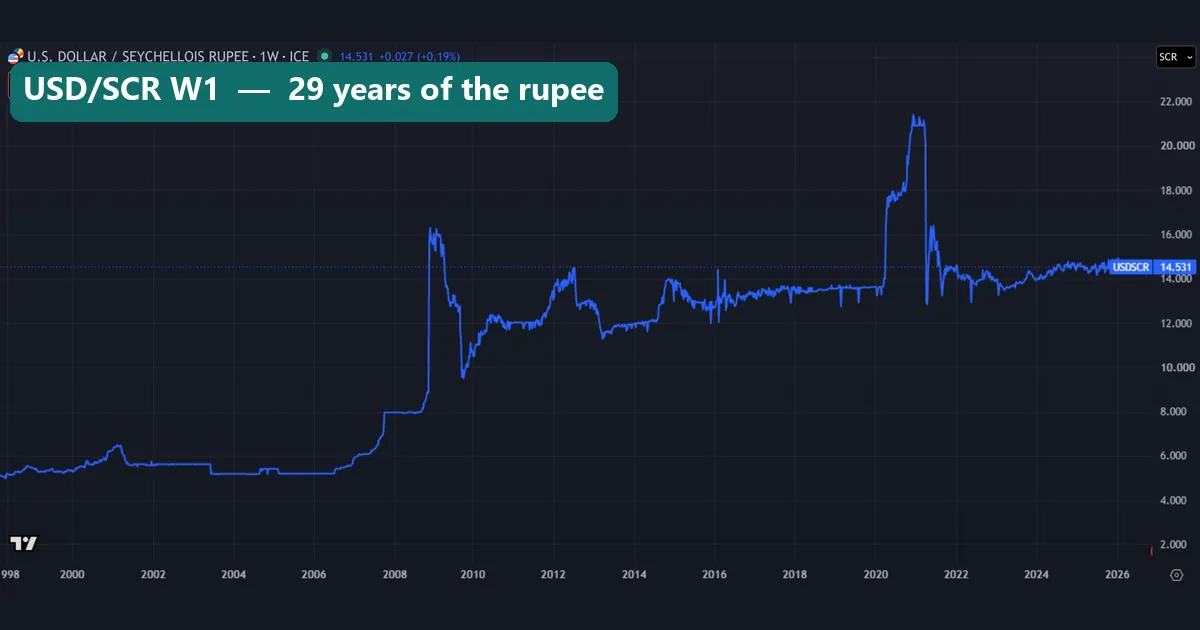
The weekly line chart above tells the story by shape alone. It runs almost flat between 5 and 6.5 for a decade, then leaps in late 2008. A second spike tops out above 21 in early 2021 and collapses within weeks. Since 2022 the line has held a narrow band between about 13 and 15.
What Seychelles rupees are
The rupee is the national currency of the Seychelles, an island republic in the Indian Ocean. It splits into 100 cents, and its ISO code is SCR. Its official symbol is R, though the abbreviation SR also appears. The Central Bank of Seychelles issues the notes and coins and runs monetary policy. According to the Seychellois rupee article on Wikipedia, the notes in use are 25, 50, 100 and 500 rupees.
That same article explains the name. The first local notes, in 1914, matched the Indian rupee at face value. Today the shared name is the only link to other rupees. Our Sri Lanka rupees guide follows a cousin that took a very different path. Our guide to African currencies lists this rupee among 38 currencies.
Behind the money sits a small, open economy. The IMF’s 2021 staff report puts tourism and its related sectors at about two-thirds of GDP. It also puts tourism receipts at about 35% of exports of goods and services. So when visitors stop coming, fewer dollars and euros reach the island’s banks, and the rupee weakens.
How the rupee’s price is set: from a peg to a float
Before November 2008 the rupee did not float. The central bank’s report for that year calls the old regime “a conventional pegged arrangement”. In practice, hard currency ran short. For most of 2008 the official rate sat at a target of 8 rupees per dollar. Meanwhile, a parallel market sold dollars at “a significant premium” above it.
Then the regime changed in one move. The Central Bank of Seychelles 2008 annual report (PDF) dates the float to 3 November 2008. All foreign exchange restrictions went with the peg. On that first trading day the rupee averaged 14.2405 per dollar. The IMF board approved a two-year, US$26 million stand-by loan on 14 November to back the reforms. In 2021 the bank told the IMF it would step in only to calm disorderly markets and to build reserves.
One formula covers every rupee sum in this guide. Our quote is USD/SCR, which counts rupees per dollar, so a higher number means a weaker rupee.
change in the rupee's dollar value (%) = (old USD/SCR / new USD/SCR - 1) x 100
change in USD/SCR itself (%)           = (new USD/SCR / old USD/SCR - 1) x 100
Both lines describe one move from opposite sides. From 5.0975 to 14.5308, the rate rose 185.1%, while the rupee lost 64.9% of its value. Quoting the first number makes any devaluation sound bigger than it was.
How we tested
We worked from one symbol, FX_IDC:USDSCR, on the TradingView web chart. TradingView names ICE as the source of this quote. We pulled daily bars on 16 and 17 November 2026. Any bar dated 17 November was still forming, so we dropped it. The history runs from 18 August 1997 to 16 November 2026: 6,830 daily closes after cleaning. We also captured weekly and monthly charts of the same feed.
Cleaning took one rule. We threw out 43 closes that sat more than 5% away from the median of the 11 days around them. Next, we measured year-end closes, yearly changes, the biggest single-print moves, flat stretches and days with no change. The feed also skips dates, with 58 gaps longer than five calendar days. Where a gap ends in a jump, we read it as the feed catching up.
Our editorial testing policy sets out how we capture and check market data. To see the live quote, open TradingView’s USD/SCR symbol page.
The rupee’s key numbers
A currency has no indicator settings, so this table lists the values that define its record. Each one comes from our feed unless the source column says otherwise.
| Parameter | Value | Source |
|---|---|---|
| First and last close | 5.0975 (18 Aug 1997), 14.5308 (16 Nov 2026) | Our feed |
| Rupee’s change in value | -64.9% against the dollar | Our feed |
| Weakest close | 21.5315 on 21 Jan 2021 | Our feed |
| Strongest close | 4.985 on 7 Nov 1997 | Our feed |
| Rate target before the float | 8 per dollar for most of 2008 | CBS 2008 annual report |
| Float date | 3 Nov 2008 | CBS 2008 annual report |
| Biggest single print | +81.3% on 17 Nov 2008 (8.8314 to 16.01) | Our feed |
| Median daily move | 0.21% | Our feed |
| Days with no change | 30.9% | Our feed |
| Longest flat stretch | 293 trading days at 5.1925 (Mar 2005 to Jul 2006) | Our feed |
One caution applies. The weakest and strongest closes are single prints, and a single print can be noise.
The November 2008 float on a daily chart
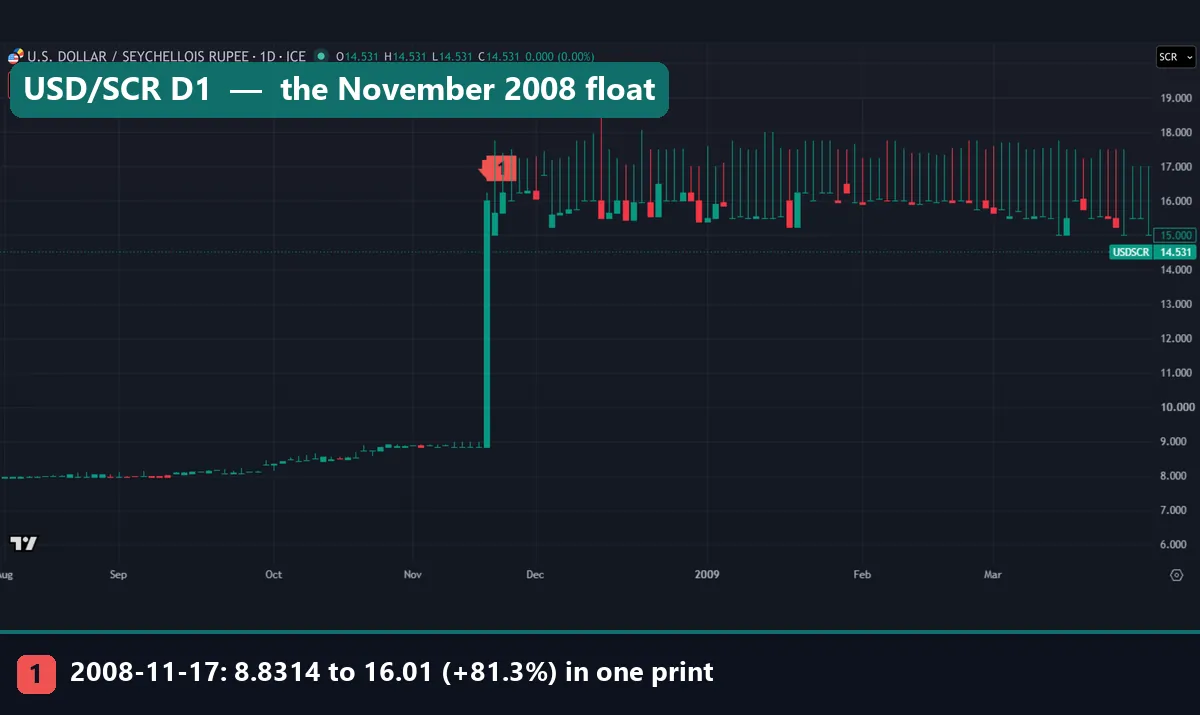
This daily chart runs from August 2008 to March 2009. Through August and September the bars hold near 8.0. During October they climb to about 8.9. Then comes the jump at marker 1. On 17 November 2008 our feed went from 8.8314 to 16.01 in one print, a rise of 81.3%.
Now compare the dates with the central bank’s account. The bank says the float took effect on 3 November, at an average of 14.2405 that day. Yet our feed kept printing near 8.83 for two more weeks, as the flat row of bars before the marker shows. So the 81.3% print is not one day of trading. Instead, it records a vendor quote catching up with a float that had already happened.
After the jump, the candle bodies stay between about 15 and 16.5 into March 2009. Upper wicks reach above 18 in December. The cost was real: the CBS report gives average inflation of 37% for 2008. It also says the weaker rupee and high fuel bills pushed up the rupee cost of imports. Our guide to how inflation affects forex covers that link from the market’s side.
The 2020 slide and the 2021 snap-back
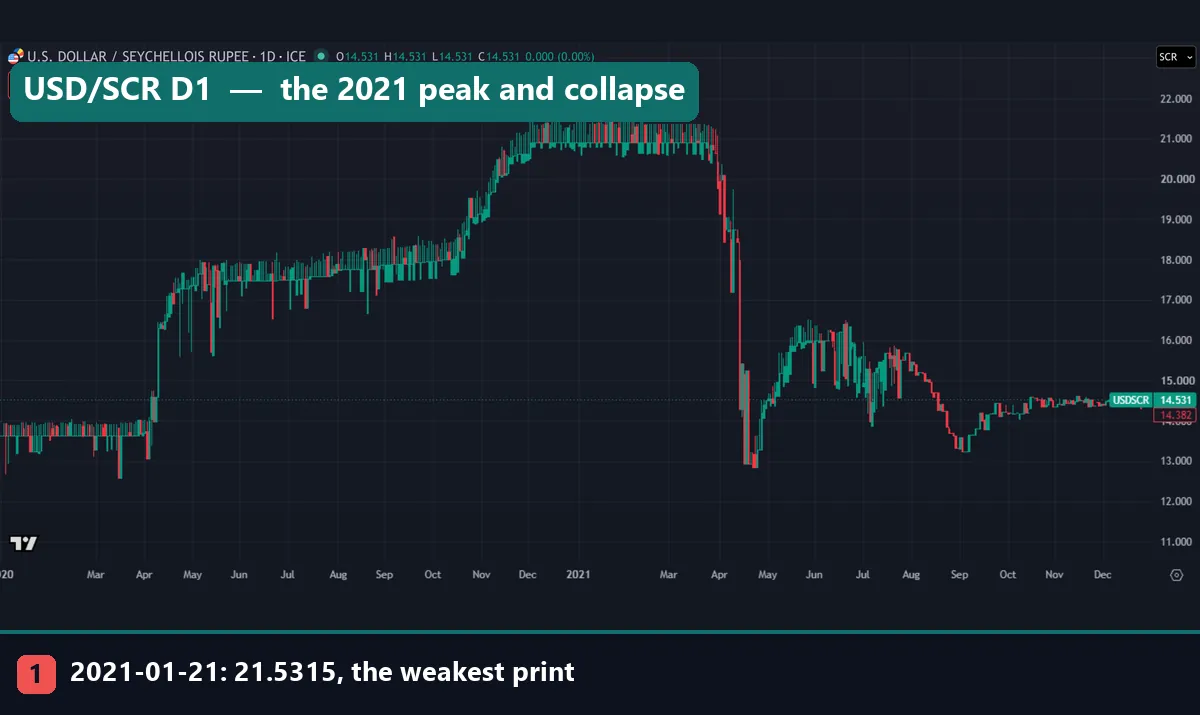
The second shock came with the pandemic. In early 2020 the rate held just under 14, then jumped in April. On 9 April our feed moved from 14.6 to 16.29, up 11.6%. It climbed again in October and November and spent the winter near 21. Marker 1 shows the weakest close in the whole history, 21.5315 on 21 January 2021. Over 2020 as a whole, the rupee lost 34.9% of its dollar value.
The fall reversed faster than it came. The IMF’s 2021 Seychelles staff report on the IMF eLibrary ties the slide to tourism, with receipts down 63% in 2020. After the border reopened on 25 March 2021, it says, the rupee rallied from almost 22 per dollar to almost 16. Our feed shows the turn in sharper steps. On 15 April it fell from 18.75 to 15.4321. On 20 April it fell again, to 12.94.
The ride stayed rough after that. From the April low near 13, the rate bounced toward 16 by July and dropped near 13.3 in September. It ended 2021 at 14.3819, a gain of 45.4% for the rupee over the year.
Worked example: 10,000 rupees through two shocks
Take 10,000 rupees held in a Seychelles bank account. Then price them in dollars at each year-end close from our feed.
- End of 2019, at 13.62 rupees per dollar: the sum is worth $734.21.
- End of 2020, at 20.91: it is worth $478.24, a loss of 34.9%.
- End of 2021, at 14.3819: it is worth $695.32, a gain of 45.4% on the year.
- On 16 November 2026, at 14.5308: it is worth $688.19.
Here is the lesson. A 45.4% gain followed a 34.9% loss, yet the saver still ended 2021 down 5.3%. Percentage moves do not cancel out. After a 34.9% fall, the rupee needed a 53.5% gain just to get back to where it started.
The float shows the same effect on a larger scale. At the end of 2007, at 7.9601 per dollar, 10,000 rupees bought $1,256.27. A year later, at 15.4, they bought $649.35, down 48.3%. The 43.3% rebound of 2009 lifted that to $930.23, still 26.0% short. Our currency converter handles sums like these. Still, use the central bank’s own daily rates for anything official.
Year by year in the data
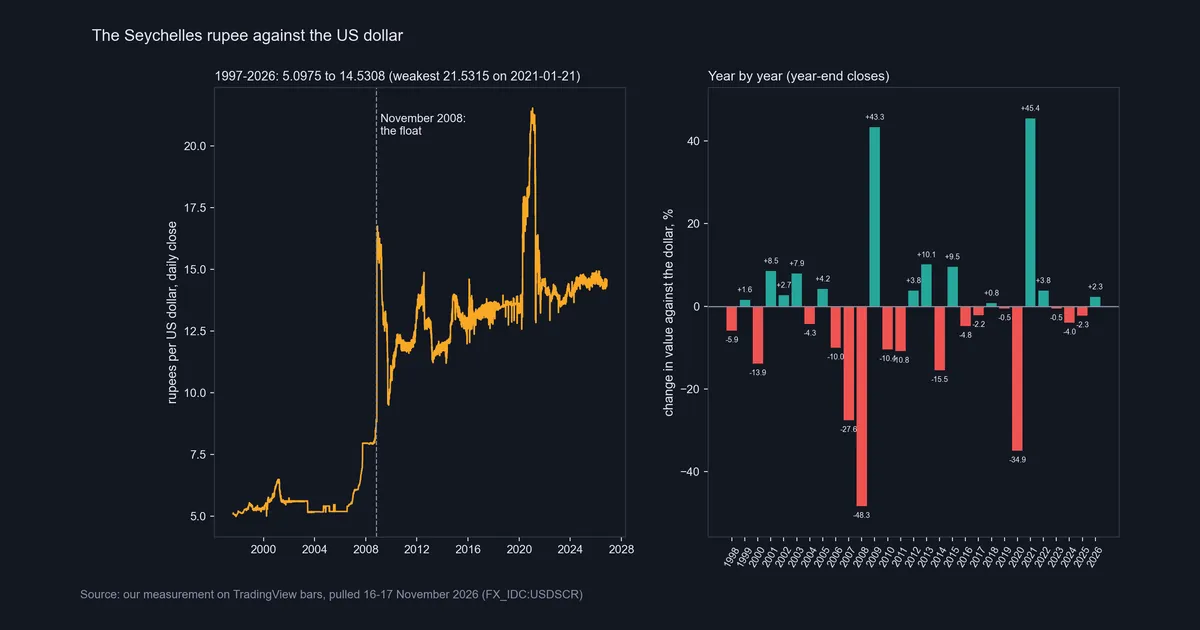
The left panel draws every daily close since 1997, with a dashed line at the 2008 float. The right panel gives the rupee’s change against the dollar for each year. Four bars dominate it: 2008, 2009, 2020 and 2021. Most other years stay within about 11% either way. The run-up to the float shows too, as the rupee lost 10.0% in 2006 and 27.6% in 2007.
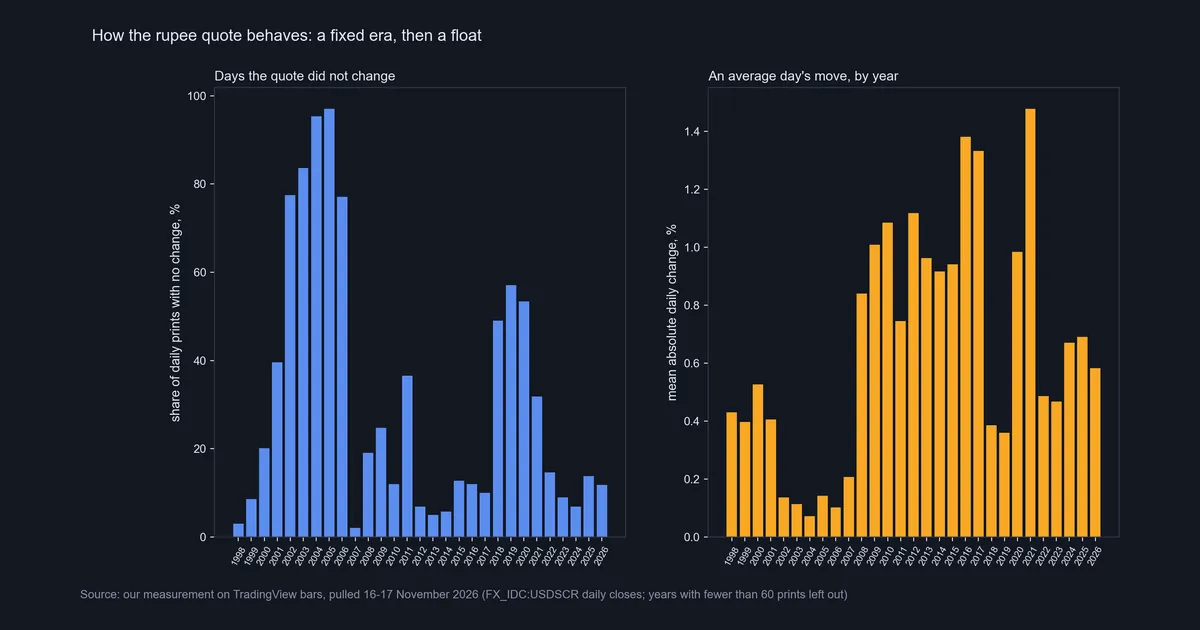
The second chart asks how the quote behaves, not where it went. In 2004 and 2005 more than 90% of daily prints showed no change. An average day moved well under 0.2%. That is how a fixed rate looks in a vendor feed. Our longest flat stretch sits in that era: 293 trading days at exactly 5.1925.
After the float the picture flips. An average day moved about 1% or more in most years from 2009 to 2017. Yet the unchanged share climbed back to about half in 2018, 2019 and 2020. For a floating currency, that more likely reflects a quote that updates less often.
Download the complete indicator database
Put these concepts on your charts. One email unlocks the full library of 1,380+ indicators with compiled MT4 and MT5 files, plus my TradingView scripts. No paywall, no spam, unsubscribe any time.
Get free access to my indicator database
One email unlocks 1,380+ free MT4, MT5 and TradingView indicators — the complete library. No single-tool download; you get the whole database.
Where it fails: limits of the USD/SCR feed
A free chart of a small currency answers some questions well and others badly. Seven limits showed up in ours.
- Our feed is not the central bank’s rate. FX_IDC carries a data vendor’s price. The central bank publishes its own daily averages from trading by banks, bureaux de change and authorised dealers. For a contract or a tax return, use those numbers.
- It can lag the real market. The float came on 3 November 2008, but our feed caught up only on 17 November. A study that dates the float from the feed lands two weeks late.
- Gaps hide the path. With 58 gaps longer than five days, some jumps span a week or more of trading.
- Flat lines can mean a stale quote. A flat stretch looks the same whether a central bank holds the rate or the vendor stops updating it.
- Stray prints remain. We dropped 43 clear outliers, but milder ones survive. Treat the 21.5315 extreme as an outer bound, not a level the market held.
- The quoted spread is wide. Every capture shows SELL 14.531 and BUY 15.281 in TradingView’s header, a gap of 0.75 rupee, or about 5% of the price. Our page on the spread in forex explains what such a gap costs.
- No volume at all. Every daily bar we pulled shows zero volume, so the chart cannot show how much money changed hands.
The rupee in 2026 and on the monthly chart
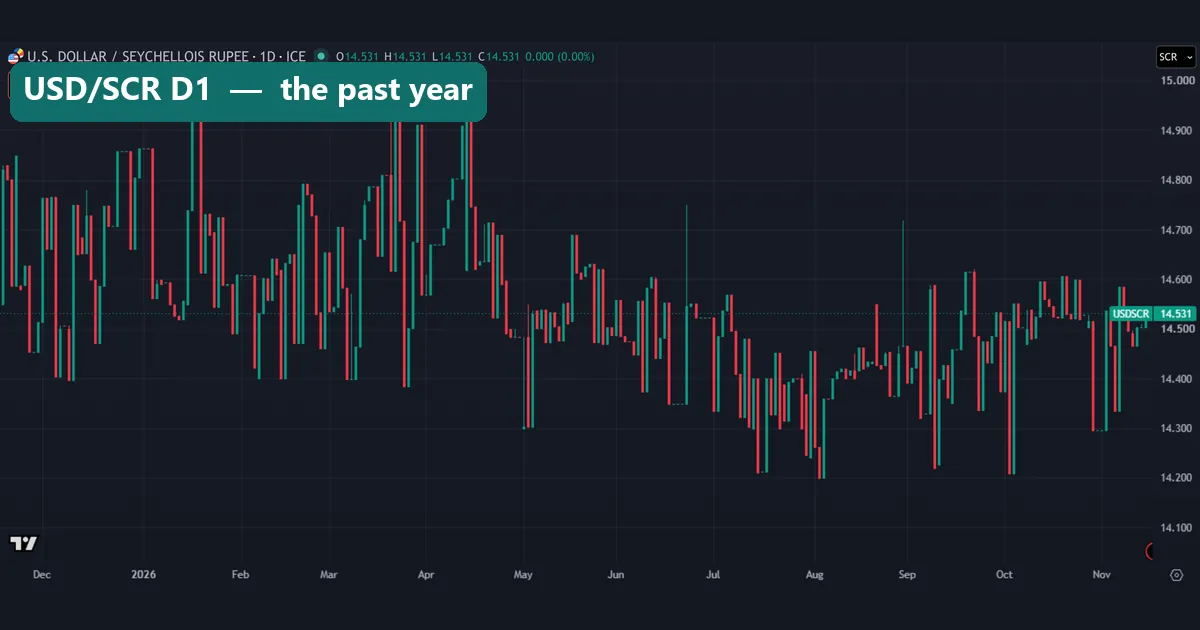
The past year looks calm from a distance and choppy up close. In 2026 so far, closes have ranged from 14.1991 to 14.9312, a band of about 5%. Yet single bars often span several tenths of a rupee. Highs near 14.9 came in January, March and April. Lows near 14.2 came between July and early October. On 16 November the rupee stood 2.3% stronger than at the end of 2025.
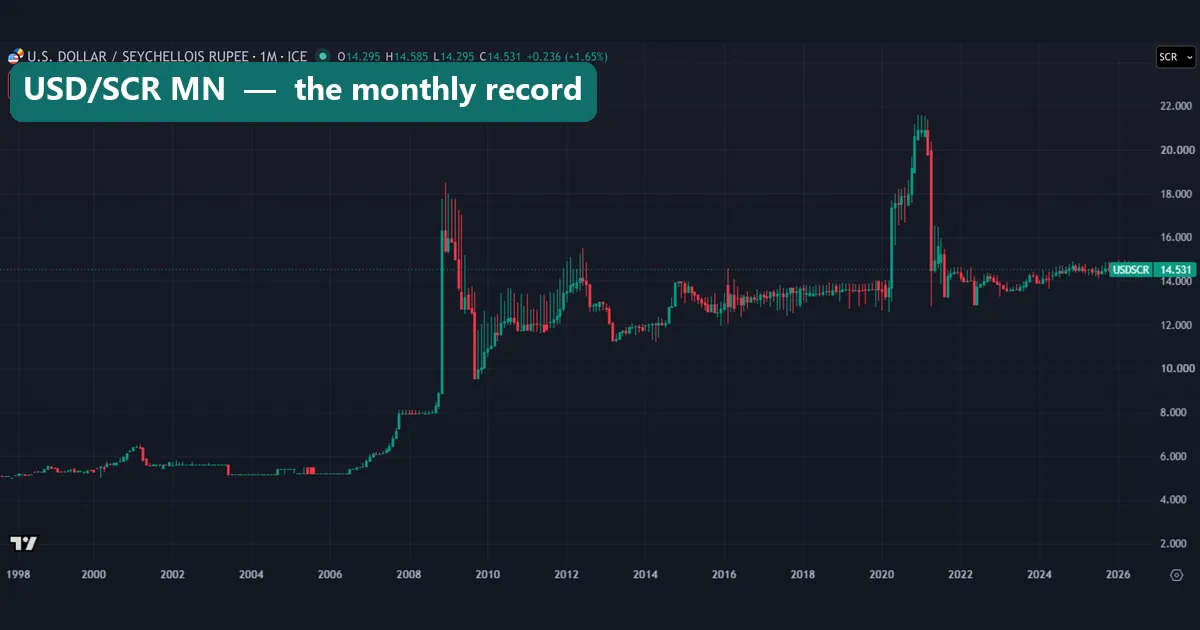
The monthly chart puts that band in context. The November 2026 bar opened at 14.295 and stood at 14.531 when we captured it. Since 2022 the bars have stayed between about 13 and 15. Calm spells have ended suddenly before, so a narrow band says little about next year.
Common mistakes with Seychelles rupee charts
- Reading the rate the wrong way round. USD/SCR counts rupees per dollar, so a rising line means a falling rupee.
- Treating the 81.3% print as one day of trading. It mixes a real float with two weeks of feed lag. The central bank’s 14.2405 for 3 November is the better first-day figure.
- Adding percentage changes. A 34.9% fall and a 45.4% rise do not net to a gain. Multiply the factors instead, as the worked example does.
- Calling the flat years stable. The flat lines of 2002 to 2006 show a managed rate and, at times, an idle quote. The parallel market of 2008 shows how an official number can hide real pressure.
Where to go next
These guides take the same themes further.
- Our weakest currency in the world ranking explains why a large number per dollar does not, by itself, make a currency weak.
- The most valuable currency in the world guide covers the other end of that scale.
- The Egyptian pound guide follows another currency whose chart moves in sudden steps.
- The Cape Verde escudo guide shows the opposite choice for an island economy: a fixed euro peg.
- The Trinidad and Tobago dollar guide covers another island currency whose quote sits still for months.
- Our fiat currency explainer covers what gives paper money like the rupee its value.
For primary sources, start with the central bank’s 2008 report and the IMF’s 2021 staff report, both linked above.
FAQ about Seychelles rupees
What is the currency code for Seychelles rupees?
The ISO code is SCR, and one rupee splits into 100 cents. The official symbol is R, and the Central Bank of Seychelles issues the notes and coins.
How many Seychelles rupees does one US dollar buy?
Our TradingView feed showed 14.5308 rupees per dollar on 16 November 2026. Bank and bureau rates differ from that quote, so check the central bank’s daily rates before you change money.
When did the Seychelles rupee start to float?
The central bank dates the float to 3 November 2008, when it also removed all exchange restrictions. Our feed shows the jump only on 17 November, because the vendor quote lagged.
Why did the rupee fall so far in 2020?
Tourism stopped. The IMF reports tourism receipts down 63% that year, so far fewer dollars and euros came in. The rupee lost 34.9% over 2020 and hit its weakest close in January 2021.
Why did the rupee recover in 2021?
The border reopened on 25 March 2021 and visitors came back, according to the IMF. The rupee then gained 45.4% over the year, and two single prints in April did much of the work.
Is the rupee tied to the dollar or the euro?
No. It has floated since November 2008. In its 2021 programme with the IMF, the central bank said it would intervene only to calm disorderly markets and to build reserves.
Can I trust a free USD/SCR chart?
Trust it for the broad shape over years, not for single days. Our feed lagged the 2008 float by two weeks, skips dates and carries no volume. It also showed a 0.75-rupee gap between buy and sell.
Will Seychelles rupees hold their current value?
Nobody can say. Since 2022 the rate has stayed between 13.25 and 14.9312, but the 2008 and 2020 shocks both arrived within weeks. Treat these numbers as history, not a forecast: results are not guaranteed; past performance is not indicative of future results.
Last updated: 17 November 2026.

About the author
Written by Dominic Walsh, a Forex trader and MT4/MT5 indicator, Expert Advisor and script developer. Every tool on forexmt4systems.com is tested on live charts before release and ships with ready-to-use compiled MT4 (.ex4) and MT5 (.ex5) files. Learn more about the trader and developer behind this site.
How we build, test and correct every tool: Editorial & Testing Policy. Trading carries risk; see the disclaimer.