
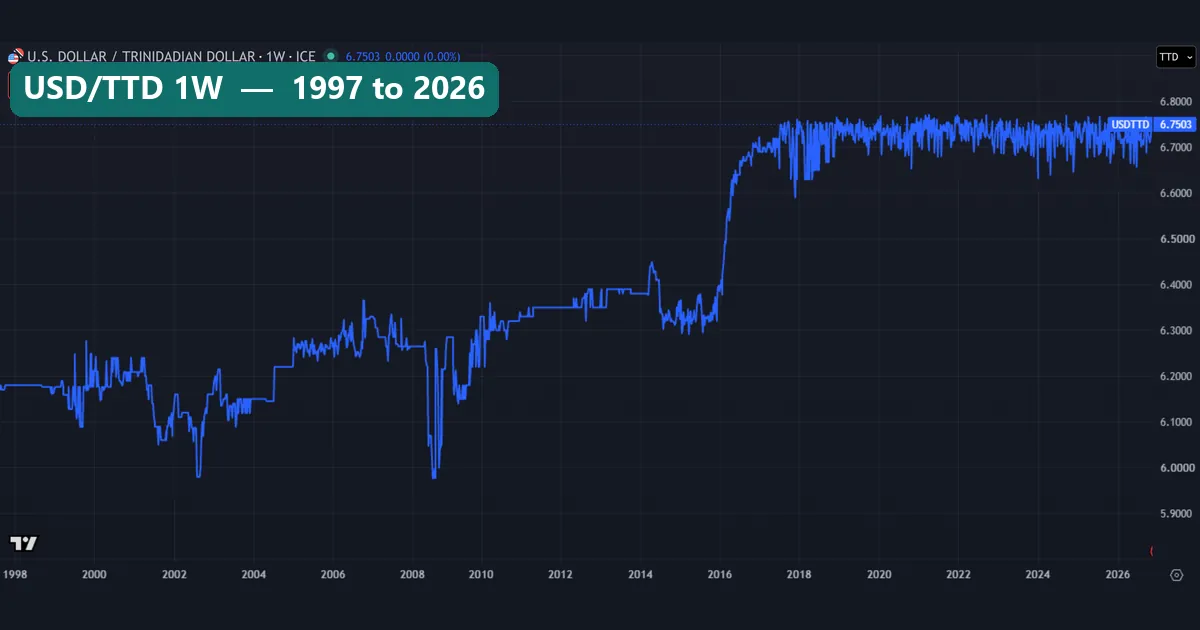
The TTD currency is the Trinidad and Tobago dollar, and on the feed we measured it lost just 8.4% against the US dollar from August 1997 to November 2026. That small figure hides an odd chart. The rate sat still for months, stepped up hard in 2016, and has held a band under 3% wide since 2017. Using our own data, we answer three things here: how the rate is run, how it moved, and which parts of the feed to distrust.
What the TTD currency is
TTD is the three-letter code for the Trinidad and Tobago dollar. It follows the ISO 4217 currency code standard at iso.org: the first two letters copy the country code, and the third, where possible, matches the first letter of the currency name. So TT plus D makes TTD.
The country introduced its own dollar in 1964, according to the Trinidad and Tobago dollar entry on Wikipedia, and each dollar splits into 100 cents. On a chart you meet it as USD/TTD, the number of TT dollars one US dollar buys. Our last daily close, on Friday 13 November 2026, was 6.7503.
That level says nothing about quality, as our guide to the most valuable currency in the world explains. The more useful fact for traders: the TT dollar trades as a thin, exotic quote, and its feed’s quirks shape every number below.
How the central bank runs the TT dollar
The Central Bank of Trinidad and Tobago’s page on exchange rate management says the country adopted a floating exchange rate regime in April 1993. In practice, the same page adds, the system works as a managed float, and the Bank may intervene to contain “undue volatility in the exchange rate”. It also licenses the authorised dealers, such as commercial banks, that sell foreign currency to the public.
So the TT dollar sits between a peg and a free float. Supply and demand move it, while the central bank leans against sharp swings. Our guide on whether central banks trade forex covers how such intervention works.
Two formulas cover every figure here. First, the inverse quote:
TT dollar in US dollars = 1 / (USD/TTD)
At 6.7503, one TT dollar is worth 0.1481 US dollars. Second, the change in the TT dollar’s value:
value change = (old rate / new rate) - 1
A higher USD/TTD means a weaker TT dollar, so the old rate goes on top. Across our window that gives 6.18 / 6.7503 – 1 = -8.4%.
How we tested
We pulled FX_IDC:USDTTD on the TradingView web chart on 16 November 2026. Daily closes run from 18 August 1997 to 13 November 2026, a total of 7,134 prints, and the unfinished 16 November bar stayed out. The chart header credits ICE as the source, and TradingView’s USD/TTD symbol page carries the same series. So read it as a reference quote, not a dealing price.
First, we removed one bad close: 6.395 on 16 June 2016, a one-day break the next print undid. Then we measured each year’s value change from one year-end close to the next. We also counted unchanged days, took the median daily move, and found the longest flat stretch: a run of closes within 0.5% of the close that opens it.
We placed no trades, so no figure includes spread, swap or commission. Both bar charts are our own measurement, and our editorial testing policy explains how we handle vendor data.
The measured numbers at a glance
Rates are TT dollars per US dollar, so a higher rate means a weaker TT dollar.
| Measure | Value | Date or window |
|---|---|---|
| Daily prints measured | 7,134 | 18 Aug 1997 to 13 Nov 2026 |
| First and last close | 6.18 and 6.7503 | 18 Aug 1997; 13 Nov 2026 |
| Change in the TT dollar’s value | -8.4% | Whole window |
| Weakest TT dollar (highest close) | 6.7777 | 27 Mar 2018 |
| Strongest TT dollar (lowest close) | 5.95 | 13 Aug 2002 |
| Range of closes since 2017 | 6.5888 to 6.7777 | 2017 to 2026 |
| Median daily move (absolute) | 0.01% | Whole window |
| Days with no change | 45.8% | Whole window |
| Longest flat stretch | 407 days within 0.5% of 6.38 | 6 Sep 2012 to 28 Mar 2014 |
| Largest yearly loss | -4.4% (6.3975 to 6.6893) | 2016 |
| Largest one-day jump in the rate | +3.98% (5.977 to 6.215) | 11 Aug 2008 |
A typical day barely moves, yet a handful of prints jump 2% to 4%. Most of those come from 2008, and the failures section explains why we distrust them.
Reading USD/TTD on a chart
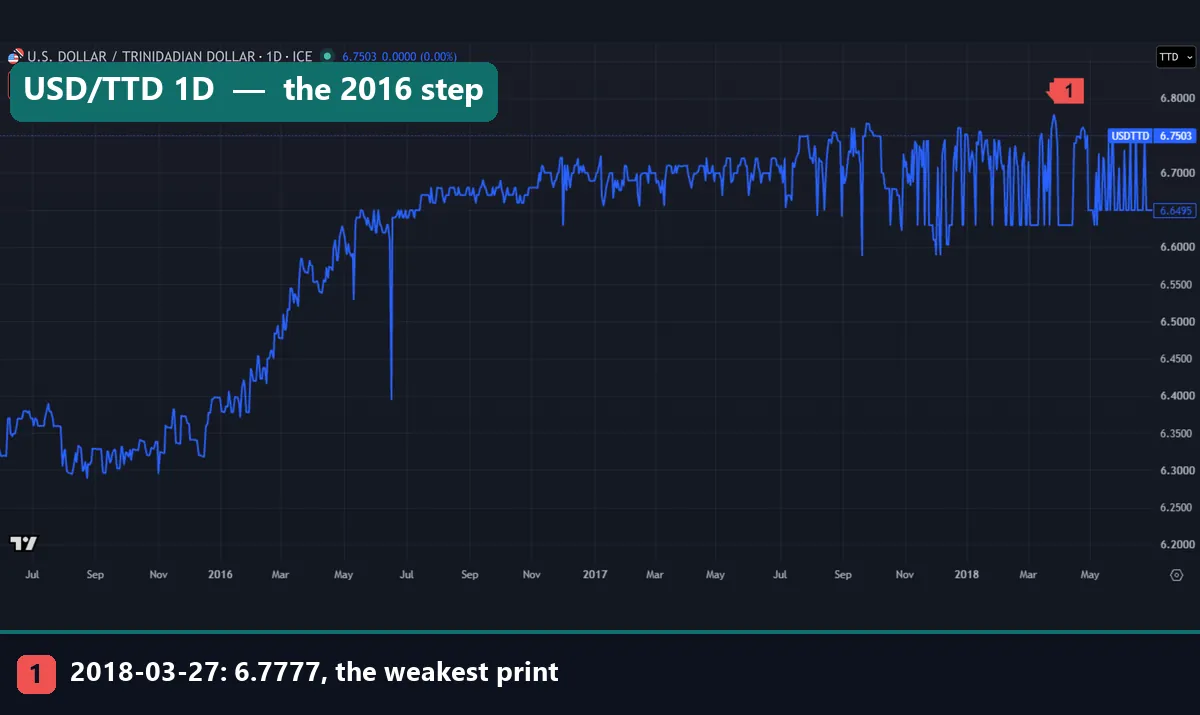
The daily chart from mid-2015 to mid-2018 holds the biggest change in the series. Through late 2015 the rate drifts between about 6.30 and 6.40. From early 2016 it climbs with hardly a pause, and the year closes at 6.6893.
Marker 1 sits on the weakest TT dollar print in our window: 6.7777 on 27 March 2018. From late 2017 the line stops drifting and flickers between roughly 6.63 and 6.77. That comb shape comes from the data, not from a currency swinging 2% a day. The yearly figures confirm it: the TT dollar lost 0.9% in 2017 and 0.2% in 2018.
Two needles also stand out. The June 2016 drop toward 6.40 matches the 6.395 print we removed. Then, in September 2017, a one-day close at 6.5888 gives way to 6.7485, which our list of big moves records as +2.42% on 21 September. We read it as a stray quote, not a revaluation.
The flat years of 2012 to 2014
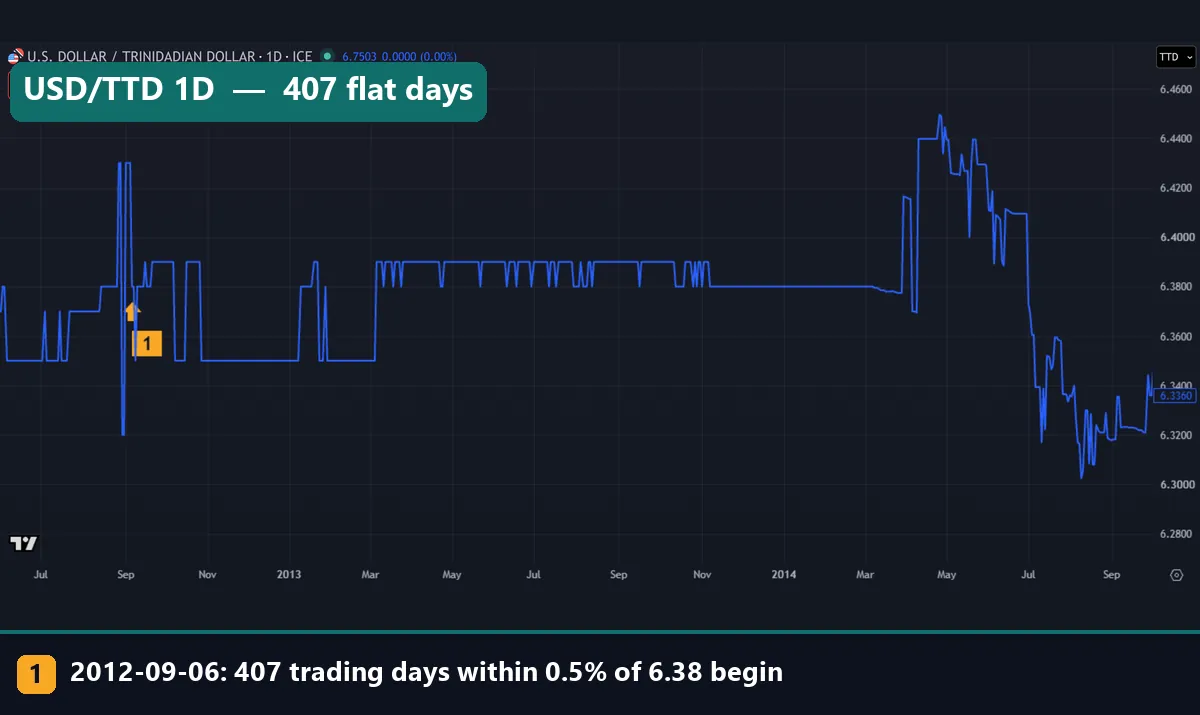
Quiet spells say as much about this currency as its jumps. Marker 1 sits on 6 September 2012, the first day of our longest flat stretch. For 407 trading days, through 28 March 2014, every close stayed within 0.5% of 6.38. The low was 6.35 and the high 6.39.
The line hops between a few fixed levels, then runs dead level near 6.38 from about November 2013. That step-like path fits a managed rate: small, round moves, and many days that repeat the one before. The run ended in early April 2014, when the rate stepped above the band. Closes that year then ranged from 6.282 to 6.4495.
Two other long runs show up too. Closes held near 6.18 for 384 days, from August 1997 to May 1999, and near 6.15 for 226 days, from August 2003 to July 2004.
Worked example: converting at the 13 November 2026 close
Say you need to price 500 US dollars in TT dollars at our last close. Multiply: 500 x 6.7503 = 3,375.15 TT dollars. To go the other way, divide: 1,000 TT dollars / 6.7503 = 148.14 US dollars. Our currency converter runs the same sums.
Now check the screenshot header. It showed a sell quote of 6.7503 and a buy quote of 6.7780, a gap of 277 points. At the buy quote, 500 US dollars costs 3,389.00 TT dollars. That is 13.85 more, or about 0.41% of the rate. Our guide to bid-ask spread calculation shows the method.
Next, the long view. In August 1997, 1,000 TT dollars bought 161.81 US dollars at 6.18. At 6.7503 they buy 148.14, which is the 8.4% loss in 29 years.
Finally, the worst year. At the end of 2015, at 6.3975, 1,000 TT dollars equalled 156.31 US dollars. A year later, at 6.6893, they equalled 149.49. That drop of 4.4% is the largest of any calendar year in our window.
Year by year: the range and the quiet days
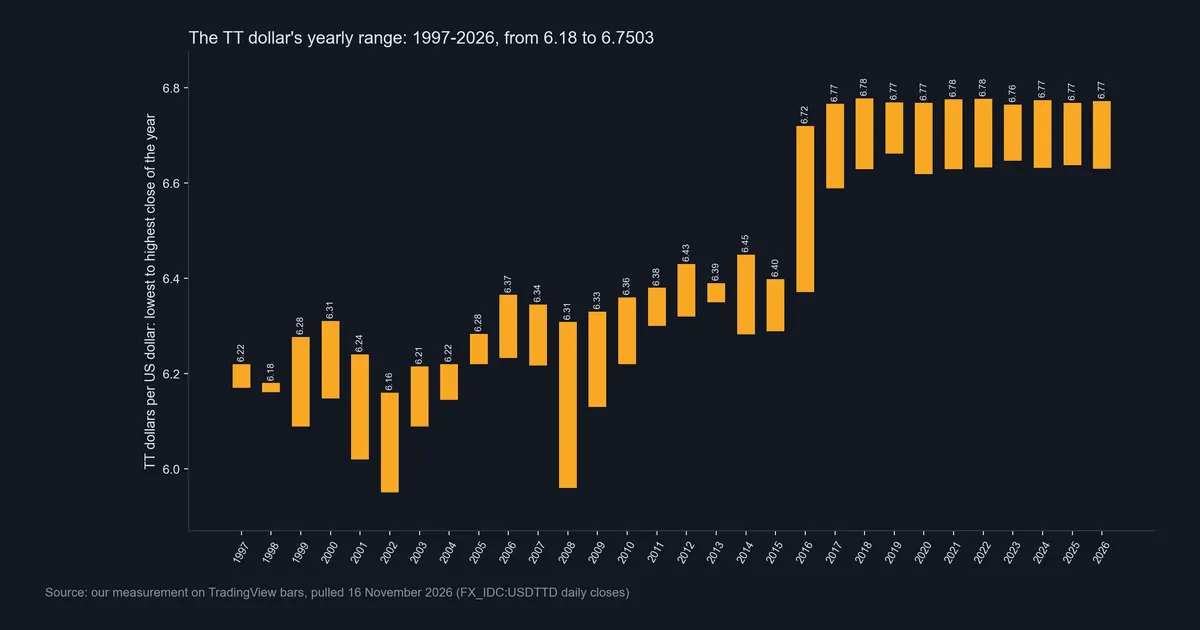
Our first data chart shows each year’s lowest and highest daily close. Before 2016 the bars sit between 5.95 and 6.4495. The widest of them, 2008, spans 5.96 to 6.308, mostly because the feed jumped between levels. Then the 2016 bar runs from 6.3715 to 6.72. From 2017 on, every yearly high lands between 6.765 and 6.7777.
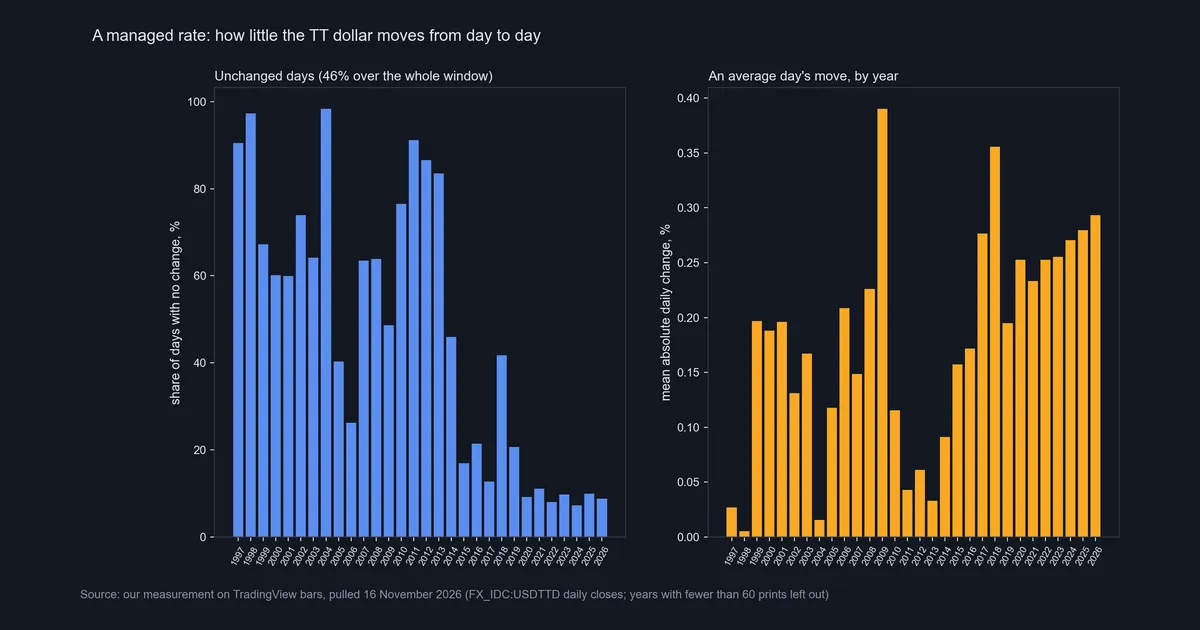
The second chart splits the calm two ways. On the left sits the share of unchanged days: 46% over the whole window, above 90% in 1998 and 2004, but near one day in ten since 2020. On the right sits the average daily move, which peaks in 2009 and 2018 and stays high from 2020.
Here is the catch. Busier days have not produced bigger years, since the TT dollar’s value changed by 0.6% or less in every year from 2018 to 2026. So the lively recent feed mostly shows noise around a steady level.
Download the complete indicator database
Put these concepts on your charts. One email unlocks the full library of 1,380+ indicators with compiled MT4 and MT5 files, plus my TradingView scripts. No paywall, no spam, unsubscribe any time.
Get free access to my indicator database
One email unlocks 1,380+ free MT4, MT5 and TradingView indicators — the complete library. No single-tool download; you get the whole database.
Where it fails
Every number here comes from one vendor feed, and that feed has weak spots.
- FX_IDC is not the official TT dollar rate. It gives a data vendor’s reference series. The rates people get come from authorised dealers, each with its own margin.
- Single prints mislead. The rate jumped 3.98% from 5.977 to 6.215 on 11 August 2008, then fell 2.19% on 11 September, rose 2.9% on 2 October and fell 2.65% on 10 October. Without a central bank record to confirm them, we treat these as thin or noisy quotes.
- Highs and lows hold more errors than closes. Wicks catch stray ticks that no close reached, which breaks range and stop tests.
- Volatility tools overstate risk. The flicker since 2017 inflates readings such as ATR in trading, while the yearly change stays under 1%.
- The spread is wide. Our capture showed 277 points, about 0.41% of the rate.
- Policy can shift. A managed float can still step, as 2016 showed, and nothing here works as a forecast.
- Our window starts in 1997. So it says nothing about the years right after the 1993 float.
The last twelve months and the long view
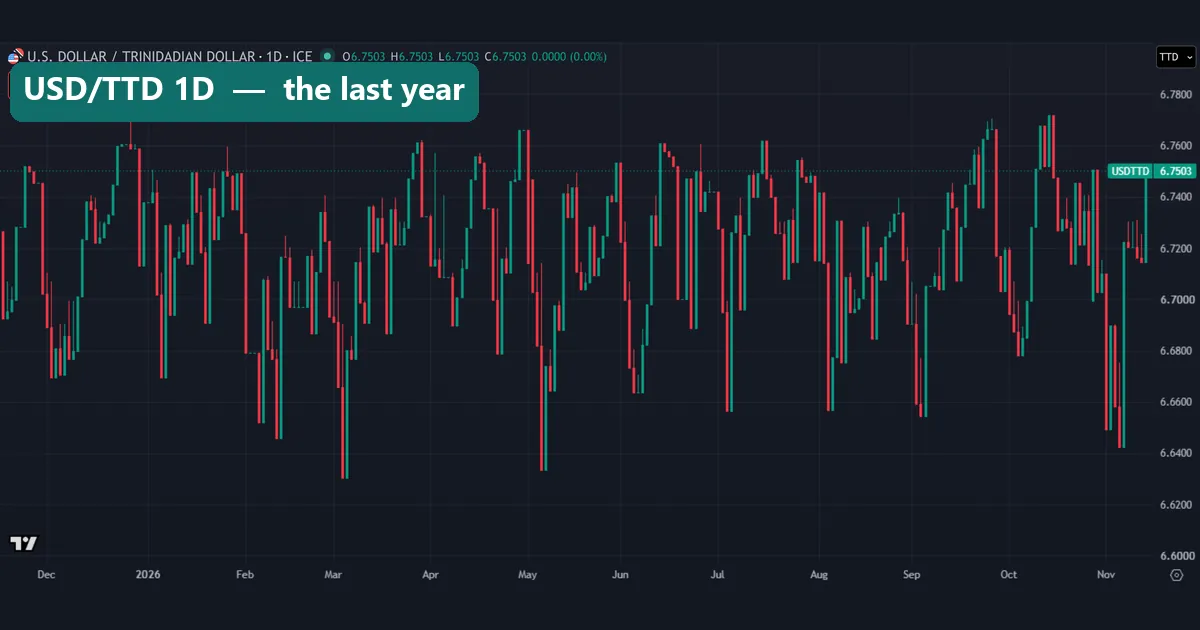
The daily candles from November 2025 to November 2026 show today’s pattern up close. Many candles span most of the band in one day, then reverse. Yet every 2026 close sits between 6.6302 and 6.772, and the TT dollar has lost only 0.2% this year. The last close, 6.7503, lies near the top of that range.
So a tall candle here says little about real buying or selling. The usual reading of candlestick wicks does not transfer cleanly to a thin exotic series.
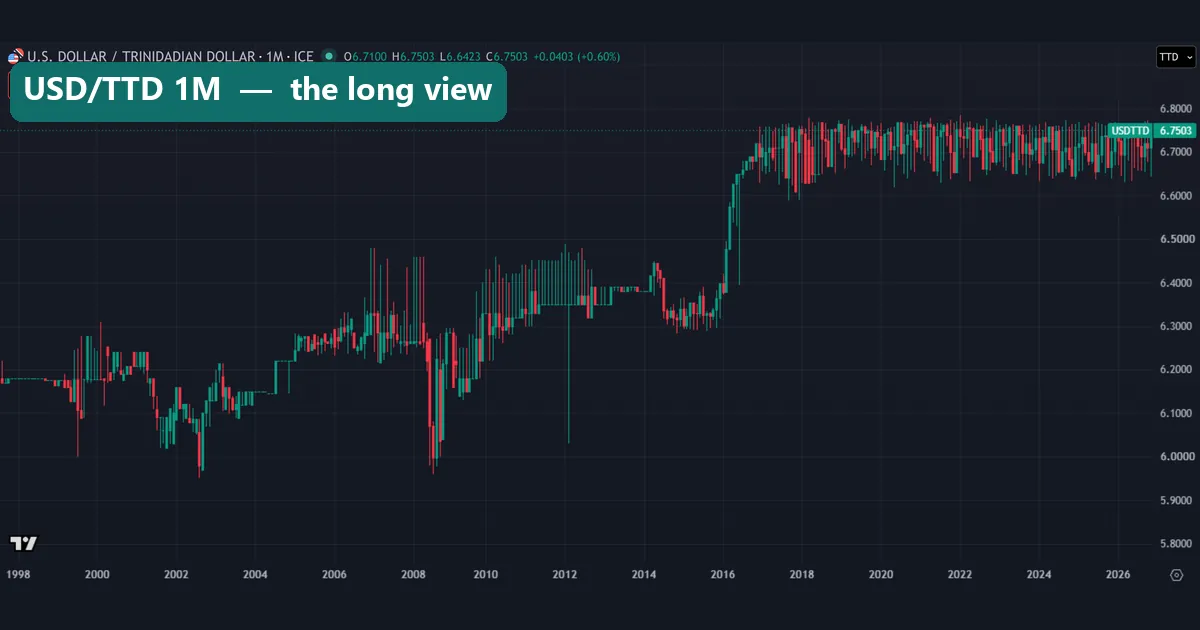
The monthly chart puts the whole story on one screen. It starts near 6.18, dips to 5.95 in 2002 and 5.96 in 2008, climbs slowly toward 6.40, steps up in 2016 and then holds the band. Watch the wicks, though. In 2012 a thin wick reaches below 6.10, yet that year’s lowest close was 6.32. In 2016 another touches the 6.40 area, where our removed bad print sits.
Common mistakes with the TT dollar
1. Getting the direction of USD/TTD backwards. A rising USD/TTD means a weakening TT dollar. The 2016 move from 6.3975 to 6.6893 meant a 4.4% loss, not a gain.
2. Calling one print a crash. A lone close like 6.5888 in September 2017 can reverse the next day. Check the following prints first.
3. Taking the screen rate as your cash rate. Banks and bureaus quote their own buy and sell prices, and even the vendor showed a 277-point gap.
4. Mistaking a quiet decade for a fixed peg. The central bank calls the system a managed float, and 2016 shows such a rate can still step 4.4% in a year. A formal tie works differently, as our guide to the Macau pataca and its link to the Hong Kong dollar shows.
Where to go next
To place the TT dollar among other currencies, start with our ranking of the weakest currency in the world. For another slow mover in the Americas, read the Honduras lempira guide. El Salvador instead adopted the US dollar, as our San Salvador money guide explains. For a currency that lost far more, see Sri Lanka rupees.
Our page on the dollar index in forex covers the US half of the pair. To judge any feed before trusting it, read our guide to real-time data on TradingView. The outside sources behind this page appear earlier: the central bank’s exchange rate page, the ISO code standard, Wikipedia’s TT dollar history and TradingView’s USD/TTD symbol page.
FAQ about the TTD currency
What does TTD stand for?
It is the ISO 4217 code for the Trinidad and Tobago dollar: TT for the country, D for dollar. Each dollar holds 100 cents.
How many TT dollars buy one US dollar?
On our feed, 6.7503 at the close of 13 November 2026. Banks and bureaus quote their own buy and sell rates around that level.
Does the central bank fix the TT dollar’s rate?
Not formally. It describes a managed float in place since April 1993. Still, the rate has stayed between 6.5888 and 6.7777 since 2017, which can look like a peg.
What was the weakest TT dollar rate in your data?
The highest USD/TTD close was 6.7777 on 27 March 2018. The strongest TT dollar close was 5.95, on 13 August 2002.
Why did the rate jump in 2016?
Our data shows the step, not its cause. The rate ended 2015 at 6.3975 and 2016 at 6.6893, a 4.4% loss. None of our sources explains it, so we do not guess.
Did the TT dollar really move almost 4% in a day in 2008?
The feed shows 5.977 to 6.215 on 11 August 2008, a 3.98% jump, and more large swings by mid-October. Without central bank confirmation, we read them as thin or noisy quotes.
Why does the chart flicker so much since 2017?
The feed alternates between levels about 2% apart, often from day to day. Yet the yearly change stayed at 0.6% or less from 2018 to 2026, so most of the flicker comes from noise.
Can I trade USD/TTD?
The TradingView series gives a reference quote, not a dealing price. If a platform offers the pair, compare its spread with the 277-point gap we saw, and expect gaps in the data. Treat this history as background only: results are not guaranteed; past performance is not indicative of future results.
Last updated: 16 November 2026.

About the author
Written by Dominic Walsh, a Forex trader and MT4/MT5 indicator, Expert Advisor and script developer. Every tool on forexmt4systems.com is tested on live charts before release and ships with ready-to-use compiled MT4 (.ex4) and MT5 (.ex5) files. Learn more about the trader and developer behind this site.
How we build, test and correct every tool: Editorial & Testing Policy. Trading carries risk; see the disclaimer.