
The shark pattern is a five-point harmonic reversal shape that Scott Carney introduced in 2011, and this guide settles one practical question: does it tell you anything on forex charts? We explain the 0-X-A-B-C structure, show the ratios, walk through six real charts, and then report what happened after 102 daily and 33 hourly sharks in our own MT4 data. The short answer is plain. On daily charts, the shark did about as well as a random day.
What the shark pattern is
The shark belongs to the harmonic family, next to the Gartley, the bat and the butterfly. You can see how they relate in our list of harmonic patterns. Like its cousins, it is a zigzag of swings whose legs must fit set Fibonacci ratios.
Most harmonic shapes use the names X, A, B, C and D. The shark instead starts one point earlier. Carney labels the points 0, X, A, B and C, so the last point is C, not D. On our charts the zero is drawn as the letter O.
Also, the shark has an unusual middle. In a Gartley, point B stays inside the XA leg. In a shark, the AB leg runs past X, to 1.13 to 1.618 times the XA leg. Then the last leg, BC, runs even further, to 1.618 to 2.24 times AB. That gives the pattern its look: two small swings, then one long thrust that overshoots the origin. Carney’s own write-up of the shark pattern at Harmonic Trader treats point C as the place where that thrust should run out of fuel.
How the shark pattern works: the ratio rules
Every leg is measured in price, from one swing to the next. Then each leg is compared with the one before it. Here is the logic for a bullish shark, where C is a low:
- O to X: price rallies from the origin O to a swing high X.
- X to A: price drops to a swing low A. This is the reference leg.
- A to B: price rallies past X. AB must equal 1.13 to 1.618 times XA.
- B to C: price falls hard, well below A. BC must equal 1.618 to 2.24 times AB.
A bearish shark is the mirror image. In short, the formula is two division checks: AB / XA between 1.13 and 1.618, and BC / AB between 1.618 and 2.24. If you want to refresh how those multiples are drawn, our guide on how to draw a Fibonacci extension covers the tool step by step.
Carney adds a second test on top of these legs. He looks at the whole first swing, O to X. For him, C should land in a zone between the 0.886 retracement and the 1.13 extension of that 0X leg. Many traders also check the difference between a retracement and an extension before they draw one.
Carney’s completion zone vs our simplified rule
We did not code the full Carney zone. Instead, our scan used only the two leg ratios above. That keeps the rule simple. Still, it means some of our sharks would fail Carney’s 0.886 to 1.13 test.
So treat our result as a test of the shape, not of every filter Carney uses. His method also has more parts, such as reaction targets and a link to his 5-0 pattern. We left those out on purpose. They add choices that are easy to bend after the fact.
The worked example below shows the gap in practice. There, point C ran well past the Carney zone, yet our rule still counted it.
How we tested
We ran two tests, both on Capital Point Trading MetaTrader 4 history, build 1471, read straight from the terminal’s history files. The daily test covered 23 FX pairs from 12 June 2018 to 24 August 2026. Then the hourly test used H1 history for 4 symbols from the same terminal.
First, we marked swing points with a 3-bar pivot: a bar whose high or low beats the bars on each side. Next, we looked for five alternating pivots O, X, A, B and C within 120 bars that met both shark ratios. Because a 3-bar pivot needs time to confirm, we measured the outcome from 3 bars after C. That is the first moment a trader could know C was a swing.
Then we asked: was the close 5 bars later, and 10 bars later, in the expected direction? For a bullish shark that means higher; for a bearish one, lower. Finally, we compared that with all bars. Every figure is before spread, swap and commission.
The chart examples come from the TradingView web chart with OANDA data, captured on 9 October 2026. We drew the O-X-A-B-C lines from the exact pivot bars our code found. Our editorial testing policy explains how we pick data and report results.
Shark settings and parameters
There are no indicator inputs here, only ratio bands and a few scan choices. The table lists Carney’s numbers next to the ones our scan used.
| Parameter | Carney’s shark | Our scan |
|---|---|---|
| Point names | 0, X, A, B, C | O, X, A, B, C (same points) |
| AB vs XA | 1.13 to 1.618 | 1.13 to 1.618 |
| BC vs AB | 1.618 to 2.24 | 1.618 to 2.24 |
| C vs the 0X leg | 0.886 retracement to 1.13 extension | Not checked |
| Swing detection | Trader’s judgment | 3-bar pivots |
| Maximum span | Not fixed | 120 bars |
| Signal bar | At C | 3 bars after C |
| Outcome window | Trader’s targets | Close 5 and 10 bars later |
A wider pivot finds fewer, larger sharks; a narrow one, like ours, finds more small ones. Our ZigZag formula guide shows the same trade-off for swing tools in general.
Reading a shark on a chart
Start with the outer frame. Find O and X first, then check whether A pulls back inside that leg. Next, watch for B to break past X. That break is the shark’s signature. If B stays inside XA, you are looking at a different pattern, such as a Gartley pattern.
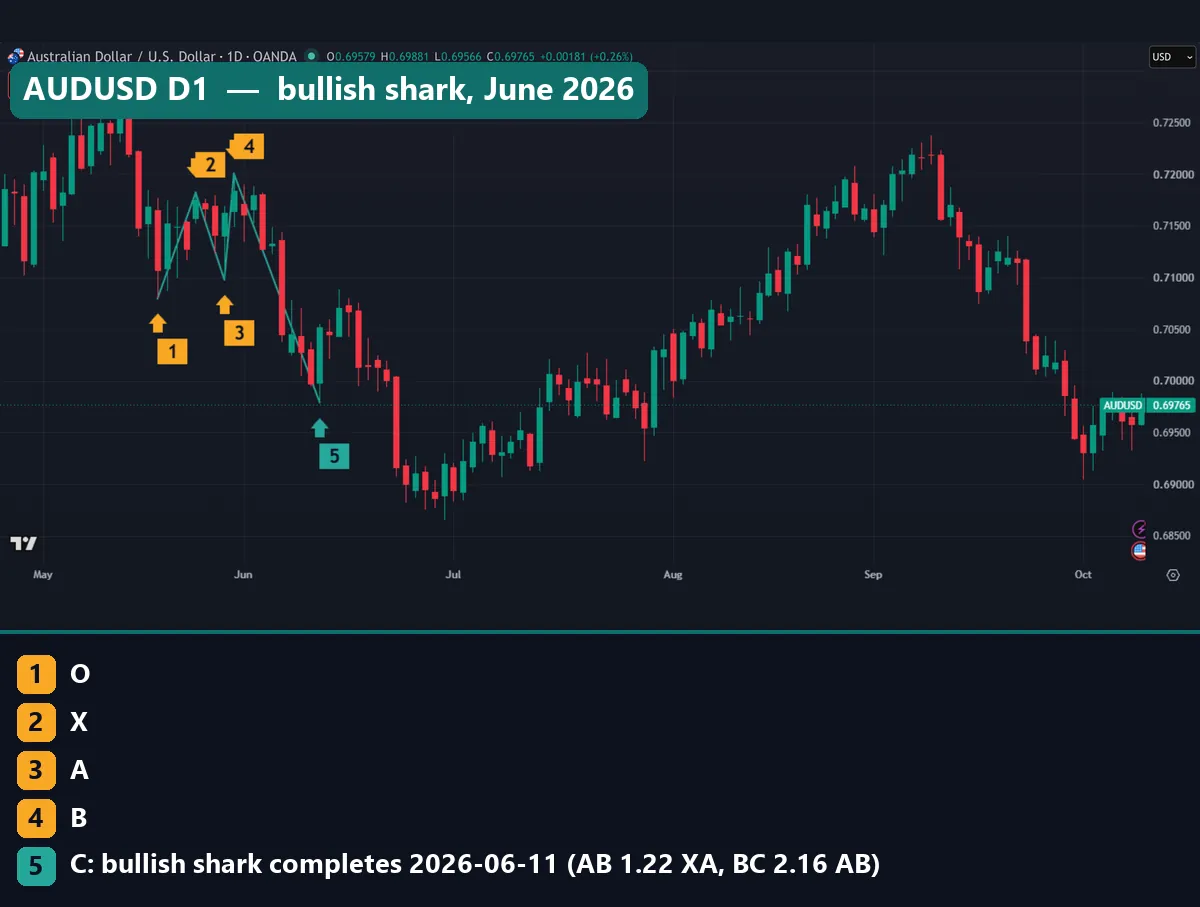
The AUDUSD daily chart above shows a bullish shark. O sits at 0.70796 on 19 May 2026 and X at 0.71822 on 25 May. Then A falls to 0.70979 on 28 May, and B pokes above X to 0.72006 one day later. Finally, C drops to 0.69789 on 11 June. The ratios are 1.22 for AB and 2.16 for BC, so both sit inside the bands. Yet the bounce after C was small. On the chart, price lifted for a few days and then fell below 0.69 later in June.
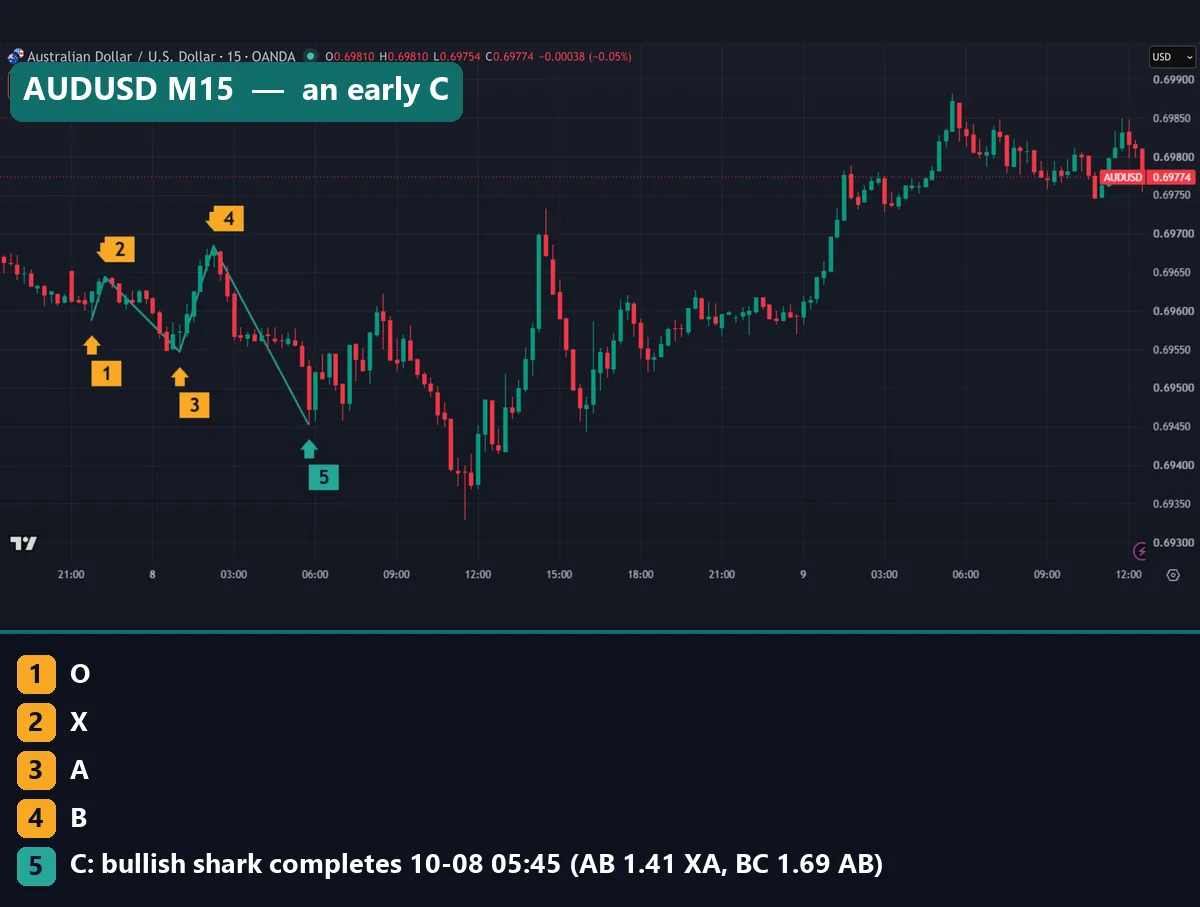
The second chart is AUDUSD on M15. Here the bullish shark completes at 0.69453 at 05:45 UTC on 8 October 2026, with ratios of 1.41 and 1.69. However, price did not turn right away. Instead, it slid further, to around 0.6935 near midday, before it rallied above 0.697 the next day. So a shark C can be early, even when the reversal does come.
Worked example: EURUSD daily, July to August 2026
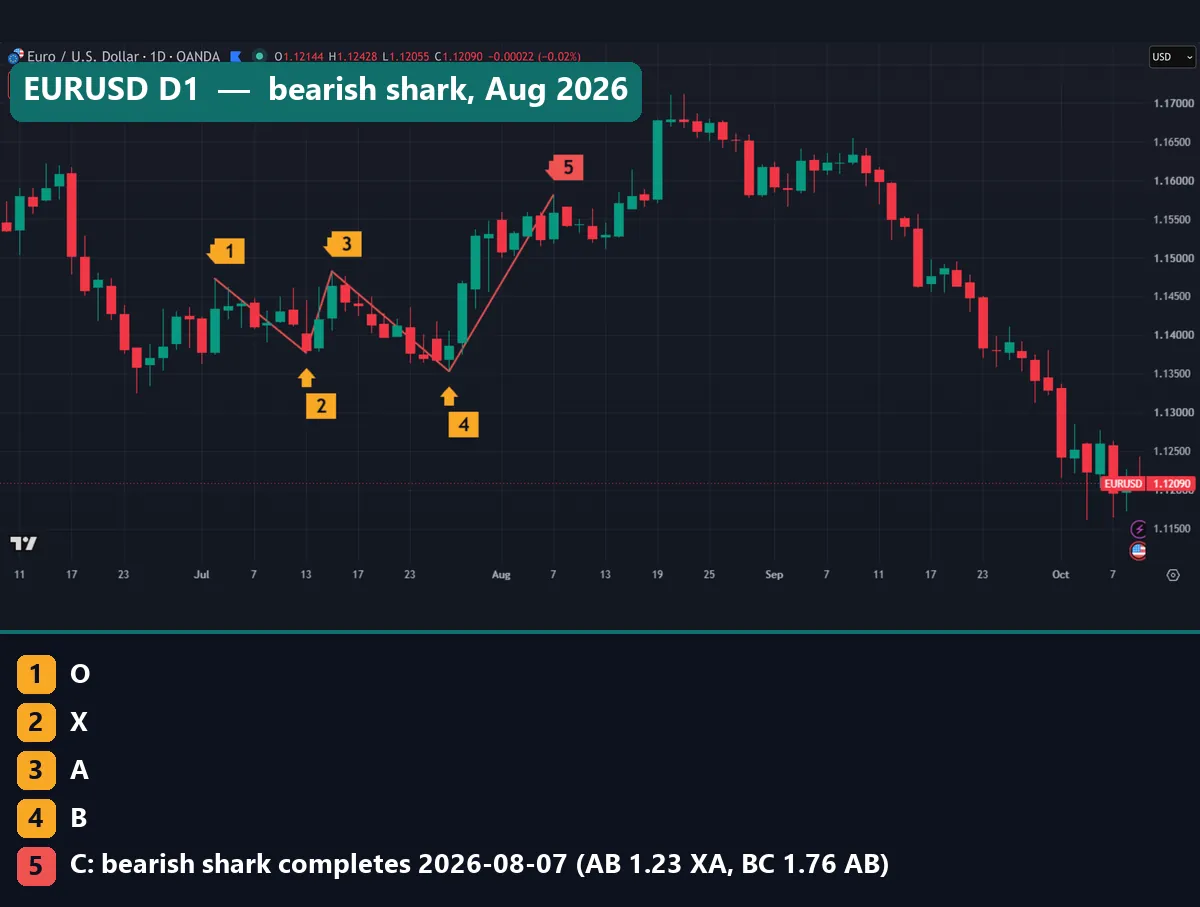
The first image in this guide shows a bearish shark on EURUSD daily. Here are its five points, taken from the pivot bars.
- O: 1.14730 on 2 July 2026 (a swing high)
- X: 1.13775 on 13 July (a swing low)
- A: 1.14824 on 15 July
- B: 1.13532 on 28 July, below X
- C: 1.15808 on 7 August
Now check the legs. XA is 1.14824 minus 1.13775, or 104.9 pips. AB is 1.14824 minus 1.13532, or 129.2 pips. So AB divided by XA is 1.23, inside the 1.13 to 1.618 band. Next, BC is 1.15808 minus 1.13532, or 227.6 pips. Divided by AB, that gives 1.76, inside the 1.618 to 2.24 band. Both tests pass.
Next, apply Carney’s extra check. The 0X leg runs from 1.14730 down to 1.13775, which is 95.5 pips. Its 0.886 retracement sits near 1.1462, and its 1.13 extension near 1.1485. Point C, at 1.15808, overshot that zone by roughly 95 pips. In other words, our scan counts this shark, but a strict Carney trader would not.
What happened next? The chart shows price kept climbing for about two weeks, to near 1.17 in the second half of August. Only in September did EURUSD fall, and by early October it traded near 1.12. So a short seller at C first faced a run against the trade, and the later drop came well after any 10-bar window.
What our shark pattern test found
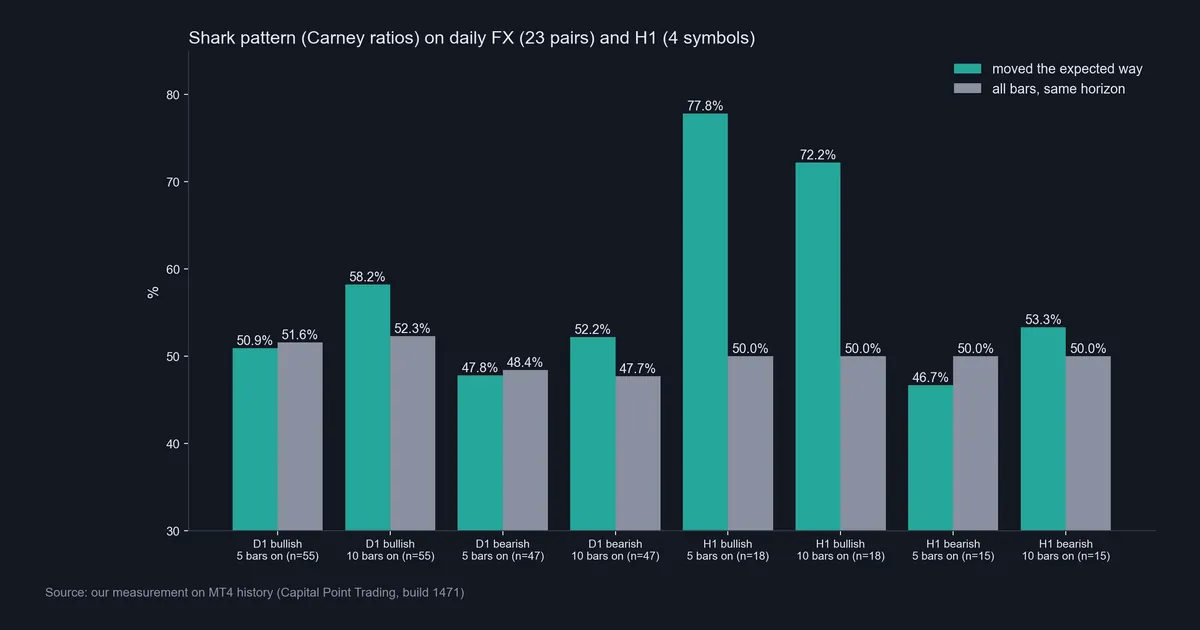
Our scan found 55 bullish and 47 bearish sharks on daily FX. After bullish sharks, the close 5 bars later was higher 50.9% of the time. The base rate for any day was 51.6%. At 10 bars, the figure was 58.2% against a base of 52.3%. Bearish sharks were followed by a lower close 47.8% of the time after 5 bars and 52.2% after 10 bars.
The H1 test looks better at first glance. Bullish H1 sharks rose 77.8% of the time after 5 bars and 72.2% after 10 bars. But that comes from just 18 cases. That is far too few to rely on. Meanwhile, the 15 bearish H1 sharks came in at 46.7% and 53.3%, close to a coin flip.
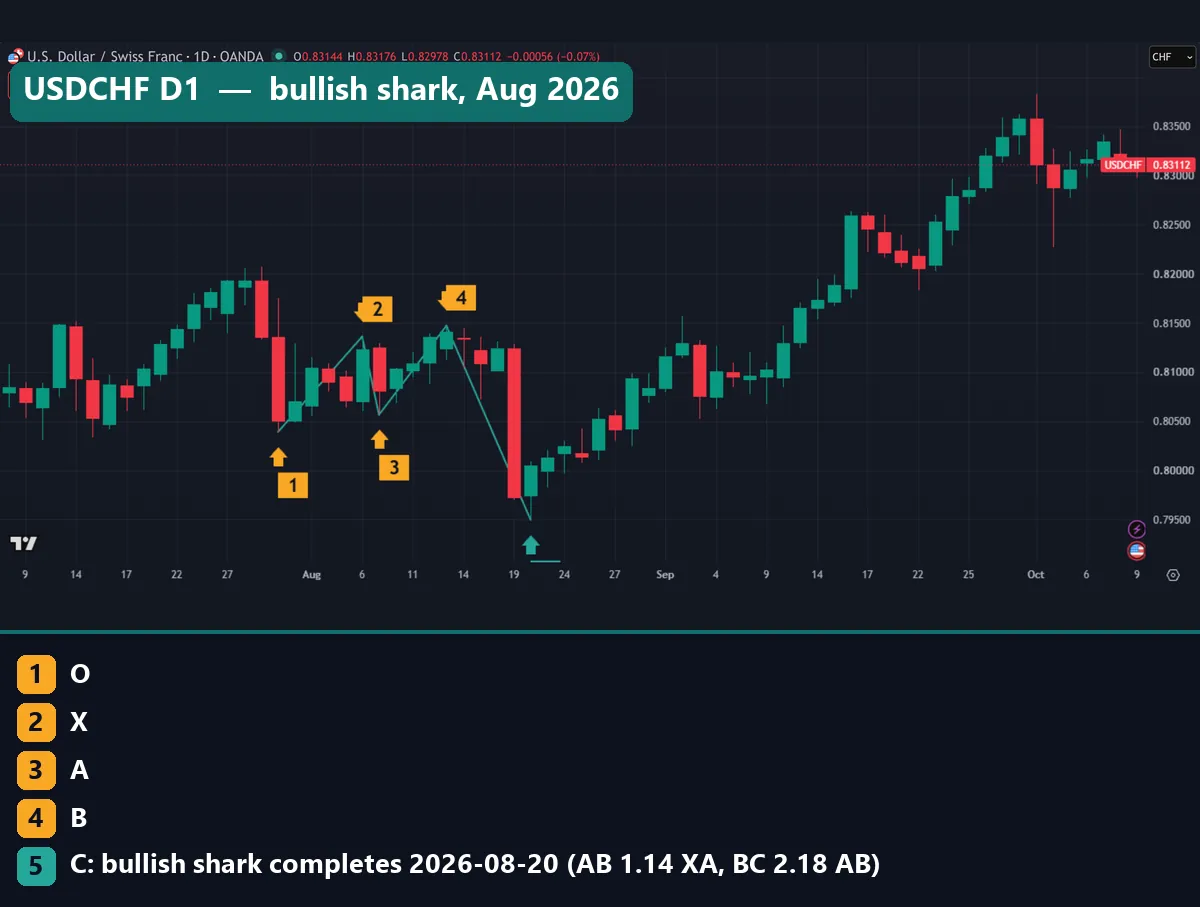
USDCHF daily shows the kind of case that lifts the 10-bar bullish figure. C formed at 0.79498 on 20 August 2026, with ratios of 1.14 and 2.18. After that, price rose steadily, to around 0.835 by early October. Still, the AUDUSD daily chart shows the opposite outcome from the same rule.
Download the complete indicator database
Put these concepts on your charts. One email unlocks the full library of 1,380+ indicators with compiled MT4 and MT5 files, plus my TradingView scripts. No paywall, no spam, unsubscribe any time.
Get free access to my indicator database
One email unlocks 1,380+ free MT4, MT5 and TradingView indicators — the complete library. No single-tool download; you get the whole database.
Where it fails
The biggest limit is sample size. Over eight years of daily data across 23 pairs, we found only 102 sharks. On H1 we found 33. So any shark statistic, including ours, carries wide error bars.
Second, the daily result is near the base rate. In our data, any day was followed by a higher close 51.6% of the time after 5 days and 52.3% after 10 days. The shark barely moved those numbers.
Third, point C is only known in hindsight. A swing low needs bars after it to prove itself. Until then, the “C” can keep moving, as the AUDUSD M15 chart showed. TradingView’s Pine Script docs on repainting explain why pivot-based tools redraw their marks once later bars arrive. A shark scanner that labels C on the live bar is showing you a guess.
Fourth, the ratio bands are wide. BC can be anywhere from 1.618 to 2.24 times AB. So “the zone” is often a broad area, not a level. Finally, many sharks simply keep going. Our general guide to chart pattern failure covers that problem across other shapes too.
The intraday shark: gold and USDCHF on M15
Intraday sharks form often, but their legs are small. That makes costs a bigger share of every move.
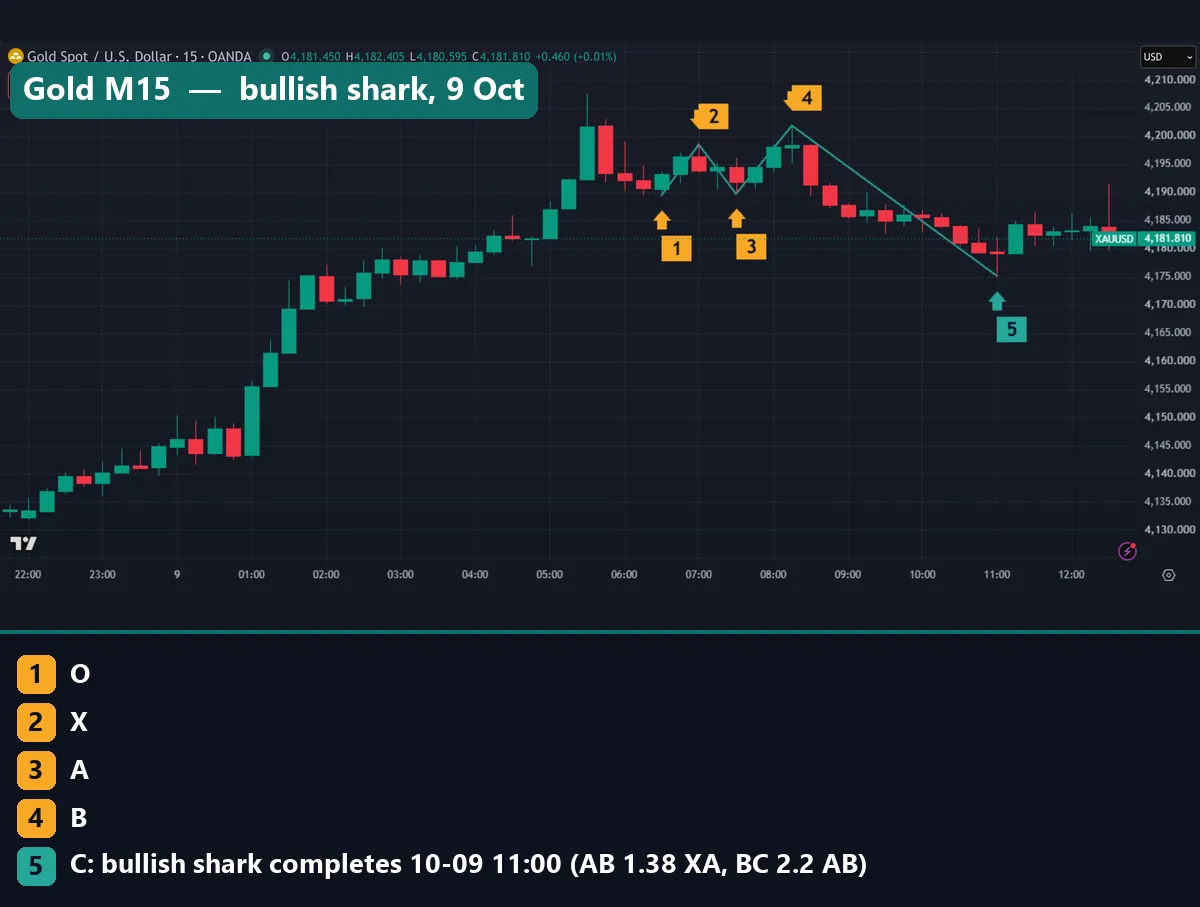
This gold chart shows a bullish shark on 9 October 2026, on M15. O sits at $4,189.48 and X at $4,198.52. Then A dips to $4,189.75, and B rises to $4,201.87. C completes at $4,175.165 at 11:00 UTC. So XA is $8.77, AB is $12.12 and BC is $26.705, which gives ratios of 1.38 and 2.20. After C, the chart shows a bounce to about $4,185 and then a flat drift near $4,181.81. The move was small next to the BC leg.
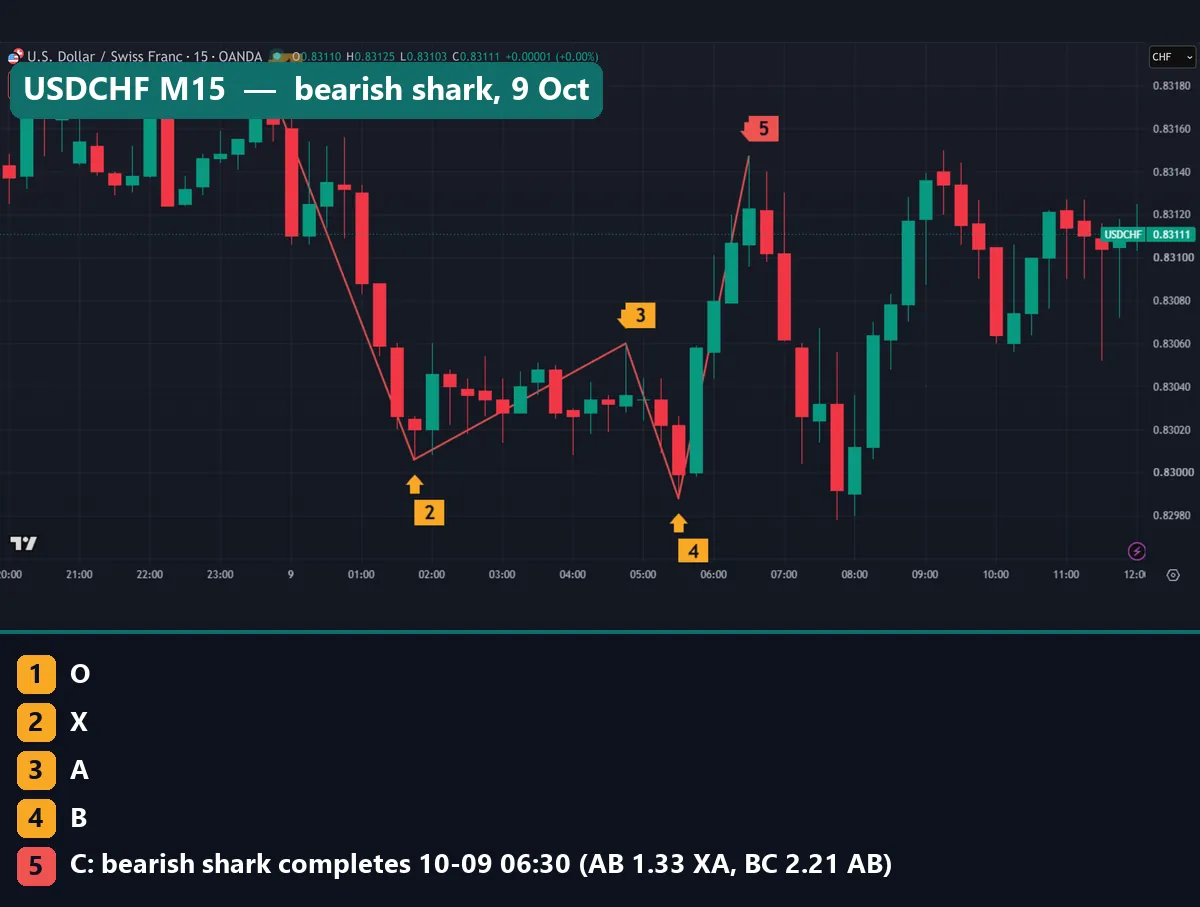
The USDCHF M15 chart shows a bearish shark. O is 0.83176 at 23:45 UTC on 8 October, and X is 0.83006 at 01:45 UTC on 9 October. Then A sits at 0.83060, B at 0.82988 and C at 0.83147, at 06:30 UTC. The ratios are 1.33 and 2.21. Afterwards, price fell to around 0.8298 within a few hours and then climbed back to about 0.8314. So the drop happened, but it also faded the same morning.
Common mistakes with the shark
- Mixing up the labels. The shark ends at C, not D. If your tool expects X-A-B-C-D, it will read the shark as a different pattern. Our harmonic pattern cheat sheet lists each pattern’s point names side by side.
- Treating B inside XA as a shark. Then it is not one. The AB leg must run past X, by 1.13 to 1.618 times XA.
- Entering on an unconfirmed C. A pivot is not final until bars form after it. On M15 and H1, price often pushes past the first “C” before it turns.
- Trusting a small sample. A run of good sharks on one pair proves little. Also, size each trade with a stop-loss you set before entry, because a shark that keeps running can travel far.
Where to go next
If you trade harmonics, compare the shark with its relatives first. Our pages on the bat vs the Gartley and on butterfly pattern basics show how the ratios differ. Also, our test of whether Fibonacci retracement works covers the levels these shapes rest on.
To scan for shapes on MT4, see our harmonic pattern finder indicator. On TradingView, the harmonic ratio scanner checks leg ratios on the chart. For trade size, our position sizing guide helps you keep the risk on any one pattern small.
For outside reading, start with Carney’s own page, linked above. Then read harmonic patterns in the currency markets at Investopedia, and BabyPips’ lesson on harmonic price patterns for a plain primer.
FAQ: shark pattern questions
Who created the shark pattern?
Scott Carney introduced it in 2011. He also named the bat and the crab, and he links the shark to his 5-0 pattern.
Why does the shark use 0-X-A-B-C instead of X-A-B-C-D?
Carney starts the count one swing earlier, at 0, so the last point is C. The shape still has five points and four legs. Our charts print the 0 as the letter O.
What ratios define a shark?
AB must be 1.13 to 1.618 times XA, and BC must be 1.618 to 2.24 times AB. Carney also wants C between the 0.886 retracement and the 1.13 extension of the 0X leg.
Is the shark bullish or bearish?
It can be either. A bullish shark ends with C as a swing low, so the expected turn is up. A bearish shark ends with C as a swing high, so the expected turn is down.
Did the shark beat the base rate in your test?
Not in a way we could trust. On daily FX, bullish sharks rose 50.9% of the time after 5 bars against a 51.6% base. The 10-bar figures were a few points better, but with only 55 and 47 cases.
Why not trust the H1 bullish result?
It rests on 18 cases. With so few, two or three bounces swing the figure by double digits. The 15 bearish H1 sharks, by contrast, were close to a coin flip.
Does a shark scanner repaint?
Any tool built on swing pivots can move its last point until the pivot confirms. That is why we measured from 3 bars after C, not from C itself.
Should I trade every shark a scanner finds?
No. Our data showed no clear edge on daily charts, so treat a shark as one input next to trend, levels and risk limits. Keep the size small and the stop fixed in advance, because results are not guaranteed; past performance is not indicative of future results.
Last updated: 9 October 2026.

About the author
Written by Dominic Walsh, a Forex trader and MT4/MT5 indicator, Expert Advisor and script developer. Every tool on forexmt4systems.com is tested on live charts before release and ships with ready-to-use compiled MT4 (.ex4) and MT5 (.ex5) files. Learn more about the trader and developer behind this site.
How we build, test and correct every tool: Editorial & Testing Policy. Trading carries risk; see the disclaimer.