
Strat patterns are short chains of numbered bars, where each number says how one bar relates to the bar before it. The method comes from The Strat, the bar-counting approach built by trader Rob Smith. This guide settles what the numbers mean, how setups such as 2-1-2 and 3-1-2 are built, and what we found when we counted them on eight years of forex data. The short answer: a modest positive result before costs, with small stops that make costs bite hard.
What strat patterns are
The Strat gives every bar one of three numbers. A 1 is an inside bar: its high is not above the prior high, and its low is not below the prior low. A 2 takes out one side of the prior bar. We write 2u when it takes the high and 2d when it takes the low. A 3 is an outside bar, so it takes out both sides.
That is the whole vocabulary. There is no indicator and no period setting. So two traders who look at the same chart will label the same bars the same way.
A pattern is then a string of labels read left to right. If you know the classic inside bar pattern, the 1 in The Strat is the same shape.
How the bar numbers work
The rule fits in two comparisons. Take the current bar’s high and low, then compare them with the previous bar’s high and low.
- High not above the prior high, and low not below the prior low: type
1. - High above the prior high, low not below the prior low: type
2u. - Low below the prior low, high not above the prior high: type
2d. - High above the prior high and low below the prior low: type
3.
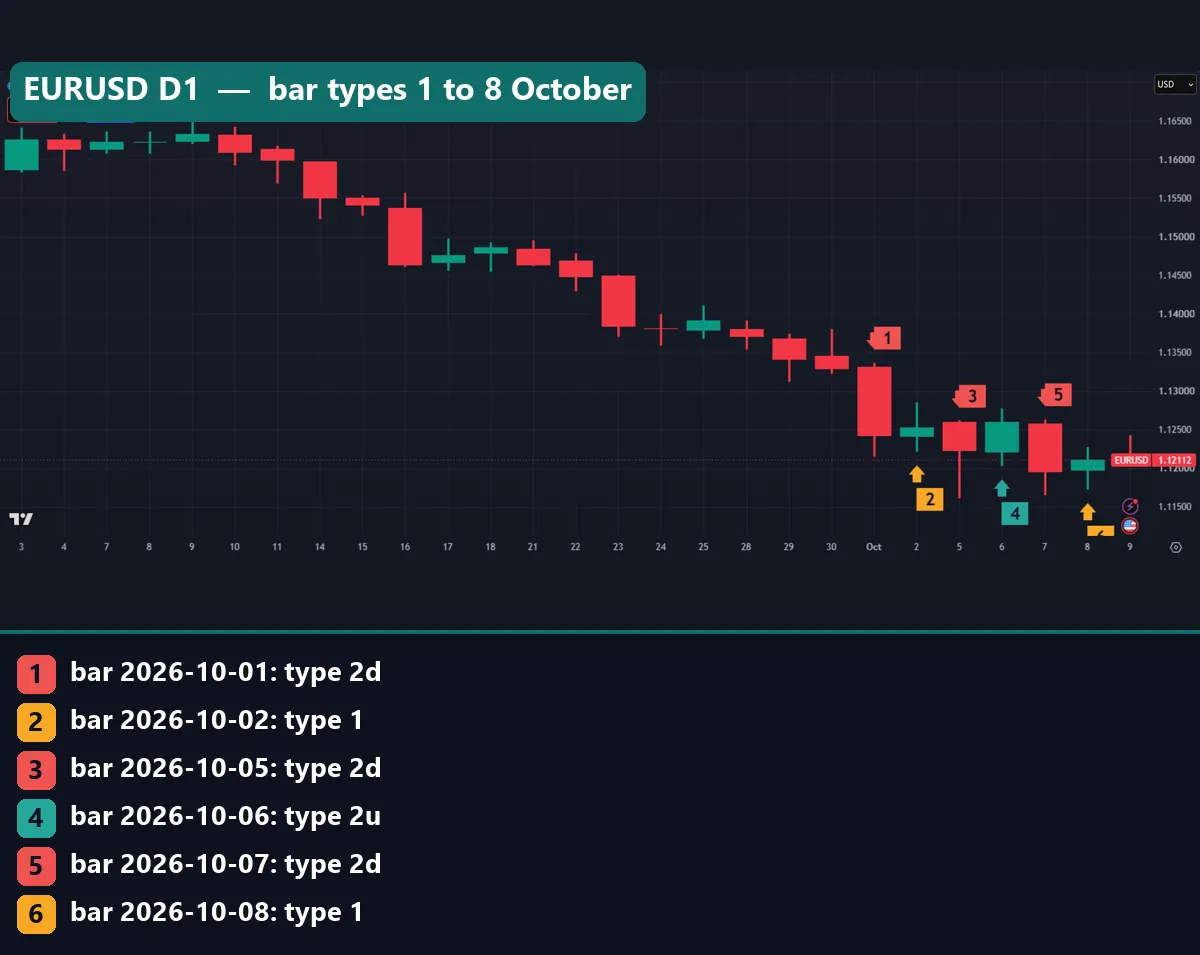
Note what the rule ignores. The open and close play no part, so a red candle can still be a 2u. In the opening EURUSD chart, the bar of 6 October 2026 is a 2u, because its high of 1.12768 cleared the prior high of 1.12614. Then 7 October is a 2d, because its low of 1.11646 broke the 6 October low of 1.12028.
How the 2-1-2, 3-1-2 and 1-1-2 setups are built
Most traded setups are built around a 1. An inside bar is a pause, and the next bar decides which side breaks.
A 2-1-2 is a directional bar, an inside bar, then a break. If the break goes the same way as the first 2, Strat traders call it a continuation; if not, a reversal. A 3-1-2 starts with an outside bar instead. A 1-1-2 has two inside bars in a row, so the range narrowed twice before the break.
The trade idea is the same in each case. First, the entry sits at the inside bar’s high for a long or its low for a short. Next, the stop goes at the other end of the inside bar. Then the target is a multiple of that distance, or an earlier high or low.
The Strat also checks higher timeframes, which Rob Smith calls timeframe continuity. TradingView explains how scripts read timeframes in the Pine Script docs on TradingView, and our guide to multi-timeframe analysis covers the idea. We did not test a continuity filter, so our numbers are for the bare setups.
How we tested
We counted bar types and setups in MetaTrader 4, build 1471, on Capital Point Trading history. The daily test covered 23 FX pairs from 12 June 2018 to 24 August 2026, or 37,725 bars: AUDCAD, AUDCHF, AUDJPY, AUDNZD, AUDUSD, CADCHF, CADJPY, CHFJPY, EURAUD, EURGBP, EURUSD, GBPAUD, GBPCAD, GBPCHF, GBPJPY, GBPNZD, GBPUSD, NZDCAD, NZDCHF, NZDJPY, USDCAD, USDCHF and USDJPY.
We then ran the same rule on H1 history for four symbols in the same terminal, which gave 18,823 bars. Results are in R, where 1R is the distance from entry to stop. All results are before spread, swap and commission.
The chart examples come from the TradingView web chart with OANDA data, captured on 9 October 2026. Our editorial testing policy explains how we pick samples. Also note one limit: this is one pass over one data set, with no held-out period. So the result is in-sample only, and our page on backtesting versus forward testing explains why that matters.
The setup rules we used
The table lists every choice in our test. If you change one, your numbers will differ.
| Parameter | Our setting | Why |
|---|---|---|
| Bar type | 1, 2u, 2d or 3 against the previous bar | The standard Strat labels |
| Setup | Bar type X, then an inside bar, then a 2 that breaks it | Covers 1-1-2, 2-1-2 and 3-1-2 |
| Entry | At the break of the inside bar’s high or low | The usual Strat trigger |
| Stop | The other end of the inside bar | Defines 1R |
| Target | 2R from entry | A fixed, testable exit |
| Time exit | 20 bars after entry | Ends trades that stall |
| Costs | None included | Spreads vary by broker and hour |
| Filters | None, no timeframe continuity | Tests the bare pattern |
The 2R target is our choice, not a Strat rule. Many Strat traders aim for an earlier bar’s high or low instead. If this language is new, start with our guide to the risk reward ratio.
Reading strat patterns on a chart
To learn the labels, number the last ten bars on any chart by hand, then draw lines at each inside bar’s high and low.
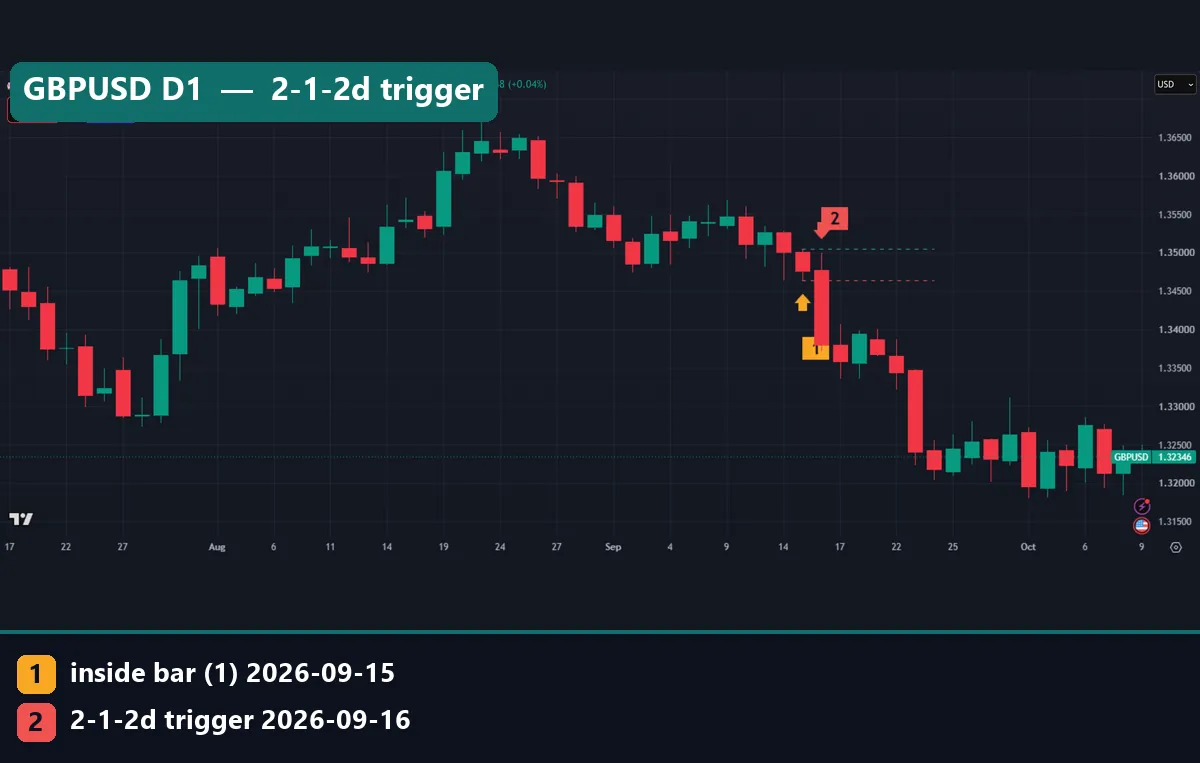
This GBPUSD daily chart shows a bearish 2-1-2. Marker 1 is the inside bar of 15 September 2026, with a high of 1.35050 and a low of 1.34644. The green dashed line marks that high, and the red dashed line marks the low. Marker 2 is 16 September. That bar broke the red line, so it was a 2d and it triggered the short.
The risk was 40.6 pips, the full height of the inside bar. So a 2R target sat 81.2 pips below entry, at 1.33832. The chart shows price trading below the red line in the days after the break.
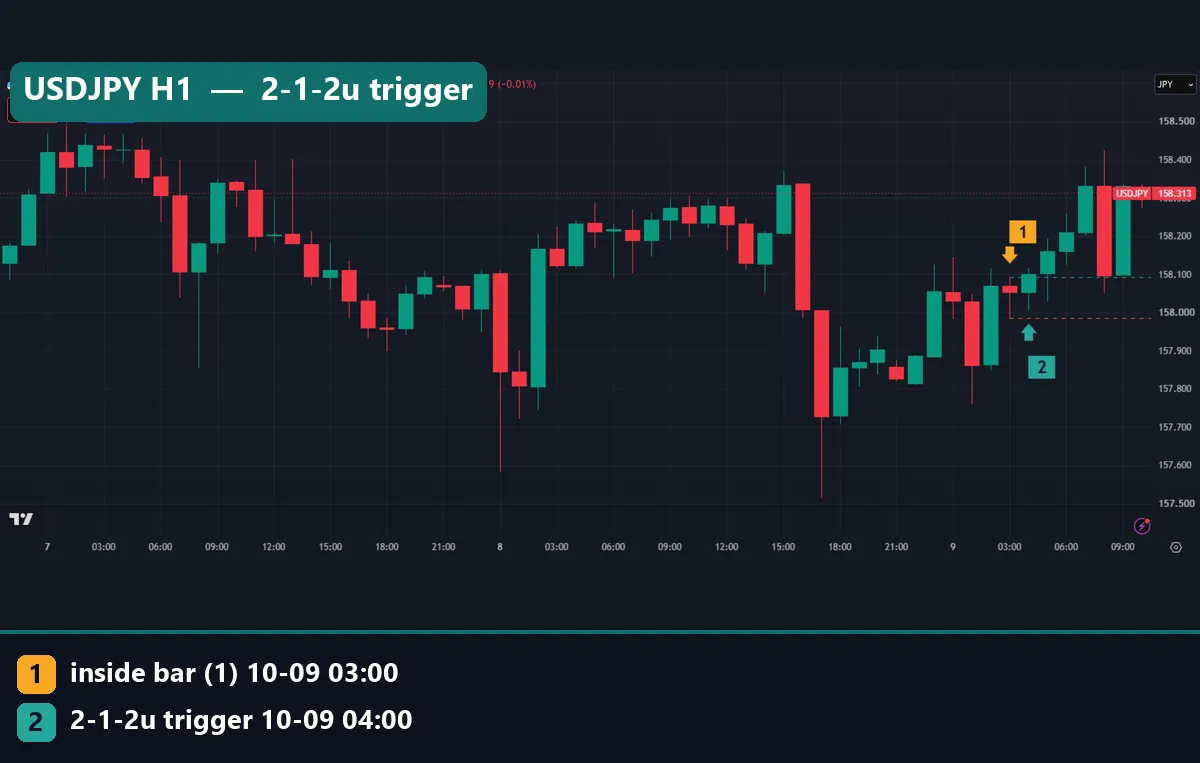
The same shape on a 1-hour chart is much smaller. Here USDJPY printed an inside bar at 03:00 UTC on 9 October 2026, marked 1. Its high was 158.092 and its low was 157.986. The 04:00 bar, marked 2, broke the high. Because the bar before the inside bar was also a 2u, this was a 2-1-2u continuation. The gap between the dashed lines is the whole stop.
Worked example: a 2-1-2u on USDJPY H1
Times are UTC on 9 October 2026, and numbers are before costs.
- Entry: 158.092, the inside bar’s high. The 04:00 bar reached 158.117, so the order filled.
- Stop: 157.986, the inside bar’s low. So 1R was 10.6 pips.
- Target: 2R above entry, which is 158.304.
- The 04:00 low was 158.006, then the 05:00 and 06:00 lows stayed higher. So the stop held.
- Then the 07:00 bar reached 158.380, past the target. The trade closed at +2R.
That is a clean result, but look at the scale. With a 10.6-pip stop, every pip of spread or slippage costs 0.094R. If you paid 1.5 pips all in, the winner shrinks to about +1.86R, and a full loss grows to about 1.14R.
For contrast, the EURUSD chart at the top holds a daily 2-1-2d. The inside bar of 2 October 2026 ran from 1.12209 to 1.12855, so 1R was 64.6 pips. The 5 October bar broke the low and triggered the short. By 8 October it was still open. The best low was 1.11612, about 0.92R in profit, and the worst high was 1.12768, just 8.7 pips short of the stop.
What the numbers say about each setup
First, how common is each bar type? Across our daily sample, 13.7% of bars were inside bars and 11.8% were outside bars. The rest were 2s: 38.1% took the high and 36.3% took the low. The hourly sample was close, with 15.5% inside bars and 11.1% outside bars.
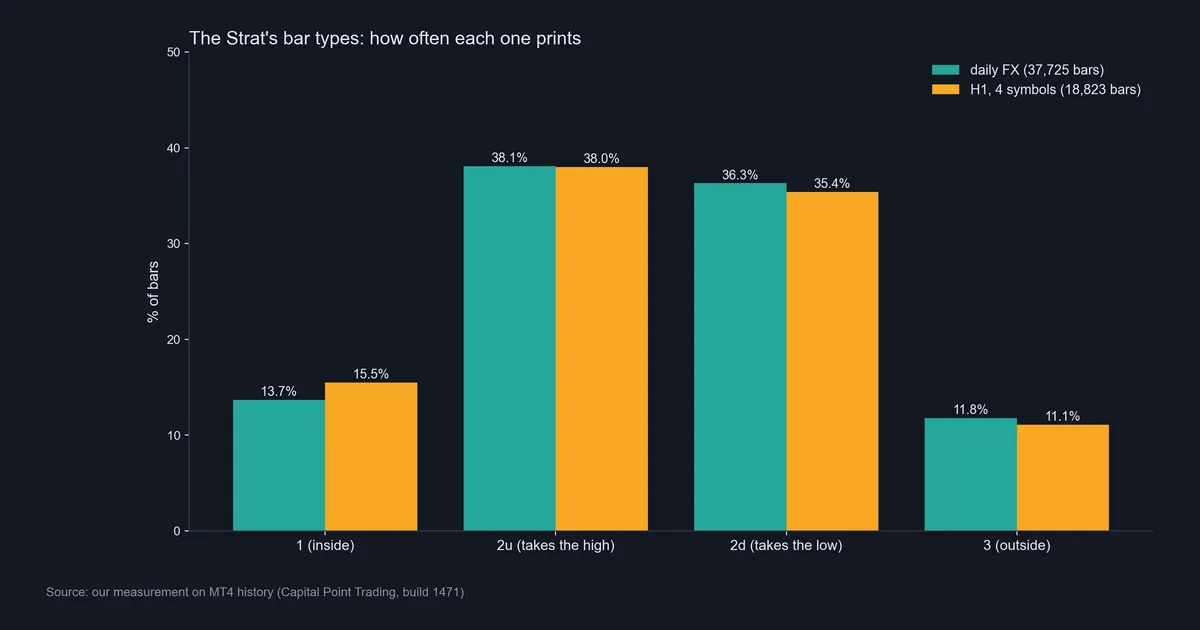
So on one daily pair, expect about one inside bar every seven trading days.
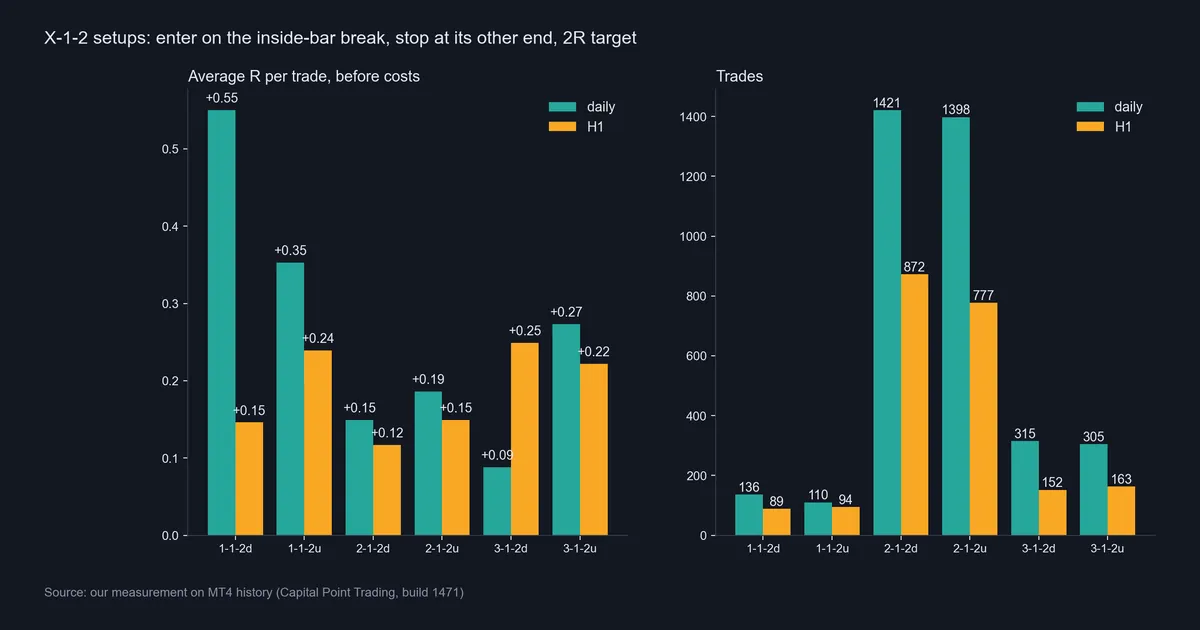
Next, the setups. On daily data, 2-1-2u gave 1,398 trades at +0.186R on average, and 2-1-2d gave 1,421 trades at +0.149R. The target hit 38.7% and 37.6% of the time, above the 33.3% a 2R target needs to break even before costs. On H1 the 2-1-2 results were smaller: +0.149R on 777 longs and +0.117R on 872 shorts.
Some smaller groups look better. For example, daily 1-1-2d shows +0.55R, but on only 136 trades, while daily 3-1-2d fell to +0.088R. Small groups swing a lot, as our guide to backtest sample size explains. In short, every group was positive before costs, and the large groups sat between +0.1R and +0.2R.
Download the complete indicator database
Put these concepts on your charts. One email unlocks the full library of 1,380+ indicators with compiled MT4 and MT5 files, plus my TradingView scripts. No paywall, no spam, unsubscribe any time.
Get free access to my indicator database
One email unlocks 1,380+ free MT4, MT5 and TradingView indicators — the complete library. No single-tool download; you get the whole database.
Where it fails
The first failure is cost. The edge is thin, and the stop is the inside bar, which is often narrow on H1. On the USDJPY example, about 1.2 pips of total cost would erase the +0.117R average of the H1 2-1-2d group. On the 64.6-pip EURUSD stop, the same cost is under 0.02R. Our page on backtesting transaction costs shows how to add costs to a test.
The second failure is evidence. Our result is in-sample, from one broker feed, with no costs. So treat +0.15R as a reason to test further, not as a forecast.
The third failure is losing streaks. Even the better groups were stopped out around 60% of the time. Size each trade so a long run of losses is survivable; our guide to position sizing shows the maths.
The fourth failure is the outside bar. A 3 breaks both ends of the bar before it. With orders on both sides of an inside bar, a 3 can fill one side and stop it out in the same bar.
Where this fails on real charts
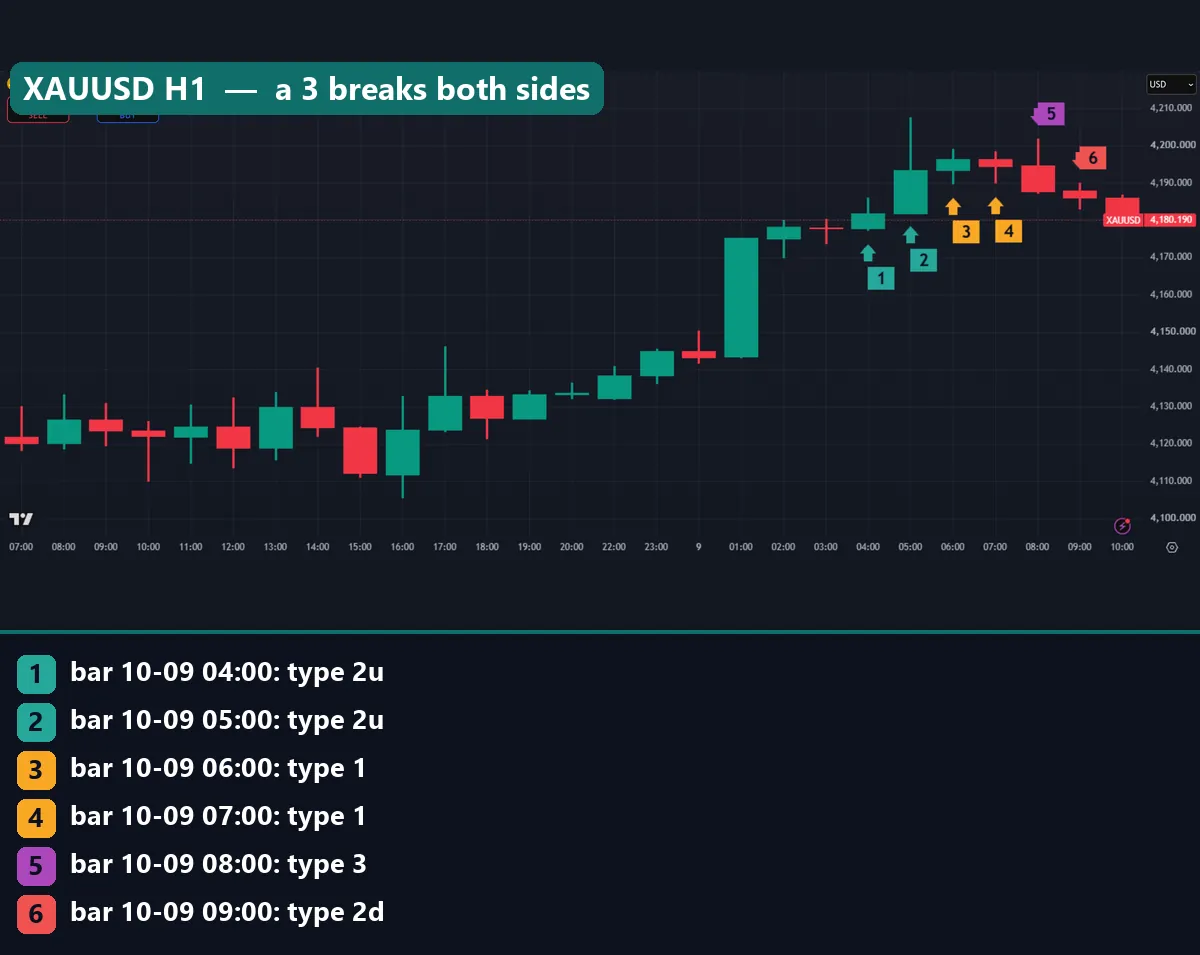
This gold chart shows the outside-bar problem. On 9 October 2026, the 04:00 and 05:00 UTC bars were both 2u, marked 1 and 2. Then the 06:00 and 07:00 bars were inside bars, marked 3 and 4. The 07:00 inside bar ran from $4,189.75 to $4,198.52, a range of $8.77.
Next, the 08:00 bar, marked 5, printed a 3. It reached $4,201.87 and fell to $4,187.15, breaking both ends. Our rule logs no setup for a 3. But a trader with stop orders on both sides would have been filled long and short within one hour. Then the 09:00 bar, marked 6, took the low again as a 2d.
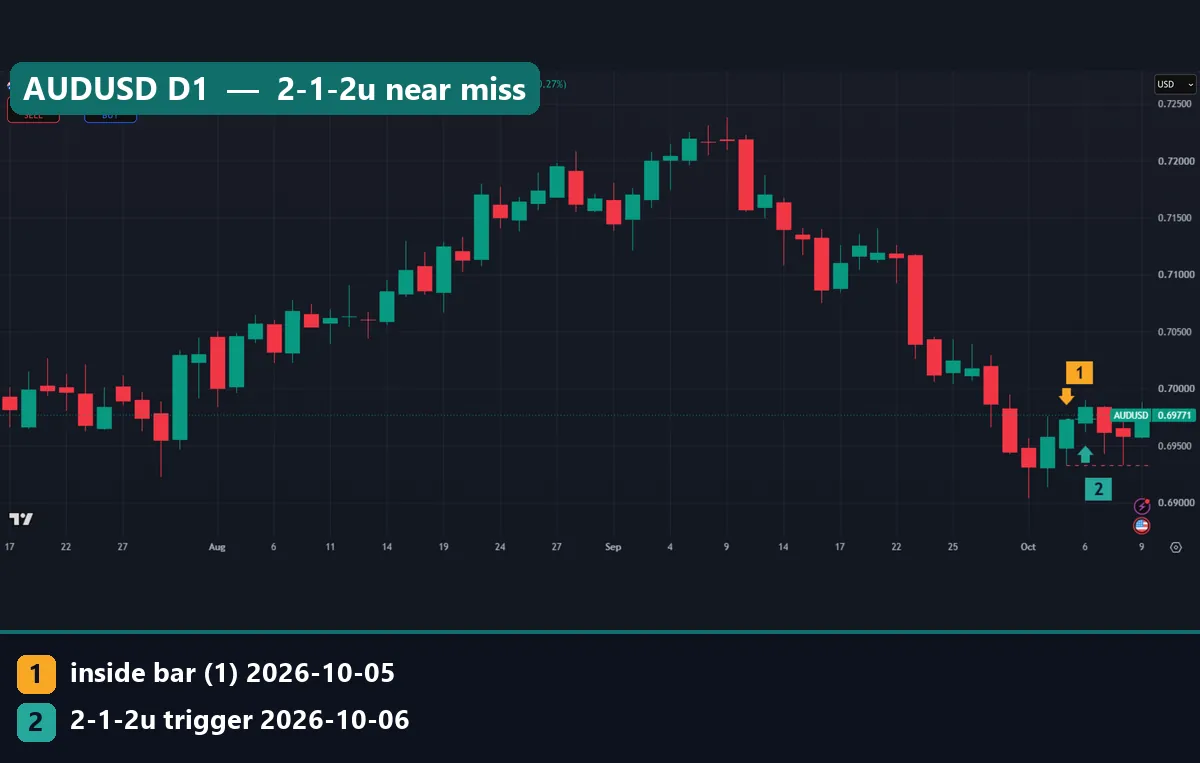
This AUDUSD daily chart shows a near miss. The inside bar of 5 October 2026, marked 1, ran from 0.69325 to 0.69736. The 6 October bar, marked 2, broke the high and triggered a 2-1-2u long, with 1R at 41.1 pips. The best high after that was 0.69900, only about 0.4R. But the 8 October low reached 0.69329, just 0.4 pips above the stop. A slightly different broker feed could have closed it at a full loss.
Common mistakes with The Strat
- Reading candle colour as the bar type. The number comes from the high and low only. For example, the red EURUSD bar of 30 September 2026 was a 2u.
- Ignoring costs on small inside bars. A 10-pip stop turns every pip of cost into a tenth of your risk. So check the stop size first, and skip narrow bars if your costs are high.
- Trusting small groups. A setup with 89 or 136 trades can look strong by chance. Our page on curve fitting in trading covers this trap.
- Labelling bars before they close. A bar that looks like a 1 at noon can become a 2 or a 3 by the close. Our test only labelled closed bars, so wait for the close before you call a 1.
Where to go next
For a short neutral definition, see the inside bar entry in the BabyPips Forexpedia. For background on reading bars without indicators, see price action trading on Wikipedia. Then the candlestick charts article at StockCharts ChartSchool covers how each bar is drawn.
On our site, the engulfing candle guide is the closest relative of the outside bar. The price action trading guide places The Strat in the wider school. To turn R numbers into an expected result, read our page on trading expectancy.
In MetaTrader, the inside and outside bar indicator flags types 1 and 3 on the chart, though you still read the 2s yourself. Also compare the 3 bar reversal pattern guide.
FAQ: strat patterns
Who created The Strat?
Rob Smith, a trader, developed The Strat and its 1, 2 and 3 bar labels. Our test rules, such as the 2R target, are our own.
What does a 2-1-2 mean in The Strat?
A bar that took one side of the bar before it, then an inside bar, then a break of that inside bar. If both 2s point the same way, it is a continuation; if not, a reversal.
How often do inside bars appear?
In our daily sample of 23 FX pairs, 13.7% of bars were inside bars. On our H1 sample the share was 15.5%.
Did strat patterns make money in your test?
Before costs, every setup group was positive in sample, and the large daily 2-1-2 groups averaged +0.149R to +0.186R. We did not test costs or fresh data, so that is a modest in-sample result only.
Why do costs matter so much for The Strat?
Because the stop sits at the other end of the inside bar, and inside bars are often narrow. On a 10.6-pip stop, each pip of cost equals 0.094R, close to the whole average edge we measured on H1.
Is a 3 bar bullish or bearish?
Neither by itself. A 3 only says the bar took both the prior high and the prior low.
Which timeframe works best for strat patterns?
In our data most daily setups showed larger average R than their H1 versions, and the wider daily stops made costs a smaller share.
Can I trade strat patterns without a stop loss?
We would not. Our results depend on the stop at the far end of the inside bar, and around 60% of trades hit it. Without one, a single bad break can outweigh many small gains, and results are not guaranteed; past performance is not indicative of future results.
Last updated: 9 October 2026.

About the author
Written by Dominic Walsh, a Forex trader and MT4/MT5 indicator, Expert Advisor and script developer. Every tool on forexmt4systems.com is tested on live charts before release and ships with ready-to-use compiled MT4 (.ex4) and MT5 (.ex5) files. Learn more about the trader and developer behind this site.
How we build, test and correct every tool: Editorial & Testing Policy. Trading carries risk; see the disclaimer.