
The 3 bar reversal pattern TradingView users mark is a three-candle turn: a push, a new extreme, then a close back through that extreme. This guide settles three things. First, what the pattern is and how to mark it on a TradingView chart. Second, how to code it yourself, since TradingView has no built-in version. Third, what it did on 8 years of daily FX data and about 15 months of 15-minute data. The short answer: in our test it did not beat a coin toss.
What the 3-bar reversal pattern is
The pattern uses three bars in a row. In the bullish version, bar 1 closes down. Bar 2 then prints a lower low than both bar 1 and bar 3, so it holds the swing low. Finally, bar 3 closes above the high of bar 2. That close is the trigger.
The bearish version mirrors it. Bar 1 closes up. Bar 2 makes a higher high than bars 1 and 3. Then bar 3 closes below the low of bar 2.
The middle bar marks an extreme, and the third bar rejects it. It sits close to the morning star pattern, which also uses three candles around a low. However, the morning star cares about body sizes and gaps. The 3-bar reversal only cares about highs, lows and one close. That makes it easy to code and test.
Writers define it in slightly different ways. Our version is one stated choice, and every number here refers to it only.
3 bar reversal pattern tradingview: how it works
Here is the rule in plain logic. We count bars as bar 1 (oldest), bar 2 and bar 3 (the bar that just closed).
- Bullish:
close1 < open1,low2 < low1,low2 < low3,close3 > high2. - Bearish:
close1 > open1,high2 > high1,high2 > high3,close3 < low2.
There is no smoothing, lookback or threshold, so nothing needs tuning. Also, the signal only exists once bar 3 has closed. Before that close, bar 3 can still fall back inside bar 2’s range, and the pattern vanishes.
The story behind it runs like this. Bar 1 shows sellers in control. Next, bar 2 extends the move to a fresh low, which pulls in late sellers and hits stops below bar 1. Then bar 3 runs straight through bar 2’s high. If that story holds, the late sellers are now trapped and need to buy back. Our data, further down, asks whether that shows up in prices.
TradingView’s own notes on repainting in the Pine Script docs on TradingView explain why a signal read on an open bar can change. See also our guide on what repainting means.
Coding it in Pine Script yourself
TradingView does not ship a built-in “3-bar reversal” study. Community scripts exist, but their rules vary. So we wrote ours as a short script. Paste it into the Pine Editor, save it, then add it to a chart.
//@version=6
indicator("3-bar reversal (our rule)", overlay = true)
bull = close[2] < open[2] and low[1] < low[2] and low[1] < low and close > high[1]
bear = close[2] > open[2] and high[1] > high[2] and high[1] > high and close < low[1]
plotshape(bull, "Bullish", shape.triangleup, location.belowbar, color.teal)
plotshape(bear, "Bearish", shape.triangledown, location.abovebar, color.red)
alertcondition(bull, "Bullish 3-bar reversal", "Bullish 3-bar reversal")
alertcondition(bear, "Bearish 3-bar reversal", "Bearish 3-bar reversal")
In Pine, [2] means two bars back, so close[2] is bar 1. On a live bar, the shape can appear and then disappear before the close. So set any alert to fire “Once per bar close”. Our Pine Script documentation guide walks through the editor if this is your first script.
If you trade on MetaTrader instead, our three-bar reversal pattern indicator marks the same shape on MT4 and MT5 charts. That download is a compiled file, not source code.
How we tested the 3-bar reversal
We ran two measurements and took one set of chart examples, all with the rule above.
- Daily FX: 23 currency pairs from MetaTrader 4, build 1471 terminal history (Capital Point Trading). The window runs from 12 June 2018 to 24 August 2026, or 37,748 daily candles.
- 15-minute data: EURUSD, GBPUSD, USDJPY and XAUUSD from the same terminal, June 2025 to August 2026.
- Chart examples: TradingView web chart, OANDA data, captured on 7 October 2026. Every marker in our screenshots sits on a bar that fits our rule.
For each pattern we asked one question. Did price close further in the pattern’s direction N bars later than bar 3’s close? On daily data we checked 1, 3 and 5 bars on. On M15 we checked 1, 4 and 8 bars on. We compared that with a base rate: the share of all bars that closed higher N bars later.
A pattern only adds something if it beats what any random bar would have done. Every result here comes before spread, swap and commission. The MT4 history has no usable spread, so we did not guess one. Our full method sits on the editorial testing policy page.
Our rule and its parameters
The pattern has no inputs as such. Still, each test choice shapes the result, so here they are.
| Parameter | Our setting | Common alternative |
|---|---|---|
| Bar 1 condition | Closes against the coming signal (down for bullish) | No colour rule |
| Bar 2 condition | Lowest low of the three (highest high for bearish) | Same |
| Bar 3 trigger | Close beyond bar 2’s high (low for bearish) | Close beyond bar 1’s high as well |
| Confirmation | Bar 3 fully closed | Intrabar break of bar 2’s high |
| Forward check, D1 | 1, 3 and 5 bars on | Fixed target or stop |
| Forward check, M15 | 1, 4 and 8 bars on | Session close |
| Base rate | Share of all bars that closed higher N bars on | None |
| Costs | Not included | Spread plus commission |
Reading the pattern on a live chart
Look for the middle bar first. It should stick out past both neighbours. Then check the third bar’s close, not its wick.
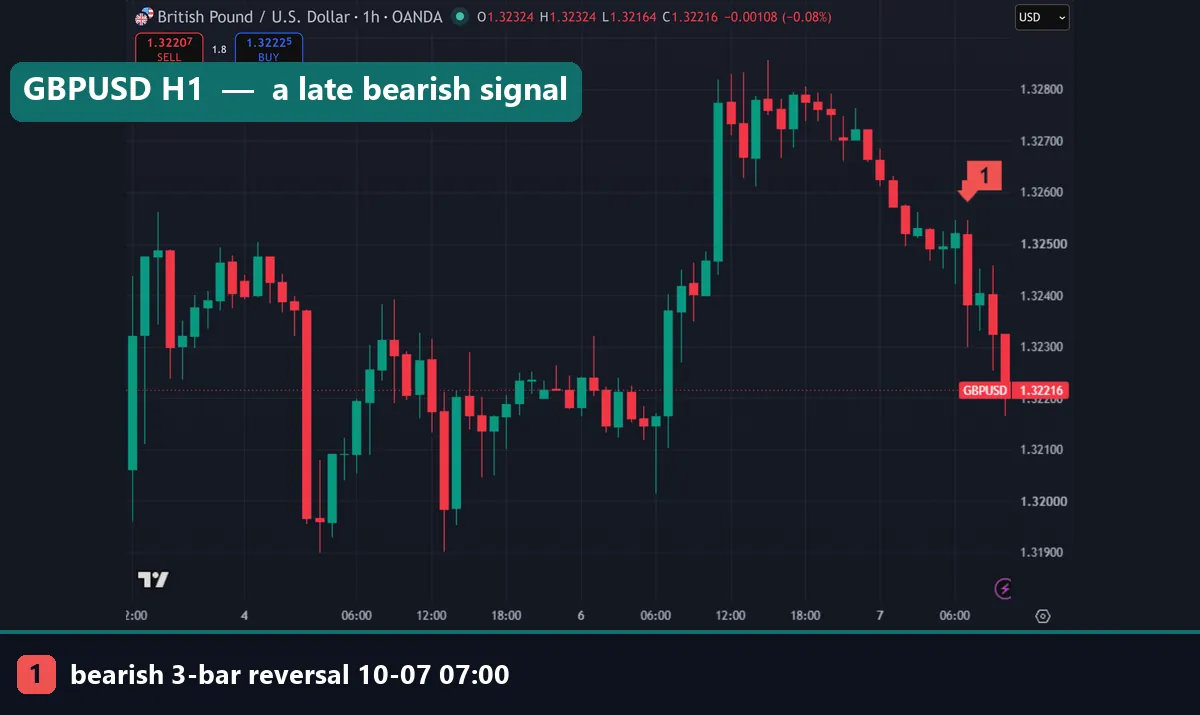
Our GBPUSD hourly shot shows a bearish case. The marked bar opened at 07:00 UTC on 7 October 2026. It printed 1.32518 open, 1.32546 high, 1.32300 low and 1.32382 close. That close sat below the low of the bar before it. The pattern formed after the pair had already slid from the 1.328 area, so it came late in the move rather than at the top.
That timing is common, because the rule needs a new extreme on bar 2 first.
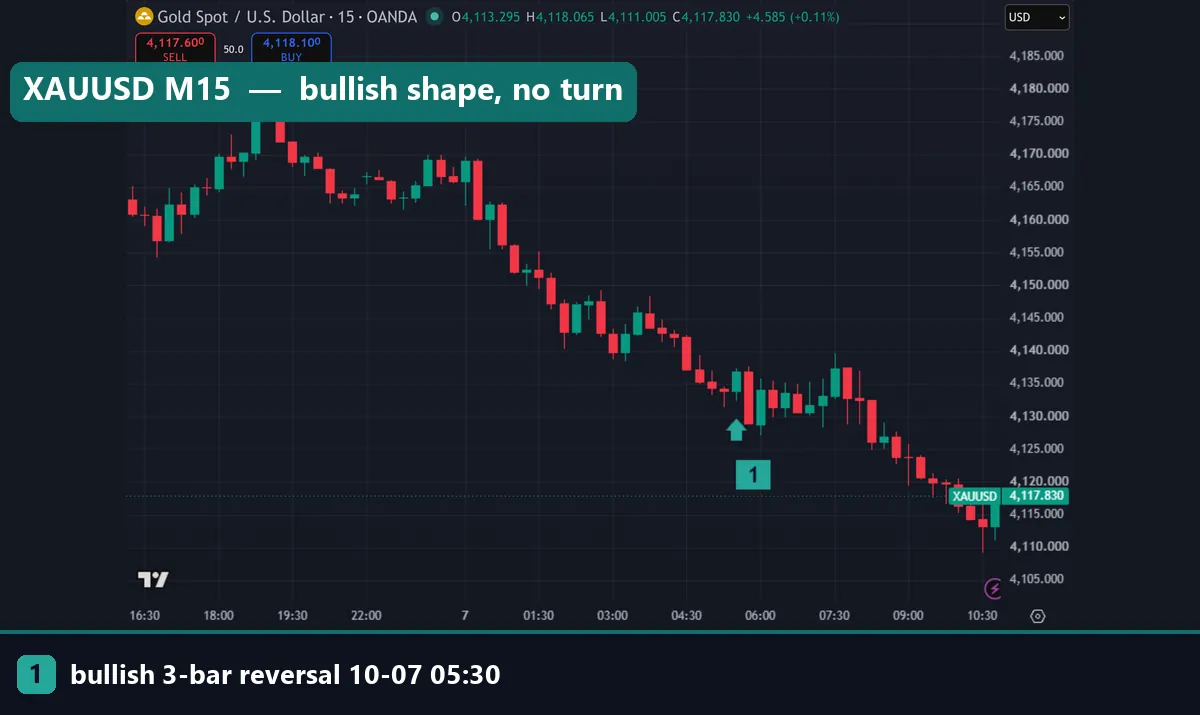
On XAUUSD M15, the marked bar opened at 05:30 UTC on 7 October 2026. It closed at $4,136.89 after a low of $4,132.35. Yet the chart shows price drifting sideways and then lower. The last bar in the shot closed at $4,117.83, about $19 under the signal close. In short, a clean shape gave no lasting turn here.
A signal at a clear support or resistance level at least has a reason to matter. A signal mid-range has none.
Worked example: EURUSD daily, September 2026
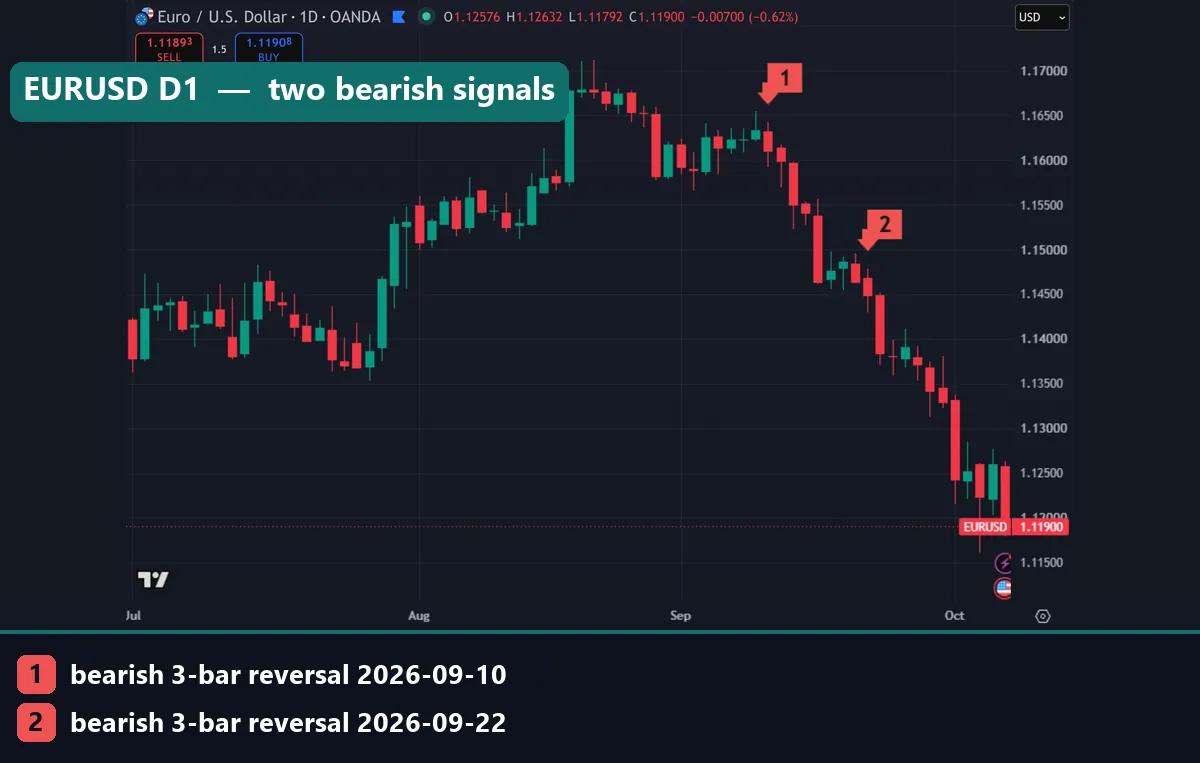
Marker 1, 10 September 2026. Bar 3 opened at 1.16318, reached 1.16419, fell to 1.15923 and closed at 1.16100. That close sat below bar 2’s low, which made it a bearish trigger, with a stop idea above bar 2’s high.
Marker 2, 22 September 2026. Bar 3 opened at 1.14686, reached 1.14783, fell to 1.14294 and closed at 1.14486. Again the close broke bar 2’s low. The bar’s full range was 49 pips, from 1.14783 down to 1.14294.
So what happened next? On this chart, both worked out in hindsight. The pair kept falling into early October. The last daily bar in the shot closed at 1.11919, which is about 257 pips below the second signal’s close.
However, two good examples prove very little. A chart that trends lower makes bearish signals look smart. The next two sections show thousands of signals, and the answer is very different.
What 37,748 daily candles showed
Across 23 daily FX pairs, our rule found 2,226 bullish and 2,269 bearish patterns.
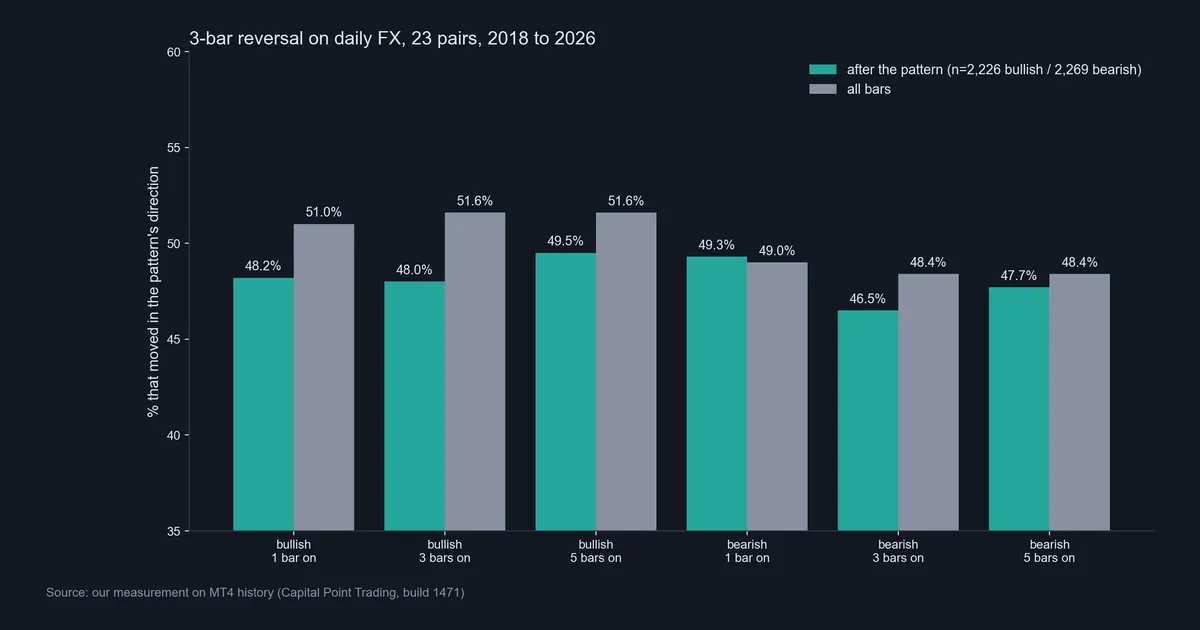
For bullish signals, 48.2% closed higher one bar on. After 3 bars the figure was 48.0%, and after 5 bars it was 49.5%. Meanwhile, the base rate for all bars was 51.0%, 51.6% and 51.6%. So the bullish pattern came in below the base rate at every horizon.
Bearish signals did a little better on day one. 49.3% closed lower one bar on, against a base of 49.0%. After that the edge, such as it was, faded: 46.5% after 3 bars and 47.7% after 5, both under their base rates of 48.4%.
In plain terms, the pattern did not beat a random daily bar on these pairs. A 0.3-point gap on one horizon is noise with a sample this size. Costs would only push these lower. Our page on backtesting transaction costs explains why that matters for short holds.
The 15-minute picture
Next we ran the same rule on M15 bars for EURUSD, GBPUSD, USDJPY and XAUUSD.
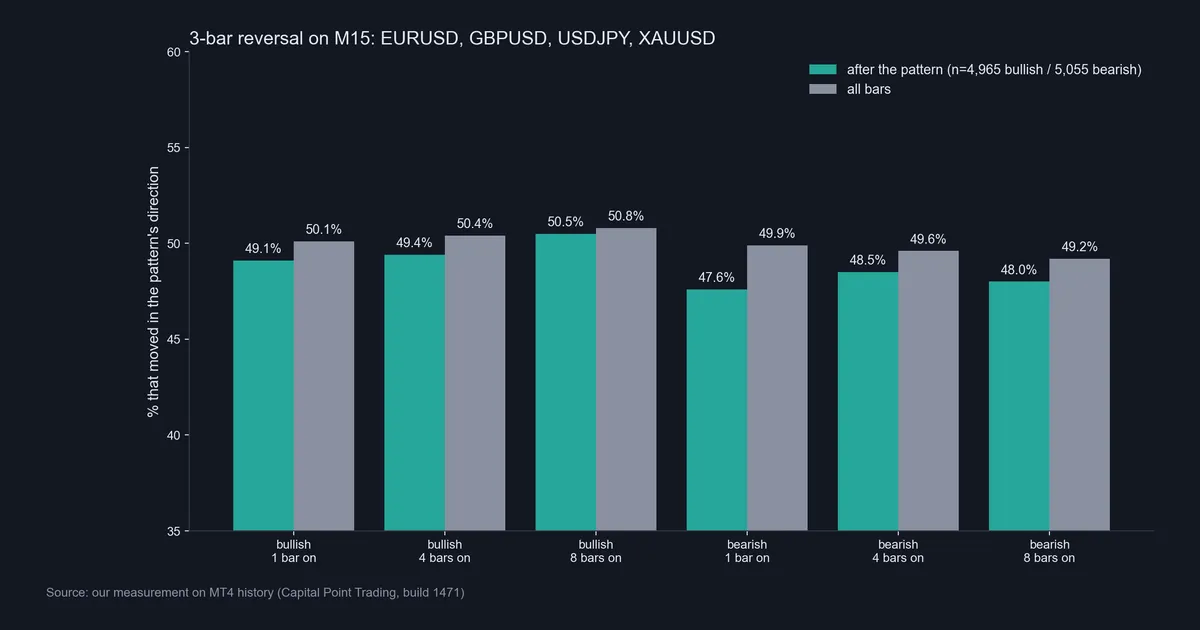
The sample is larger here: 4,965 bullish and 5,055 bearish signals. Bullish patterns closed higher 49.1% of the time one bar on, 49.4% four bars on and 50.5% eight bars on. The base rates were 50.1%, 50.4% and 50.8%. So again, every bullish figure sat just below the base.
Bearish M15 signals were weaker still. 47.6% closed lower one bar on, against a 49.9% base. Four bars on, it was 48.5% against 49.6%. Eight bars on, 48.0% against 49.2%.
Same verdict, faster timeframe. Every M15 figure we measured fell short of its base rate. With over 10,000 signals, sample size is not the issue. For more on why large samples settle questions like this, see our guide on backtest sample size.
Download the complete indicator database
Put these concepts on your charts. One email unlocks the full library of 1,380+ indicators with compiled MT4 and MT5 files, plus my TradingView scripts. No paywall, no spam, unsubscribe any time.
Get free access to my indicator database
One email unlocks 1,380+ free MT4, MT5 and TradingView indicators — the complete library. No single-tool download; you get the whole database.
Where it fails
The biggest failure is the one our data shows. On its own, the 3-bar reversal did not predict direction better than a random bar on 23 daily pairs or four M15 symbols.
Next, it fires late. The middle bar must make a new extreme, and bar 3 must close past it. By then, a good part of the turn may be gone.
Also, it fires often. Choppy, ranging price creates small three-bar turns all the time. Each one fits the rule, yet most mean nothing. Our chart pattern failure guide covers the same trap for larger shapes.
Finally, the open bar misleads. On TradingView a live bar can show the shape for a few minutes and then lose it. If you act before the close, you trade a pattern that never formed.
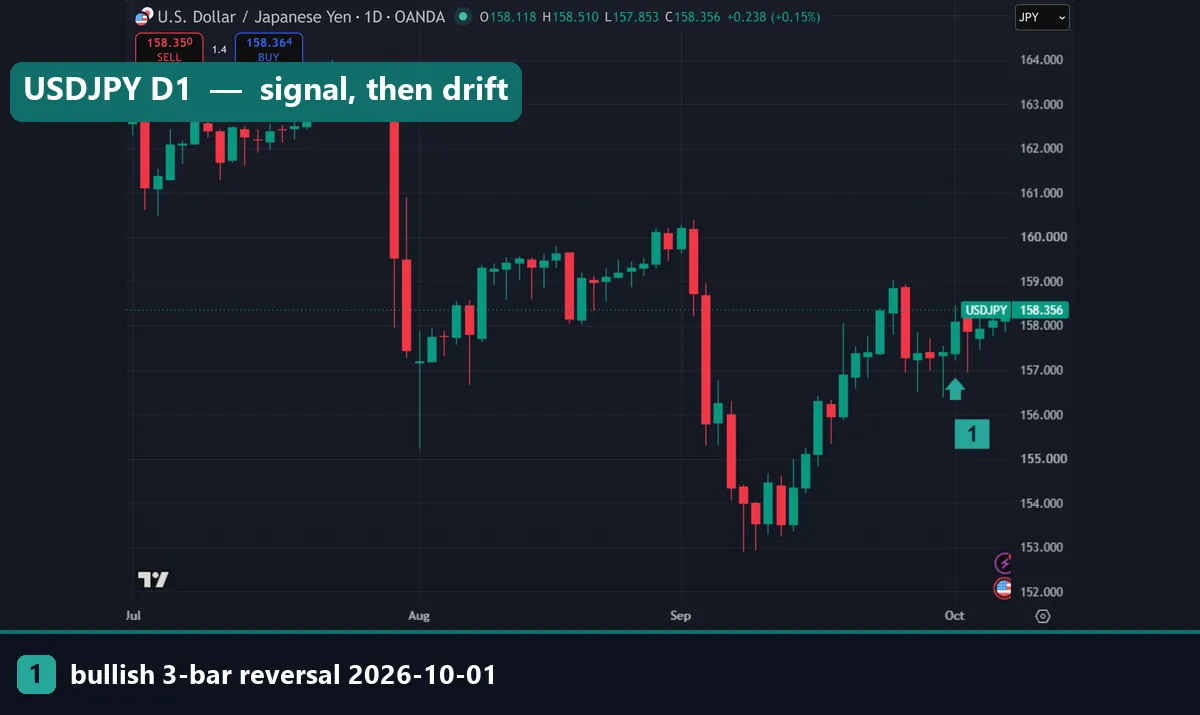
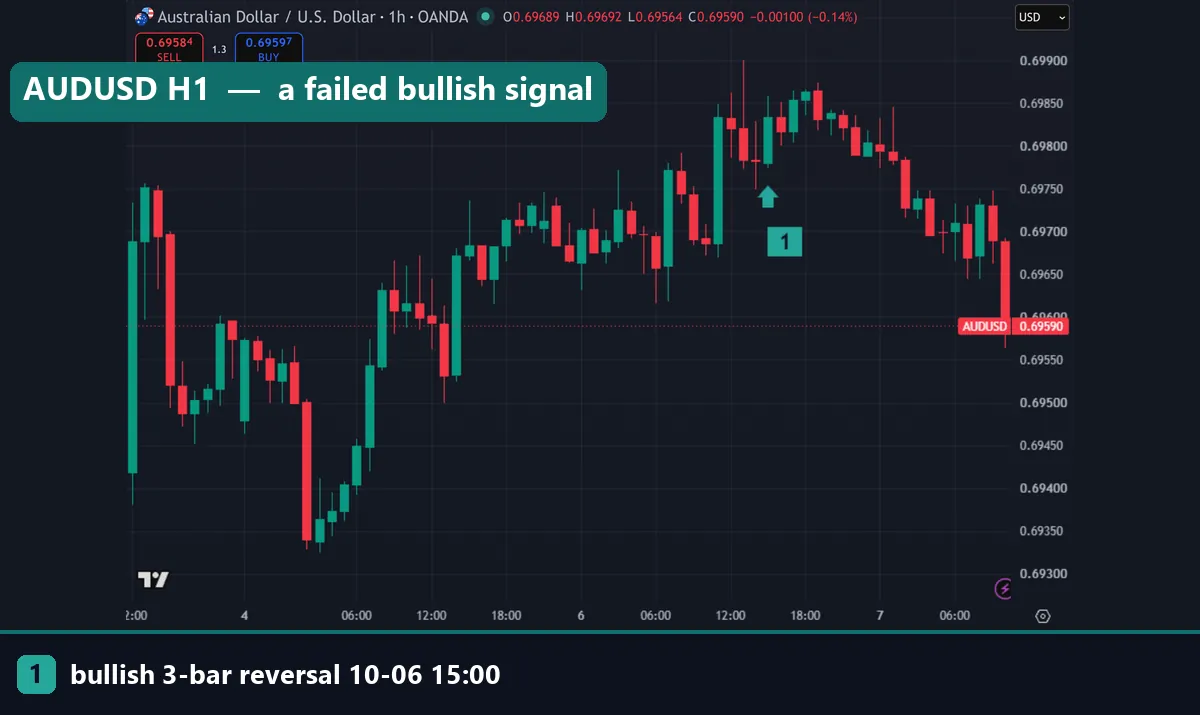
Two signals that went nowhere
On USDJPY daily, the marked bullish bar of 1 October 2026 opened at 157.385 and closed at 158.088. Its range ran from 157.226 to 158.457. In the days after, the pair moved sideways. The last bar in our shot closed at 158.323, only about 24 pips above the signal close. That is neither a win nor a loss, just drift.
On AUDUSD hourly, the bullish bar at 15:00 UTC on 6 October 2026 closed at 0.69834. Price edged up for a few hours, then rolled over. By the last bar in the shot it had closed at 0.69590, about 24 pips below the signal. So this one failed outright.
Near a 50/50 split, expect plenty of flat and failed cases like these, even when each looks clean as it forms.
Common mistakes with the 3-bar reversal
- Acting before bar 3 closes. The rule depends on a close. A mid-bar break of bar 2’s high is not the pattern, and it often reverses before the close.
- Trusting a few clean examples. Our EURUSD shots look convincing, but 4,495 daily signals tell the real story. Judge a pattern against its base rate.
- Ignoring costs on short holds. On an M15 trade held one bar, spread takes a large slice of the move.
- Using it without context. A signal in the middle of a range has nothing behind it. If you use the shape at all, use it at a level you already marked, and size the stop with something like the ATR stop method.
Where to go next
If you want to test the pattern yourself, start with TradingView’s market replay mode. It steps through bars one at a time. Our TradingView chart guide covers the basic chart setup first.
For related shapes, read our pages on the engulfing candle and the pin bar. Then read do candlestick patterns work for the wider evidence.
Outside our site, StockCharts has a clear primer on candlestick charts at StockCharts ChartSchool. The morning star entry on Wikipedia describes the closest classic cousin. BabyPips gives a short definition of a market reversal at BabyPips Forexpedia. And TradingView’s repainting page, linked earlier, explains bar-close logic in Pine.
FAQ
Does TradingView have a built-in 3-bar reversal indicator?
No. You can find community scripts, but their rules differ. The safer path is to write the four conditions yourself in Pine, as shown above, so you know exactly what each marker means.
What is the rule for a bullish 3-bar reversal?
Bar 1 closes down. Bar 2 makes a lower low than bars 1 and 3. Bar 3 then closes above bar 2’s high. The bearish version mirrors each step.
Did the pattern work in your test?
Not on its own. Across 23 daily FX pairs from 2018 to 2026, bullish signals moved up less often than a random bar at 1, 3 and 5 bars on. M15 results for four symbols were similar, all before costs.
Which timeframe suits the 3-bar reversal best?
We found no timeframe where it clearly worked. Daily and M15 both fell short of their base rates.
Should I trade it on the open bar to get in earlier?
We would not. The pattern only exists after bar 3 closes past bar 2. An early entry trades a shape that may never complete.
Where does the stop go?
Most traders place it beyond bar 2’s extreme, since that bar marks the swing. Check that distance against your risk first.
Is it the same as a morning star or evening star?
They are related, since both use three bars around a turn. The morning star cares about body sizes and the small middle candle. The 3-bar reversal only uses highs, lows and the third bar’s close.
Can I use it with other tools?
Yes, many traders pair it with a marked level, a trend filter or a volatility stop. We did not test those combinations here, so treat any added edge as unproven until you test it; results are not guaranteed; past performance is not indicative of future results.
Last updated: 7 October 2026.

About the author
Written by Dominic Walsh, a Forex trader and MT4/MT5 indicator, Expert Advisor and script developer. Every tool on forexmt4systems.com is tested on live charts before release and ships with ready-to-use compiled MT4 (.ex4) and MT5 (.ex5) files. Learn more about the trader and developer behind this site.
How we build, test and correct every tool: Editorial & Testing Policy. Trading carries risk; see the disclaimer.