
The true strength index (TSI) is a momentum oscillator that smooths price change twice and then scales it between -100 and +100. This guide settles three things. First, it shows what the line measures and how the default 25, 13, 13 settings work. Next, it reads real crosses on five charts. Finally, it reports what 2,601 signal-line crosses on 23 daily FX pairs did over the next ten days. The short answer: the TSI draws a clean picture of momentum, but its crosses carried almost no edge in our data.
What the true strength index is
William Blau designed the TSI and described it in his book on momentum, published by Wiley. Raw momentum, today’s close minus yesterday’s close, jumps around too much to read. So he smoothed it twice in a row. Then he divided the result by the same double smoothing of the absolute change. That ratio removes the scale of the market, so a reading on EURUSD and a reading on gold mean the same thing.
The output swings around a zero line. Above zero, the smoothed up moves outweigh the smoothed down moves. Below zero, the opposite holds. Most platforms also draw a signal line, which is an EMA of the TSI itself. That gives two lines, much like the MACD line and its signal line. The true strength index entry on Wikipedia gives the same structure and credits Blau.
How the TSI formula works
The math has four small steps.
- Take momentum:
m = close - close[1]. - Smooth it twice:
EMA13( EMA25( m ) ). - Smooth the absolute value the same way:
EMA13( EMA25( |m| ) ). - Divide step 2 by step 3 and multiply by 100.
So the full formula reads TSI = 100 x EMA13(EMA25(m)) / EMA13(EMA25(|m|)). The signal line is then EMA13(TSI). If every bar closed higher, the TSI would print +100; if every bar closed lower, -100. FX pairs rarely get near either end.
The double smoothing is the whole point. A single exponential moving average still lets sharp one-day moves through. A second EMA on top flattens them further. That makes the line smooth, but it also makes it late. TradingView’s own True Strength Index help page at TradingView lists the same two lengths and the signal input.
How we tested
We ran two separate checks. First, we read the MetaTrader 4 terminal history from Capital Point Trading, MetaTrader 4 build 1471. The sample covered 23 FX pairs on the daily timeframe, from 12 June 2018 to 24 August 2026. We computed TSI(25, 13) with a 13-period signal line. Then we logged every cross of the TSI over or under its signal, and every cross of the zero line.
For each cross, we asked one question: was the close 10 bars later higher or lower than the close on the cross bar? Next, we compared that with all bars over the same 10-bar horizon. That is the base rate, and a signal only helps if it beats it.
The second check was visual. On 9 October 2026 we loaded the built-in TSI on the TradingView web chart with OANDA data. We captured EURUSD, GBPUSD, XAUUSD and GBPJPY on the daily chart, plus USDJPY on the 1-hour chart. Our method notes sit on the editorial testing policy page. All results are before spread, swap and commission.
TSI settings and what each one does
The TradingView version has three inputs. The table shows the defaults we used and what changes when you move each one.
| Input | Default | What it controls | Shorter value | Longer value |
|---|---|---|---|---|
| Long Length | 25 | First EMA on momentum | Faster, noisier line | Slower, smoother line |
| Short Length | 13 | Second EMA on the first result | Turns sooner | Turns later |
| Signal Length | 13 | EMA of the TSI itself | More crosses | Fewer, later crosses |
| Timeframe | Chart | Which bars feed the math | A higher timeframe gives a stepped line on a lower chart | |
The two lengths work as a pair. So cutting only the signal length does not make the TSI faster. It just adds crosses. If you already tune the MACD settings, the same trade-off applies here.
Reading the TSI on a daily chart
In our captures the blue line is the TSI, the red line is the signal and the dashed line marks zero. Two things matter: which side of zero the TSI sits on, and which line sits on top.
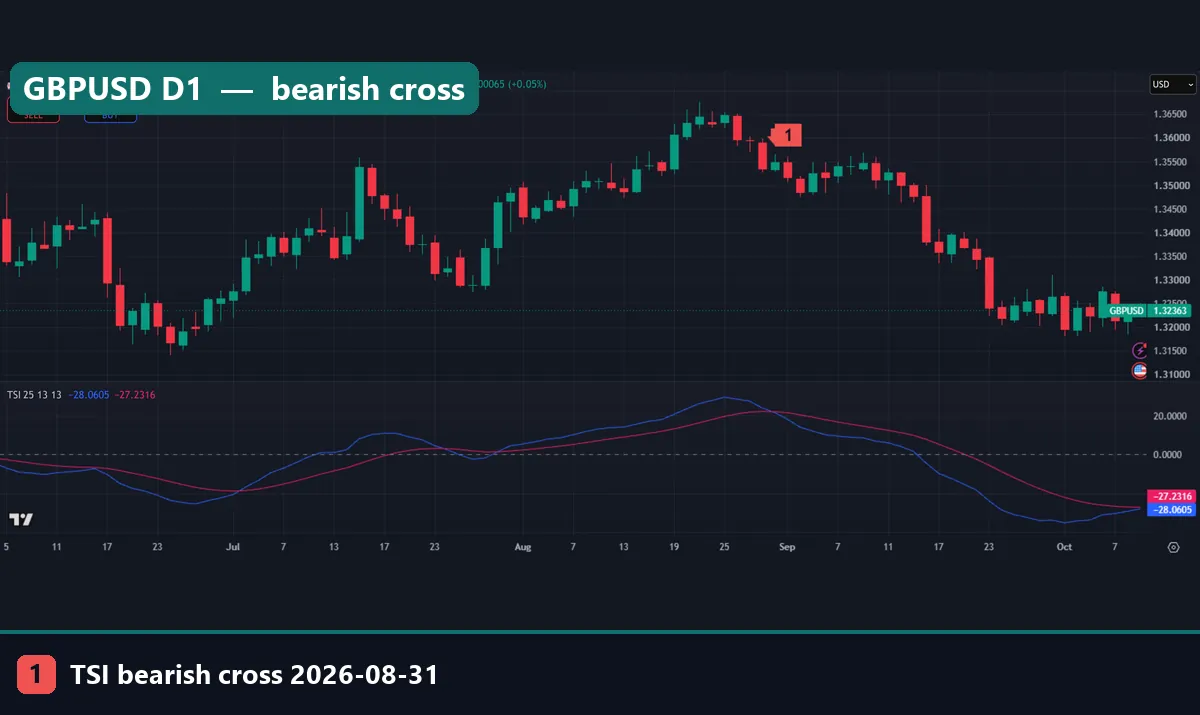
On GBPUSD, the TSI rose above zero through July and August. Then it turned and crossed under its signal on 31 August 2026. That cross bar closed at 1.35489. At the right edge of the chart, the last close reads 1.32363. So the bearish cross did point the right way this time. But look at the pane at the right edge as well. The TSI reads -28.0605 and the signal reads -27.2316. The two lines are almost touching again, so a bullish cross is close.
Also notice the July stretch on the same chart. The TSI dipped under its signal on 24 July 2026 at a close of 1.33239. Then it crossed back up on 30 July at 1.34644. So the bullish cross bar closed 0.01405 above the bearish one, about 140 pips the wrong way, inside six days.
The same indicator on a 1-hour chart
On lower timeframes, the TSI crosses much more often. The lengths now count hours, not days, so noise grows.
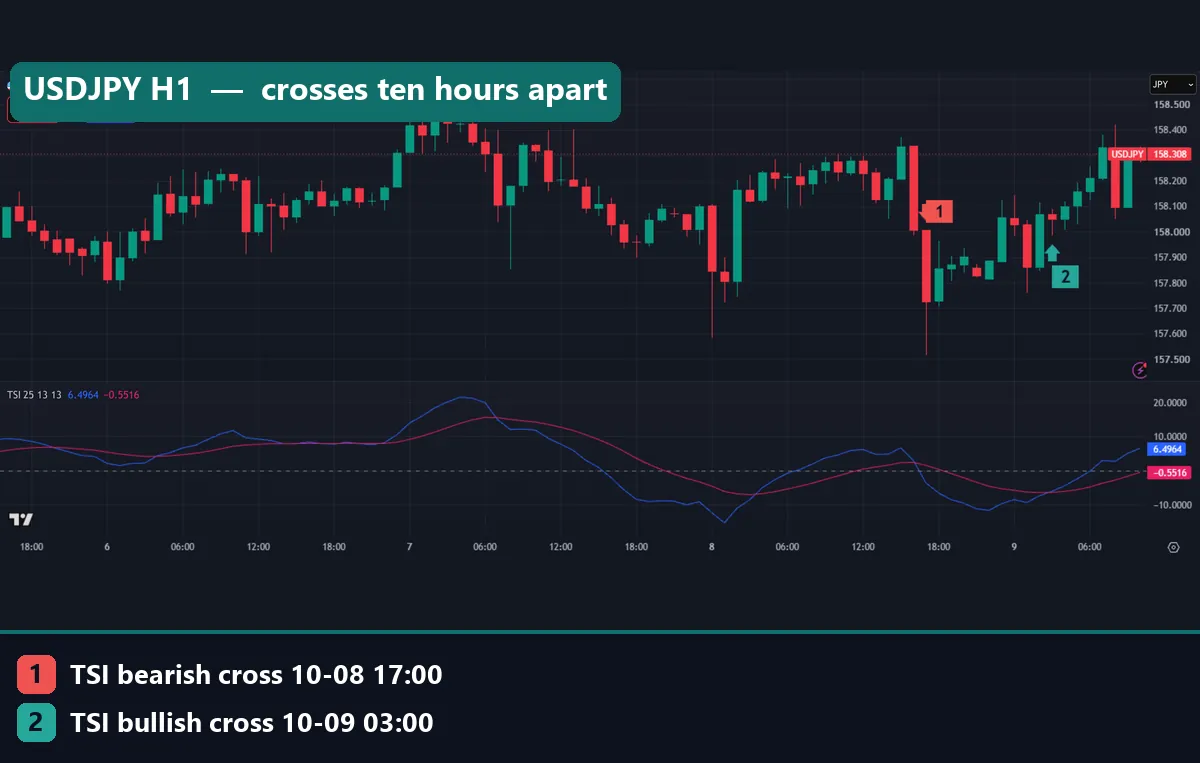
On USDJPY H1, the TSI crossed down at 17:00 UTC on 8 October 2026, on a bar that closed at 157.727. Only ten hours later, at 03:00 UTC on 9 October, it crossed back up at 158.052. At the right edge, price sits at 158.308, with the TSI at 6.4964 above a signal of -0.5516. In fact, this pair produced five crosses between 22:00 UTC on 6 October and 03:00 UTC on 9 October. That is about one cross every 13 hours. For that reason, many traders pair an H1 TSI with a daily read, as our multi-timeframe analysis guide explains.
Worked example: EURUSD from July to October
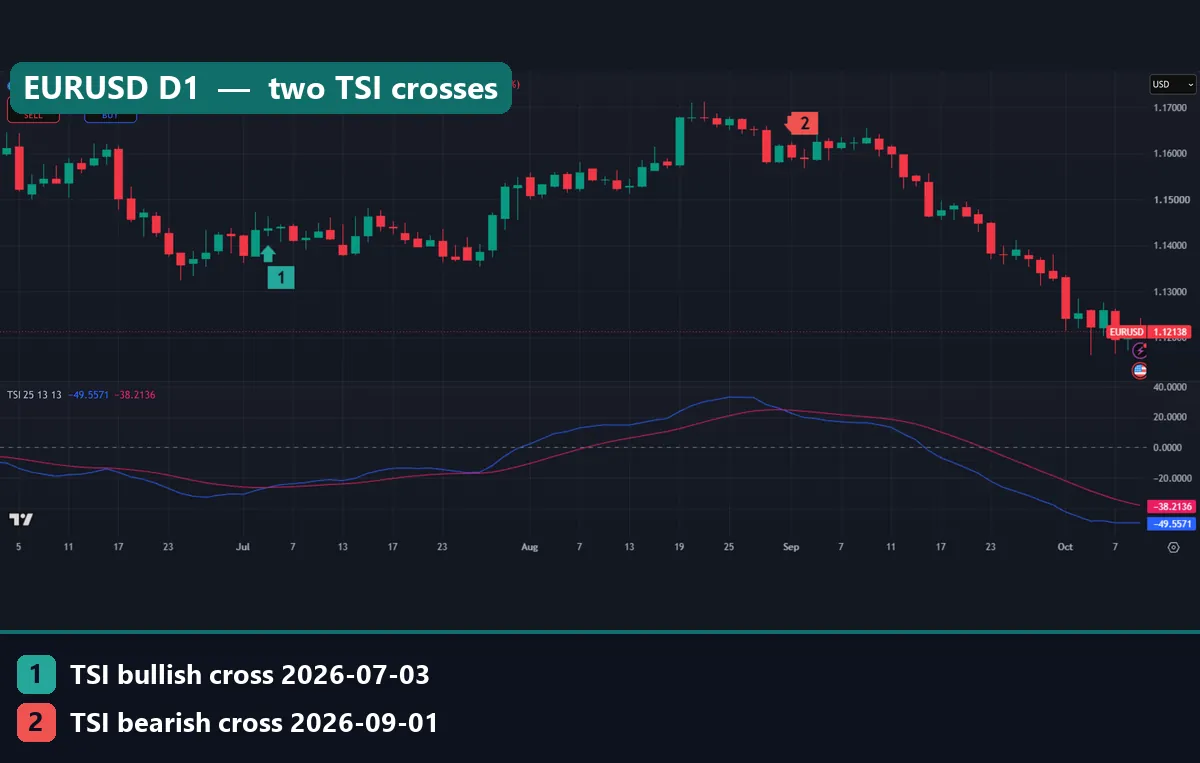
Go back to the first image, EURUSD on the daily chart. Both markers come from our TradingView data.
- Marker 1, bullish cross, 3 July 2026. The bar opened at 1.1433 and closed at 1.14376.
- Marker 2, bearish cross, 1 September 2026. The bar opened at 1.16178 and closed at 1.15923.
- Right edge, 9 October 2026. The last close reads 1.12138. The TSI sits at -49.5571 and the signal at -38.2136.
So, from cross to cross, the close moved from 1.14376 to 1.15923. That is a gain of 0.01547, or about 155 pips, before costs. Then, from the bearish cross to the right edge, the close fell from 1.15923 to 1.12138. That is 0.03785, close to 379 pips.
It looks neat. However, look at what the chart shows between the markers. Price made its high in late August, well before marker 2. The TSI had already rolled over, but the cross itself came several bars after the top. In short, the crosses caught the middle of each swing and gave up both ends.
Also, this pair did not stay this tidy all year. In May 2026, EURUSD crossed down on 4 May, up on 8 May and down again on 13 May. That makes three crosses in nine days, each one reversing the last.
What 2,601 crosses showed in our data
Clean examples prove little, so here is the full count from our MT4 history. Across 23 daily pairs, we found 1,298 bullish and 1,303 bearish signal-line crosses. That works out to about 1.5 crosses per pair per month.
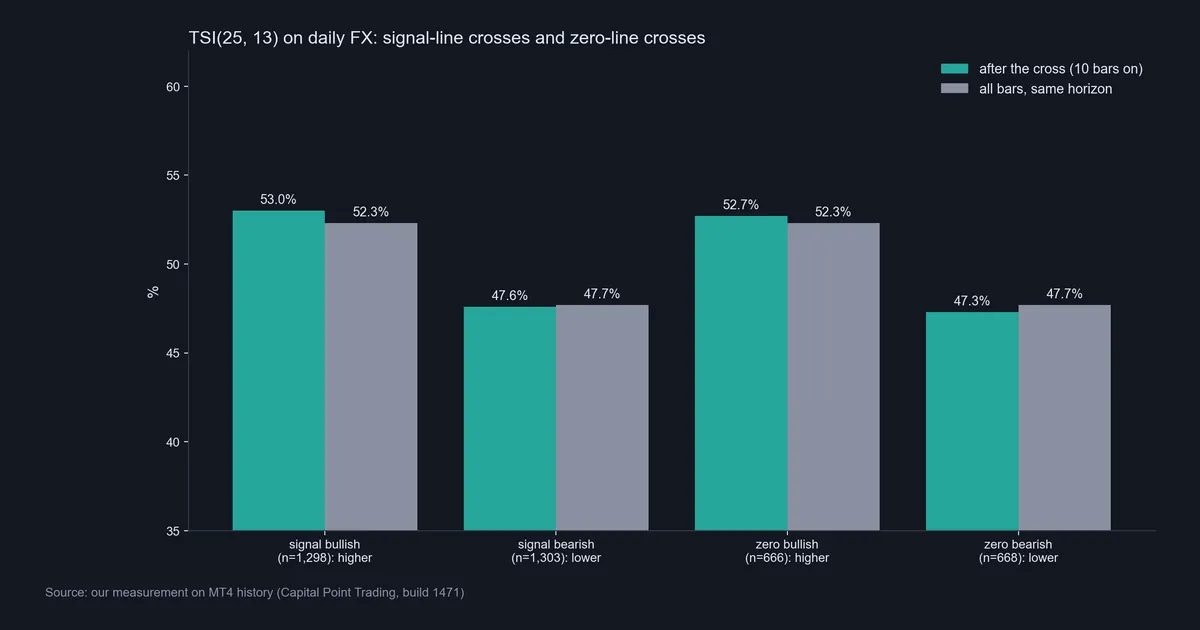
After a bullish cross, the close 10 bars later was higher 53.0% of the time. Yet across all bars, the close 10 bars later was higher 52.3% of the time. So the bullish cross added 0.7 of a point. After a bearish cross, the close was lower 47.6% of the time. The base rate for lower was 47.7%. So the bearish cross did slightly worse than a random day.
The zero line told the same story. We found 666 bullish and 668 bearish zero crosses, about 0.77 per pair per month. Bullish zero crosses led to a higher close 52.7% of the time, against the 52.3% base. Bearish zero crosses led to a lower close 47.3% of the time, against 47.7%.
Those gaps are tiny. They sit well inside what you would expect from chance at these sample sizes. Our backtest sample size guide covers why a 0.7 point edge needs far more trades to mean anything. And because these figures come before costs, spread alone could erase it.
Gold: the same cross in dollars
The TSI is a ratio, so it reads the same on gold. We quote gold in dollars, not pips.
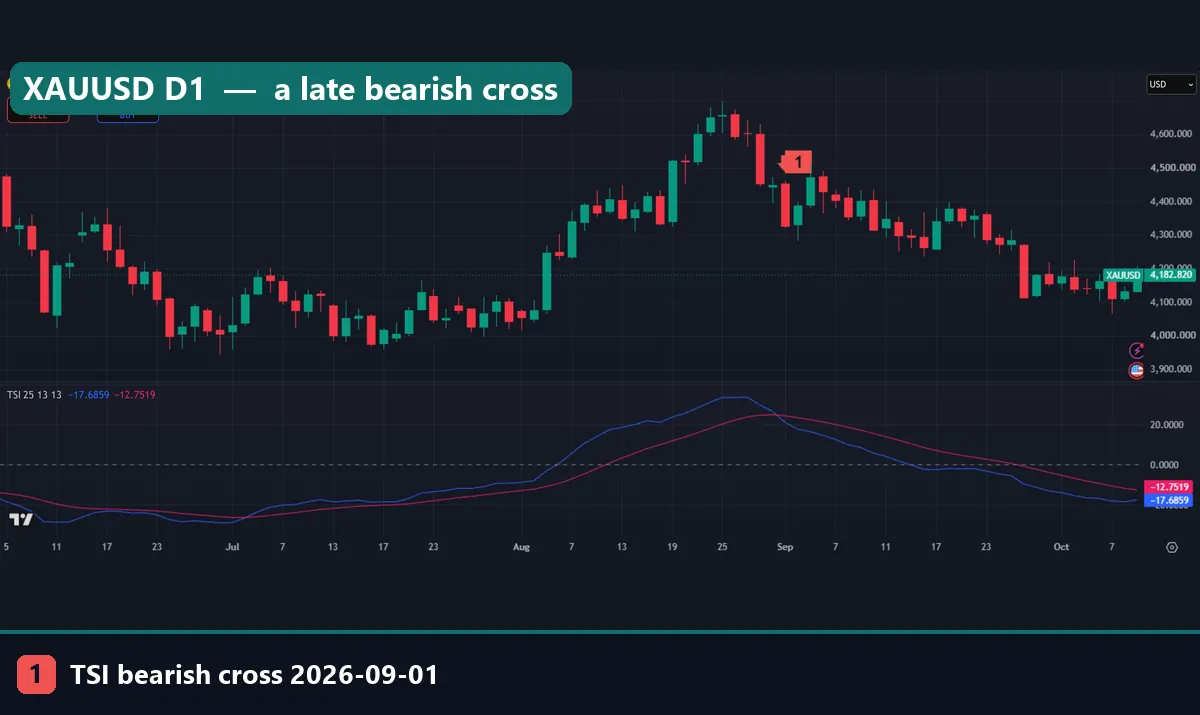
On XAUUSD, the TSI crossed under its signal on 1 September 2026. That bar opened at 4,454.255 and closed at 4,328.405. By the right edge of our capture, gold closed at 4,182.820. So the close sat $145.585 below the cross bar. But the chart shows a sharp drop in late August first. The cross arrived after a big chunk of that fall had already printed. Earlier, the bullish cross on 3 July 2026 closed at 4,175.695, close to where gold sits now. So after two crosses, gold sat near where it started.
Download the complete indicator database
Put these concepts on your charts. One email unlocks the full library of 1,380+ indicators with compiled MT4 and MT5 files, plus my TradingView scripts. No paywall, no spam, unsubscribe any time.
Get free access to my indicator database
One email unlocks 1,380+ free MT4, MT5 and TradingView indicators — the complete library. No single-tool download; you get the whole database.
Where it fails
Our data shows most of its limits.
- No edge in the crosses. Our 2,601 signal crosses and 1,334 zero crosses barely moved off the base rate.
- Late by design. Two stacked EMAs plus a signal EMA mean the cross comes after the turn.
- Whipsaws in ranges. EURUSD in May and GBPUSD in July both flipped back within a week.
- Too many crosses on low timeframes. USDJPY H1 printed five crosses in just over two days.
- Overbought and oversold levels are loose. The scale runs to plus or minus 100, but FX pairs rarely get there. Fixed levels like +25 or -25 fit one pair and miss another.
Also, divergence between the TSI and price can last a long time before anything happens. Our divergence in trading guide covers why that read needs confirmation.
Changing the lengths in TradingView
The settings window is short.
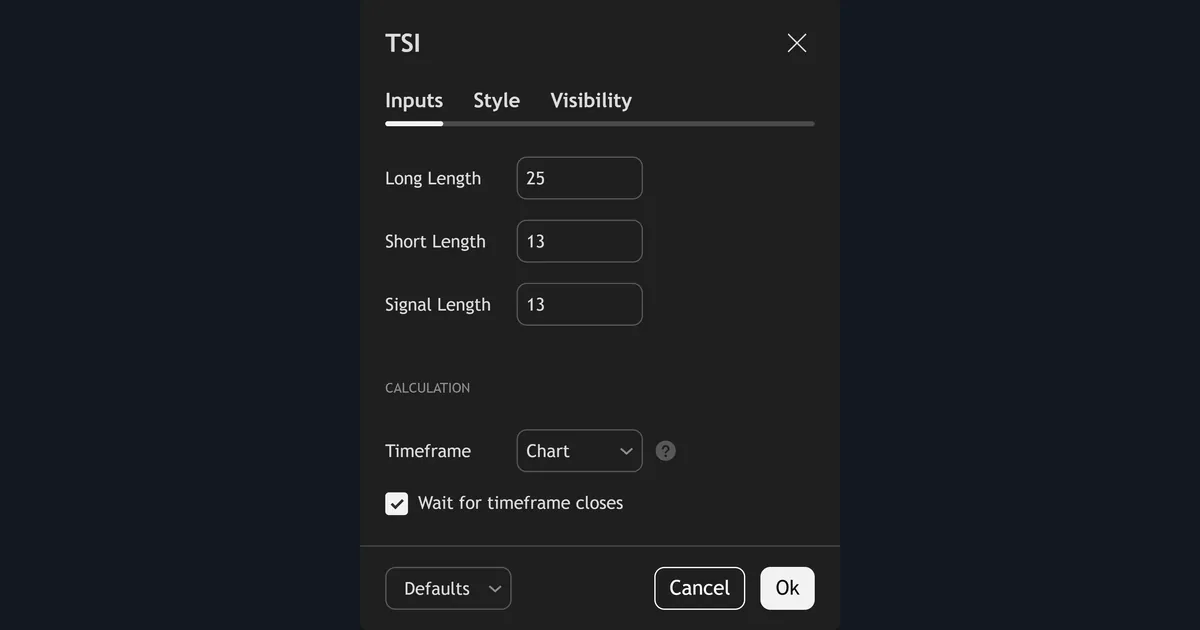
The Inputs tab shows Long Length 25, Short Length 13 and Signal Length 13. Below them, the Calculation block sets Timeframe to Chart, with “Wait for timeframe closes” ticked. Keep it ticked so a higher-timeframe value cannot change while its bar is open. That said, changing the lengths will not create an edge that the default lacked. It just moves the crosses. Picking the lengths that looked best on last year’s chart is a classic case of curve fitting.
A true strength index cross that went nowhere
This bullish cross looked fine on the pane but did little on the candles.
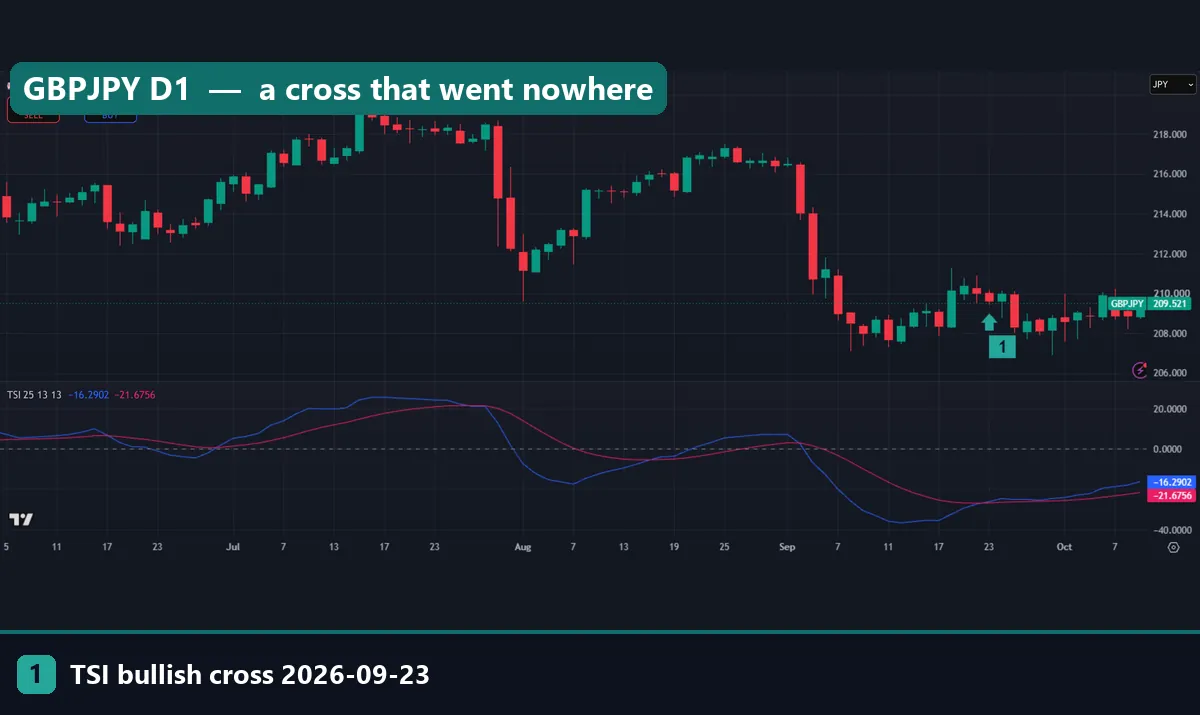
On GBPJPY, the TSI crossed down on 2 September 2026 at a close of 214.043. Price then fell hard. Next, the TSI crossed back up on 23 September 2026 at a close of 209.648. Yet at the right edge, the close reads 209.521, slightly below the cross bar. The TSI reads -16.2902, above its signal at -21.6756, but still well under zero. So the bullish cross marked the end of the fall, not the start of a rise. The pair went sideways for more than two weeks. A buyer at the cross paid spread and swap for a flat chart.
Common mistakes with the TSI
- Trading every cross. At 1.5 crosses per pair per month on the daily chart, and far more on H1, you trade noise. Our data shows no edge in the raw cross.
- Skipping the base rate. A 53% hit rate sounds fine until you learn that 52.3% of all days were already higher 10 bars later. Always compare against doing nothing.
- Ignoring costs. A 0.7 point edge before costs can turn negative after spread and swap. Our transaction costs guide shows how fast that happens.
- Treating zero as a wall. A zero cross is just the double-smoothed momentum changing sign. Our zero-cross figures were no better than the signal crosses.
Where to go next
If you want a second view of momentum, the stochastic momentum index also uses double smoothing, but around the middle of the range. Blau also built a related oscillator, which we offer for MetaTrader as the Ergodic TSI indicator. For a single-smoothed comparison, try the Chande momentum oscillator indicator. Our RSI false signals guide covers the same whipsaw problem. Also, the moving averages explained page covers the EMA math under the TSI.
For outside reading, start with Blau’s own book, Momentum, Direction, and Divergence at Wiley. Then compare the worked tables in the True Strength Index article at StockCharts ChartSchool.
FAQ: true strength index
Who created the true strength index?
William Blau created it. He set out the method in his book on momentum, published by Wiley.
What are the default TSI settings on TradingView?
The built-in version uses a Long Length of 25, a Short Length of 13 and a Signal Length of 13.
What does a TSI reading above zero mean?
It means the double-smoothed up moves outweigh the double-smoothed down moves. It says nothing about how long that will last.
Do TSI signal-line crosses work on forex?
In our daily data on 23 pairs, bullish crosses led to a higher close 10 bars later 53.0% of the time, against a 52.3% base rate. Bearish crosses did slightly worse than the base rate. That is no real edge.
Is the zero cross better than the signal cross?
Not in our sample. Zero crosses happened about 0.77 times per pair per month and stayed within half a point of the base rate.
How is the TSI different from MACD?
MACD subtracts one moving average of price from another. The TSI smooths the bar-to-bar change twice and divides it by the smoothed absolute change, so it stays on a fixed -100 to +100 scale.
Can I use the TSI on a 1-hour chart?
Yes, but expect many more crosses. On USDJPY H1 we counted five in just over two days, so add a higher-timeframe filter.
Is the TSI a reliable trading signal on its own?
No. Use it to describe momentum, then test any rule with costs included, because results are not guaranteed; past performance is not indicative of future results.
Last updated: 9 October 2026.

About the author
Written by Dominic Walsh, a Forex trader and MT4/MT5 indicator, Expert Advisor and script developer. Every tool on forexmt4systems.com is tested on live charts before release and ships with ready-to-use compiled MT4 (.ex4) and MT5 (.ex5) files. Learn more about the trader and developer behind this site.
How we build, test and correct every tool: Editorial & Testing Policy. Trading carries risk; see the disclaimer.