
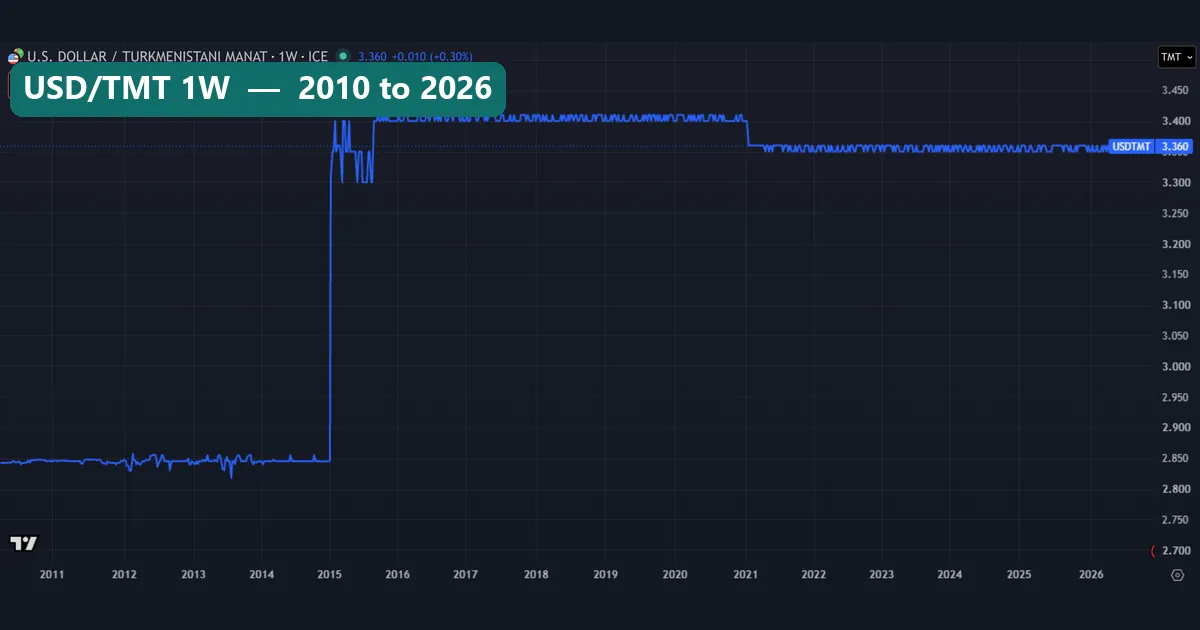
The Turkmen manat is Turkmenistan’s currency, officially fixed at 3.50 per US dollar since 1 January 2015. Yet the TradingView quote we measured has sat between 3.35 and 3.41 for most of that time. We used 3,670 daily prints from April 2010 to November 2026. From them we settle three things: how the rate gets set, how the quote moved, and what it misses.
What the Turkmen manat is
TMT is the code for the manat. The Central Bank of Turkmenistan issues it and publishes one official rate each day. On 17 November 2026, the Central Bank of Turkmenistan’s rate page listed 3.5000 per dollar.
Charts quote the pair as USD/TMT, the number of manat one dollar buys. So a higher number means a weaker manat, and every percentage below depends on that direction.
The manat does not float. Instead, the state ties it to the dollar and moves that tie by decision. Our guide to fiat currency covers state money of this kind. For a peg that ran through a currency board until the euro arrived, compare the Bulgarian lev (BGN).
How the Turkmen manat rate gets set
The central bank sets the rate and rarely moves it. RFE/RL’s report of 2 January 2015 said the bank’s website showed 3.50 on 1 January 2015. The old rate of 2.85 had held since 2009, and the government gave no reason for the change.
A fixed rate only works if people can buy dollars at it. In Turkmenistan that access has limits. The US Commercial Service’s Turkmenistan trade financing guide says the government strictly controls foreign exchange flows and limits conversion. It puts the 2024 black-market rate near 19.4 manat per dollar, roughly six times the official rate.
The same guide adds that these controls make it hard to pay foreign suppliers. That pressure falls on importers, the topic of our explainer on what imports are.
Two short sums carry the rest of this page. The first gives the change in the manat’s value.
manat change (%) = 100 x (earlier USD/TMT / later USD/TMT - 1)
The earlier rate goes on top, since more manat per dollar means a weaker manat. For the official 2015 step, 2.85 / 3.50 – 1 gives -18.6%. The second sum compares any quote with the official rate.
gap to official (%) = 100 x (quote / official rate - 1)
At our last close of 3.36, that gives -4.0%. So the chart prices the dollar 4% below the bank, and the manat looks stronger than it officially is.
How we tested
We pulled FX_IDC:USDTMT on the TradingView web chart on 16 and 17 November 2026. The chart header credits ICE as the source, and TradingView’s USD/TMT symbol page carries the same series. Our daily closes run from 23 April 2010 to 16 November 2026, a total of 3,670 prints. Bars dated 17 November were still forming, so we left them out.
Next, we cleaned the data. On 28 August 2017 one close of 3.6 broke from a 3.40 to 3.41 band. We dropped it from the statistics, although the charts below still draw it as a spike. Then we counted unchanged days, measured each daily move and listed every break of more than five calendar days. We found 35.
A flat stretch, for us, is a run of closes within 0.5% of the close that starts it. Yearly changes run from one year-end close to the next. We placed no trades, so no figure includes a spread or fee. Both data charts come from the same bars, and our editorial testing policy explains how we treat vendor data.
Key figures from 3,670 daily prints
All rates are manat per US dollar.
| Measure | Value | Date or window |
|---|---|---|
| Official rate | 2.85, then 3.50 | Until 1 Jan 2015; since then |
| First and last close on the feed | 2.8425 and 3.36 | 23 Apr 2010; 16 Nov 2026 |
| Change in the manat’s value on the feed | -15.4% | Whole window |
| Range of closes before 2015 | 2.8175 to 2.8655 | Apr 2010 to Dec 2014 |
| Biggest one-print move | 2.8455 to 3.34 (+17.4%) | 13 Jan 2015, after a 7-day break |
| Highest close (weakest manat) | 3.5, reversed next day | 11 Mar 2015 |
| Median close since 2015 | 3.4 (one print at 3.50) | 2,532 days |
| Longest flat stretch | 814 days at 3.40 to 3.41 | 21 Jul 2017 to 15 Jan 2021 |
| Current flat stretch | 720 days at 3.35 to 3.36 | 7 Dec 2022 to 16 Nov 2026 |
| Median daily move; unchanged days | 0.04%; 38.2% | Whole window |
| Breaks over 5 days | 35 (longest 25 days) | 14 Aug to 8 Sep 2015 |
In short, a normal day barely moves this quote. A few single prints carry nearly all the change, and only one of them was policy.
Reading the 2015 jump on a chart
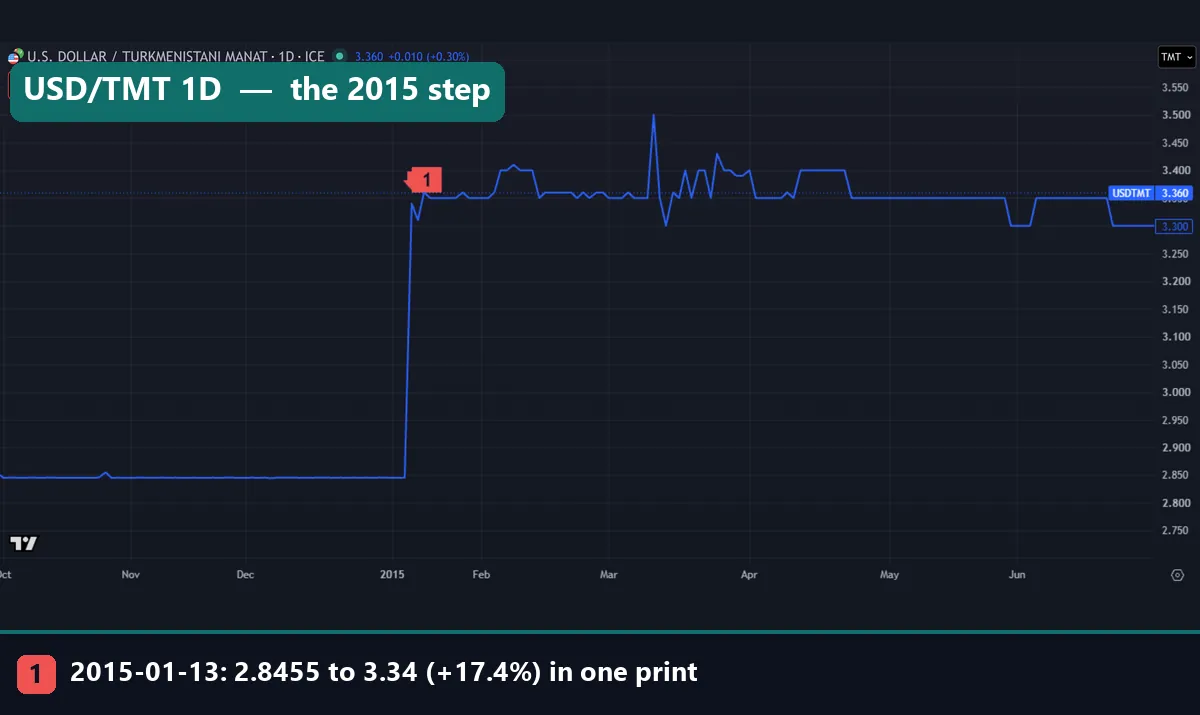
This daily line runs from October 2014 to June 2015. Until early January the quote rests near 2.845. It still printed the old level on 6 January, five days after the official change. Then it went silent for a week.
Marker 1 sits on 13 January 2015, the first print after that break. The quote jumped from 2.8455 to 3.34, or 17.4%, in one step. So the chart dates the devaluation twelve days late.
After the step, the quote never settles at 3.50. It hops between about 3.30 and 3.43 through the spring. On 11 March it prints 3.5, our highest close, and falls back to 3.35 a day later. Near the start of June, and again late in the month, the line dips to 3.30.
The flat years: 814 days near 3.40
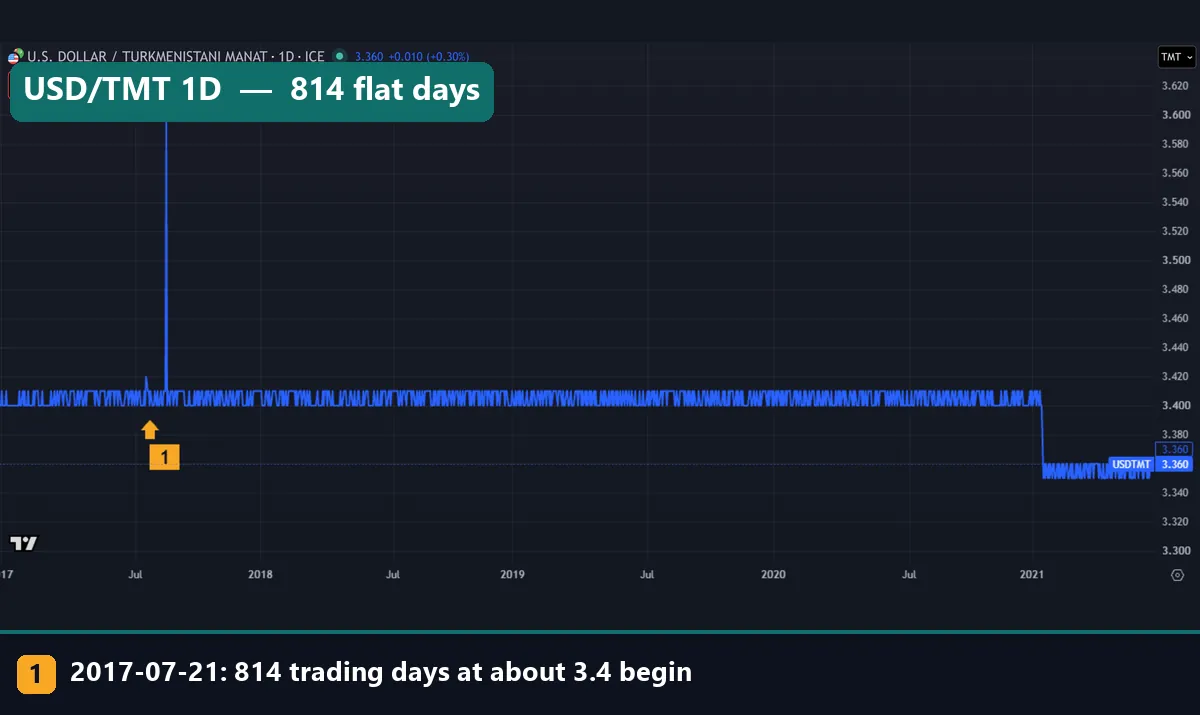
From mid-2017 the quote barely moves. Marker 1 sits on 21 July 2017, the start of our longest flat stretch. For 814 trading days, through 15 January 2021, every close lands on 3.40 or 3.41. The line only looks busy because the scale zooms in on a band one cent wide.
Look closer and two details appear. The tall needle in August 2017 is the 3.6 print we removed, and it lasted one day. Then, in January 2021, the run ends with a step down. After a six-day break it returns at 3.36 on 21 January, 1.47% lower. That means a slightly stronger manat, which gained 1.2% over 2021 on this feed.
As far as our sources show, the official rate stayed at 3.50 all along. So the 2021 step belongs to the vendor, not to policy.
Worked example: 1,000 dollars at three prices
A firm needs to price 1,000 US dollars in manat. It gets three answers. At the official 3.50, the dollars equal 3,500 manat. At our last close of 3.36, they equal 3,360 manat, or 140 fewer.
The 2024 black-market figure of around 19.4 would have turned them into about 19,400 manat.
Now run it the other way. One thousand manat buy 285.71 dollars at the official rate but 297.62 at the vendor quote. So a sheet fed from the chart overstates a manat balance by 11.91 dollars per thousand. That is about 4.2%. Our currency converter does this sum for the pairs it lists, but always check whose rate sits behind a tool.
Last, the 2015 cut itself. Officially, the manat lost 18.6% of its dollar value. On this feed the year-end closes of 2.8455 and 3.4 give only 16.3%. The single jump alone gives 14.8%. So a study built on the feed would understate the cut by more than two points.
Each TradingView chart header also shows a sell box at 3.360 and a buy box at 3.660. That gap of 300 points equals about 8.9% of the sell price. We could not tie either box to a real dealer, so we treat both as display values. Our guide to the spread in forex explains why thin quotes carry wide gaps.
The quote against the official rate, year by year
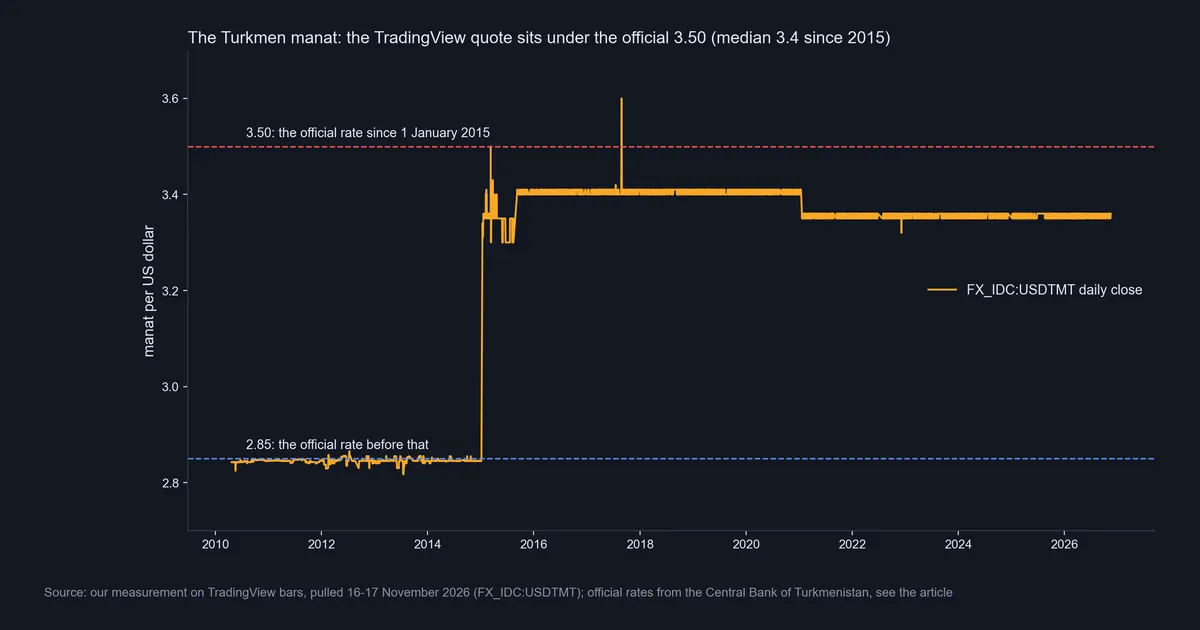
This chart lays the daily close over both official levels. Before 2015 the orange line hugs the blue 2.85 line, from 1.1% below it to 0.5% above. After the jump it never settles on the red 3.50 line. Only two prints reach it: the March 2015 touch and the August 2017 spike to 3.6, our bad print. As the title says, the median close since 2015 is 3.4.
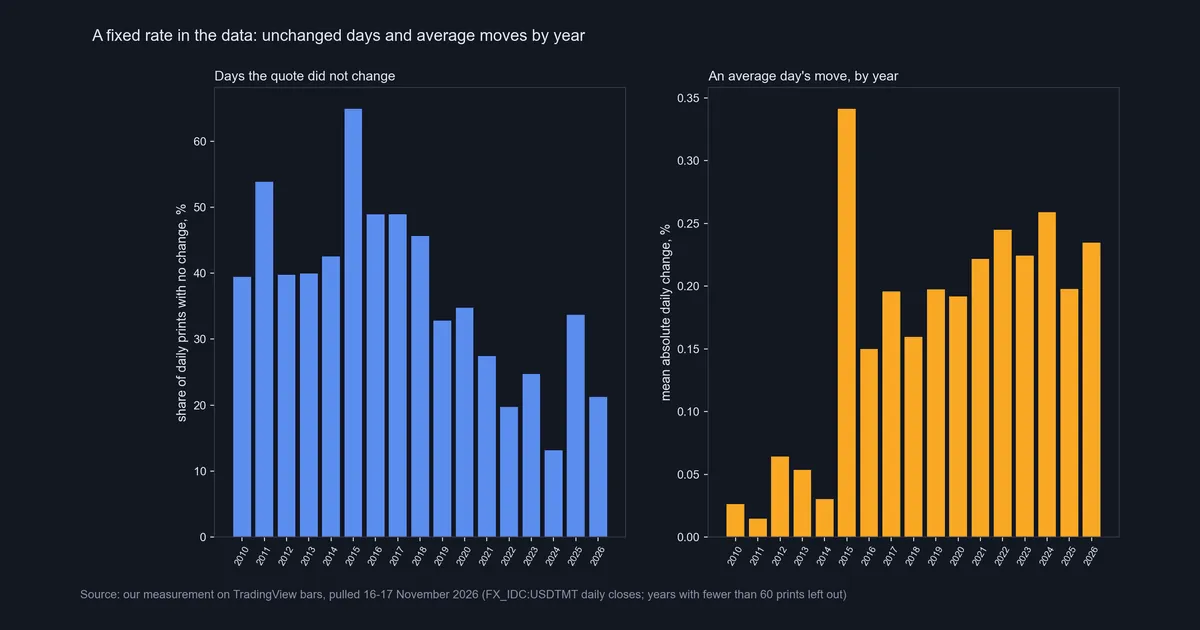
The second chart shows how a fixed rate looks in data. On the left, unchanged days peak at about 65% in 2015 and fall to about 13% in 2024. On the right, the average daily move stays under 0.07% in every year before 2015. Since 2016 it runs between about 0.15% and 0.26%.
That looks like a busier currency, but it is not. Since late 2022 the quote flips between 3.35 and 3.36, about 0.30% each time. More flips mean a bigger average, yet the level has stayed in a one-cent band for 720 days. So the right panel measures feed noise, not risk.
Download the complete indicator database
Put these concepts on your charts. One email unlocks the full library of 1,380+ indicators with compiled MT4 and MT5 files, plus my TradingView scripts. No paywall, no spam, unsubscribe any time.
Get free access to my indicator database
One email unlocks 1,380+ free MT4, MT5 and TradingView indicators — the complete library. No single-tool download; you get the whole database.
Where it fails
One vendor series carries this page, and it has clear limits.
- The quote does not match the official fixing. Since 2016 every close we kept sits between 3.32 and 3.42, while the central bank publishes 3.50. A vendor quote reflects its own sources and rounding.
- Neither number shows the street. We hold no data of our own on the black market, so we cannot chart it.
- Dates lag. The 2015 step shows up twelve days after the official change, so any event study here starts late.
- Breaks hide moves. The longest of our 35 breaks ran 25 days, from 14 August to 8 September 2015, and the quote came back 3.03% higher. A jump after a break is the feed catching up, not that day’s market.
- Tick flips fake volatility. The 0.01 flips inflate tools such as ATR in trading, while the yearly change has stayed within 0.3% either way since 2022.
- Policy moves in one step. The 2015 change came without warning in this data.
The last year: two prices, one cent apart
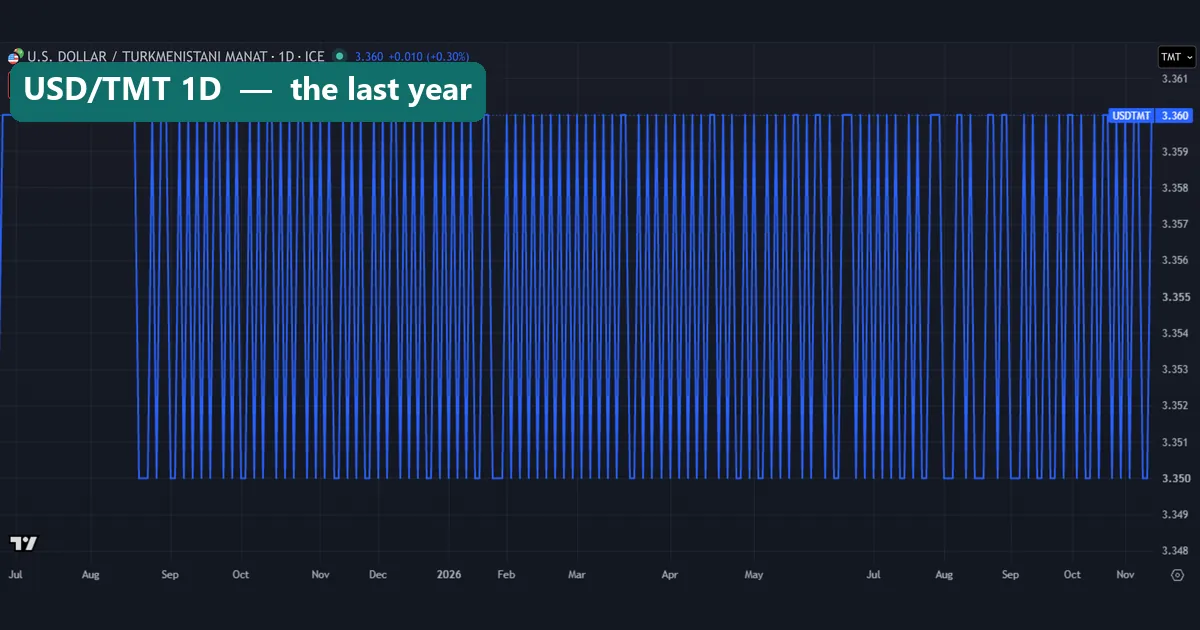
Here the daily line covers July 2025 to mid-November 2026. Into August 2025 the quote holds at 3.360 for several weeks. After that it saw-tooths between 3.350 and 3.360, often day to day. The price scale spans just 3.348 to 3.361.
On a liquid pair, that shape would suggest a fierce fight between buyers and sellers. Here it reads better as two rounded quotes taking turns. Every 2026 close so far sits at 3.35 or 3.36.
The long view on monthly candles
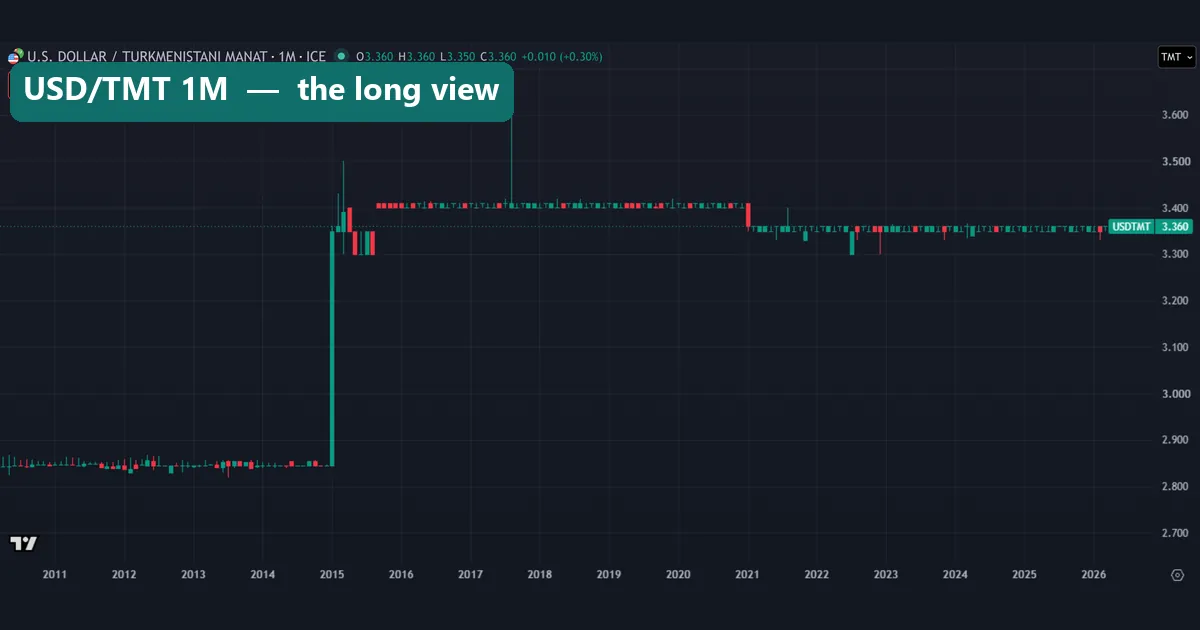
The monthly chart fits sixteen years on one screen. It shows a band near 2.84 until 2014 and one tall green candle for January 2015. Then comes a ledge at 3.40, and a lower one near 3.36 from 2021. Two thin wicks stand out. One reaches 3.50, the March 2015 print, and the other 3.60, our bad 2017 print.
In 2022 some candles also reach toward 3.30, though the lowest close that year was 3.32. So monthly wicks here catch stray ticks that no close confirms. Rules from our guide to candlestick wicks assume many traders behind each tick. This series has a vendor’s rounding behind it instead.
Common mistakes with Turkmen manat quotes
1. Taking the chart as the official rate. The bank says 3.50 and the chart says 3.36. For contracts, tax or accounts, use the bank’s figure and name it.
2. Taking the official rate as the street rate. Controls on buying dollars stop the official price from clearing the market. The 2024 figure near 19.4 shows how wide the gap can run.
3. Dating events from the feed. The devaluation took effect on 1 January 2015, not 13 January. Check an outside record before you tie a move to a date.
4. Treating flips as volatility. A 0.30% move most days sounds lively. Yet since December 2022 the quote has stayed inside 3.35 to 3.36.
Where to go next
Two rankings place the manat among its peers. Read the weakest currency in the world list and its mirror, the most valuable currency in the world. For an official rate that grew a parallel market beside it, read our Egyptian pound guide. For a rate that crawls on purpose, see the Honduras lempira.
To judge a feed before you trust it, try our guide to real-time data on TradingView. For how central banks hold a rate, read whether central banks trade forex. The outside sources appear above: the central bank’s rate page, RFE/RL, the US Commercial Service and TradingView.
FAQ about the Turkmen manat
What rate does the central bank set for the manat?
It has set 3.50 manat per US dollar since 1 January 2015, up from 2.85 before that. Its page listed 3.5000 on 17 November 2026.
Why does TradingView show about 3.36?
The chart shows FX_IDC:USDTMT, a vendor quote credited to ICE, not the state’s fixing. It has sat at 3.35 or 3.36 since December 2022, and we cannot see the vendor’s sources.
When did Turkmenistan last devalue the manat?
On 1 January 2015, from 2.85 to 3.50 per dollar, as RFE/RL reported. The manat lost 18.6% of its dollar value, yet our feed shows the step only on 13 January.
What is the black-market rate for the manat?
The US Commercial Service put it near 19.4 manat per dollar in 2024, roughly six times the official rate. We have no data of our own on it.
Does the state peg the manat to the dollar?
In effect, yes. The central bank sets one rate against the dollar and changes it by decision, as it did in 2015.
How often does the USD/TMT quote change?
Across our window, 38.2% of daily prints showed no change, and the median daily move was 0.04%. Since late 2022 it mostly flips between 3.35 and 3.36.
What was the weakest manat in your data?
The highest close was 3.5 on 11 March 2015, and it reversed the next day. The strongest manat close was 2.8175, on 16 July 2013.
Can I use this data to trade or value the manat?
Treat it as a record of one vendor feed, not a dealing price. It sits 4% off the official rate and far from the street rate, so use it with care: results are not guaranteed; past performance is not indicative of future results.
Last updated: 17 November 2026.

About the author
Written by Dominic Walsh, a Forex trader and MT4/MT5 indicator, Expert Advisor and script developer. Every tool on forexmt4systems.com is tested on live charts before release and ships with ready-to-use compiled MT4 (.ex4) and MT5 (.ex5) files. Learn more about the trader and developer behind this site.
How we build, test and correct every tool: Editorial & Testing Policy. Trading carries risk; see the disclaimer.