
The VIX term structure is the gap between short-dated and longer-dated expected volatility on the S&P 500, and on most days it slopes upward. We measured it on 4,730 daily closes of VIX against VIX3M, from 5 December 2007 to 13 November 2026. This guide settles three things: how often the curve inverts, how long an inversion lasts, and what the S&P 500 did next. The short answers are rarely, briefly, and with only a small edge afterwards.
What the VIX term structure is
The VIX is a 30-day gauge. It takes S&P 500 option prices and backs out how much movement traders expect over the next month. Cboe also runs sister indexes for other horizons. VIX9D looks nine days ahead, and VIX3M looks three months ahead. Line them up by horizon and the curve you get is the term structure.
Cboe’s VIX3M index page describes VIX3M as a constant three-month measure of implied volatility on S&P 500 options. The ticker used to be VXV, and Cboe changed it to VIX3M on 18 September 2017. The same page says the two together give insight into the term structure. That pairing is the one we tested.
There is a second curve as well. On TradingView, VX1! is the front VIX future and VX2! is the next one, and their gap is the futures term structure. If the index is new to you, start with our guide to the VIX chart on TradingView. Our page on futures contracts versus forwards explains dated contracts.
How the ratio works: contango and backwardation
The cleanest way to read the curve is one number: ratio = VIX / VIX3M. On 13 November 2026 VIX closed at 19.3 and VIX3M at 20.62, so the ratio was 19.3 / 20.62 = 0.936. A ratio under 1 means the next month looks calmer than the next three. Traders call that shape contango. A ratio over 1 means near-term fear sits above the three-month view. That shape is backwardation, or an inverted curve.
Why is contango the normal state? Volatility tends to drift back toward its average. A three-month window has more room for a shock, so it usually prices higher. When a shock hits, the near month jumps first. The three-month view rises too, but by less, because traders expect the storm to fade. That is how the ratio crosses 1. Both are standard futures-market terms; see contango explained at Investopedia.
The same logic works for VIX9D / VIX, the very short end, and for VX2! / VX1!, the futures curve. Watch the direction, though: in the futures ratio, a value below 1 is the warning.
How we tested
We pulled daily bars on the TradingView web chart on 16 November 2026. The bars dated 16 November were still forming, so we dropped them, and every series ends on Friday 13 November 2026. We used closes only.
- CBOE:VIX and CBOE:VIX3M: 4,730 shared days, 5 December 2007 to 13 November 2026.
- CBOE:VIX9D against CBOE:VIX: 4 January 2011 to 13 November 2026.
- CBOE:VX1! and CBOE:VX2!, TradingView’s continuous VIX futures: 5,567 days from 26 March 2004.
- SP:SPX daily closes for the S&P 500.
- CBOE:VIX alone from 3 January 1990, for its long-run median of 17.56.
An episode, in our count, is a run of back-to-back closes with VIX above VIX3M. For each of the 130 episodes, we took the S&P 500 close on its first day and measured the change 20 and 60 trading days later. Then we ran the same windows from every day as a baseline. Our method follows the site’s editorial testing policy.
The settings we used
There is little to tune, and these choices sit behind every number.
| Setting | What we used | Why |
|---|---|---|
| Chart symbol | CBOE:VIX/CBOE:VIX3M | TradingView builds the ratio as a spread chart |
| Timeframe | 1D, closes only | Wicks on a ratio chart mislead |
| Line to watch | 1.00 | Above it, VIX sits over VIX3M |
| Episode | Back-to-back closes above 1.00 | Counts runs, not single days |
| Forward window | 20 and 60 trading days on SP:SPX | About one and three months |
| Short-end check | CBOE:VIX9D/CBOE:VIX | Flips more often than VIX/VIX3M |
| Futures check | CBOE:VX2!/CBOE:VX1! | The curve traders can actually trade |
You can type the spread straight into the symbol search. Then add a horizontal line at 1.00.
Reading the VIX/VIX3M chart: early 2020
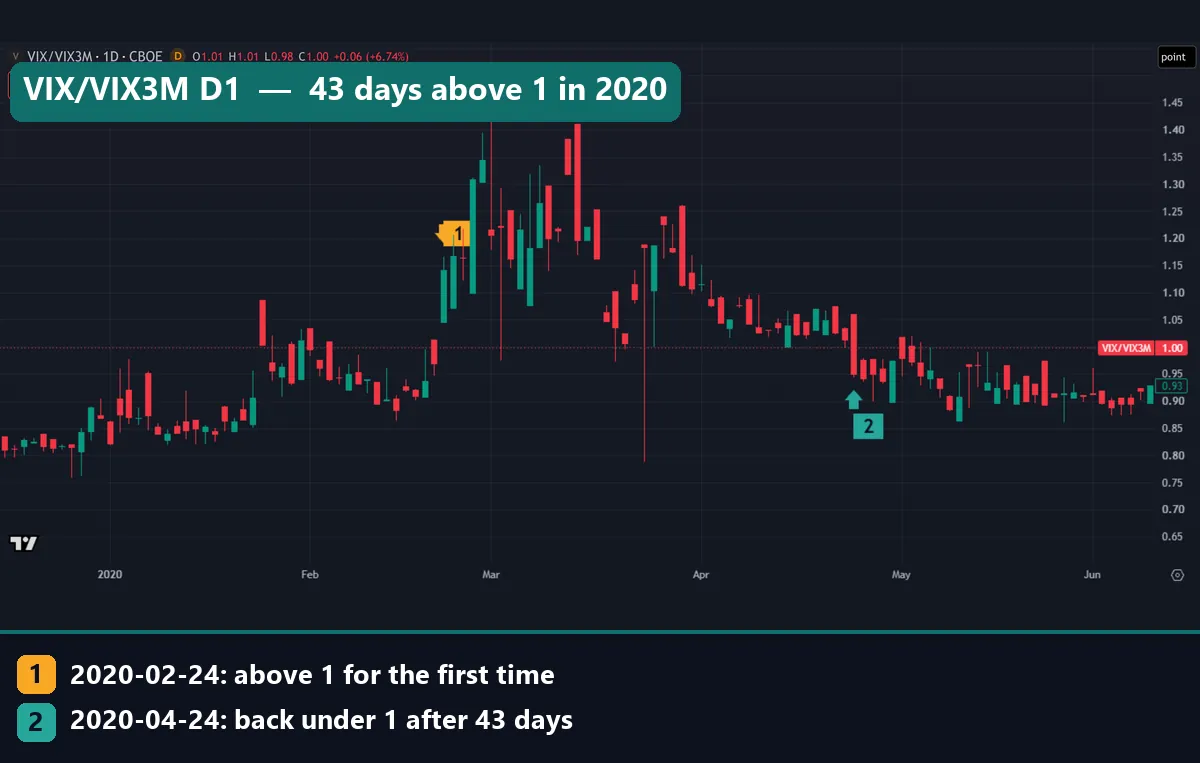
The 2020 chart shows the whole life of a long inversion. Through January the candles sit under the 1.00 line, apart from one-day pokes above it on 27 and 31 January. Marker 1 is 24 February 2020. The ratio closed at 1.1419 that day, its first close above 1 in the run. Four sessions later, on 28 February, it peaked at 1.344 with VIX at 40.11.
March brought wild candles, but no close beat the 28 February reading. Marker 2 is 24 April 2020, the first close back under 1 (0.9503) after 43 straight days above it. In the next two months the only close above 1 came on 11 June 2020, at 1.0089. So the ratio marked the start and end of the acute phase, not the low in stocks.
The 2008 inversion, the longest in our data
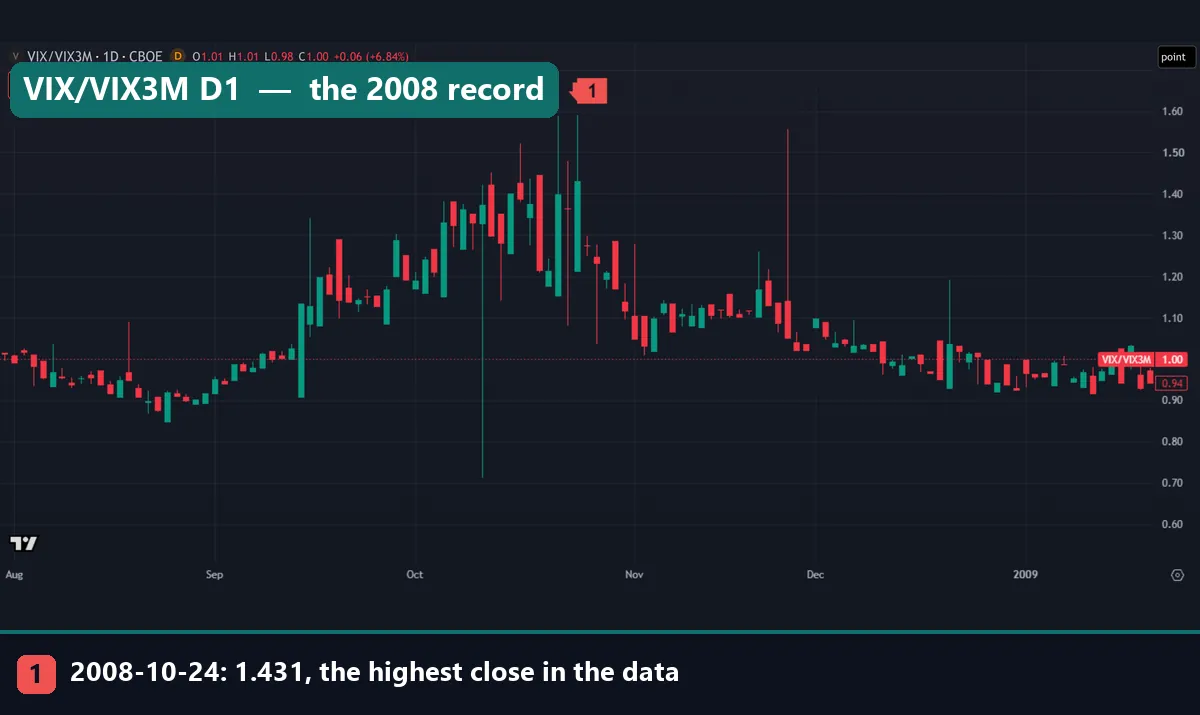
The autumn of 2008 set every record in this test. VIX closed above VIX3M on 11 September 2008 (1.0012) and stayed there for 63 trading days, until 9 December. Marker 1 is 24 October 2008. That day the ratio closed at 1.431 with VIX at 79.13, the highest ratio close in nearly 19 years of data. Our guide to The Big Short covers the housing story behind that autumn.
Now look at the wicks. One candle in early October dips to about 0.71, and one in late November reaches about 1.56, both far from their closes. A ratio chart builds highs and lows from two separate data streams, so read the closes. Across 2008 the ratio sat above 1 on 46.6% of trading days, the highest share of any year.
Worked example: the April 2025 inversion
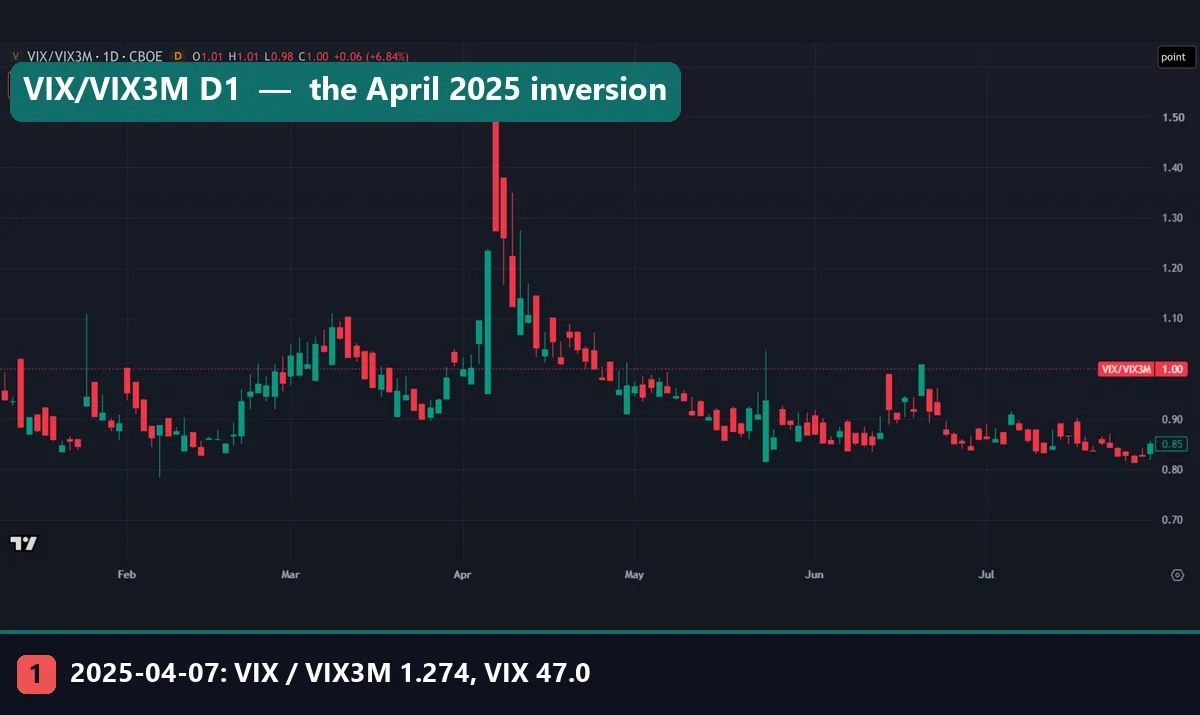
The chart at the top of this page covers January to July 2025, and its numbers make a clean worked example. Here is the sequence of closes.
- 3 to 13 March: nine closes above 1, peaking at 1.0832 on 10 March.
- 2 April: 1.0028, the first day of the main run.
- 7 April: 1.2739, the peak (marker 1), with VIX at 46.98.
- 24 April: 1.0011, the last close above 1.
- 25 April: 0.9791, back in contango after 16 days.
Now do the arithmetic. On 7 April, VIX3M was 46.98 / 1.2739, or about 36.9. Both gauges had jumped, but the one-month view jumped further. StockCharts ChartSchool’s guide to volatility indices turns VIX into a one-month figure by dividing it by the square root of 12, about 3.464. So VIX at 46.98 priced a one-month move of roughly 13.6% either way. By contrast, VIX at 19.3 on 13 November 2026 priced about 5.6%.
The March run was an early sign of stress, and the April run showed fear at its most lopsided. Neither one told you where the bottom was.
How often the VIX term structure inverts
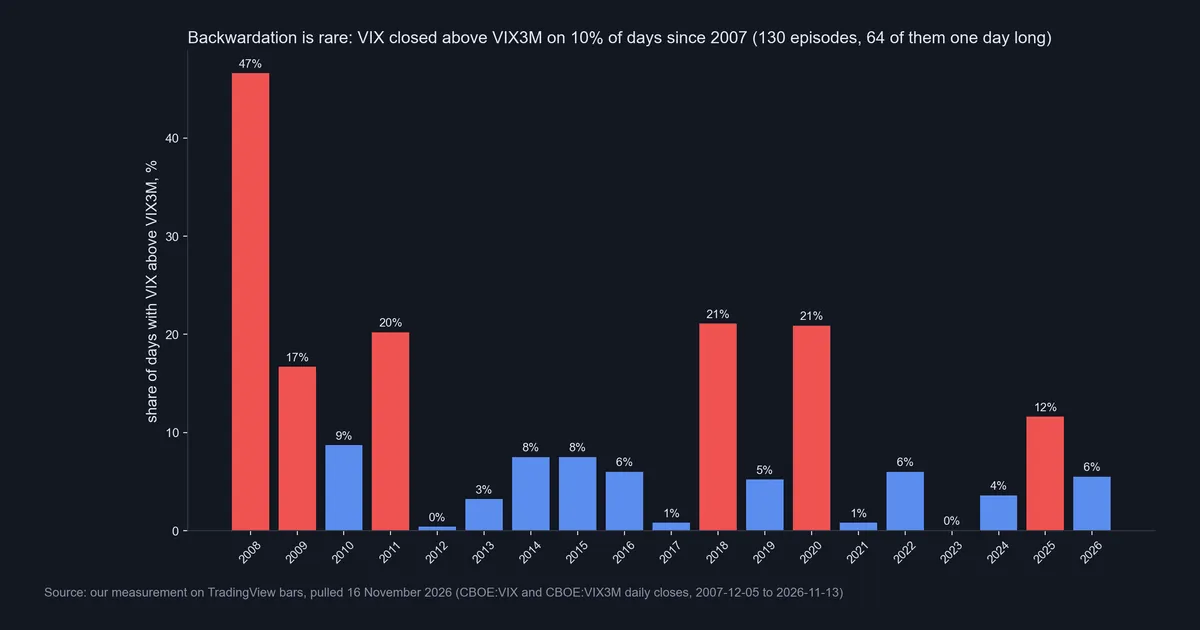
Backwardation is the exception. Over 4,730 days, VIX closed below VIX3M on 89.9% of them and above it on 10.1%. The median ratio was 0.89. The chart above splits the inverted days by year, and the range is wide: 46.6% in 2008, 21.1% in 2018, 20.9% in 2020 and 20.2% in 2011. But it fell to 0.4% in 2012 and zero in 2023. So far in 2026 the share is 5.5%.
The runs are short. We counted 130 episodes. Of those, 64 lasted a single day, and the median run lasted 2 days. Only a few ran long:
- 11 September to 9 December 2008: 63 days, peak 1.431.
- 24 February to 23 April 2020: 43 days, peak 1.344.
- 27 July to 30 August 2011: 25 days, peak 1.26.
- 2 to 24 April 2025: 16 days, peak 1.274.
Some short runs still hit high peaks, such as 1.327 on 5 February 2018. The two-day run of 6 and 7 May 2010 peaked at 1.244, during the flash crash.
What the S&P 500 did after the curve inverted
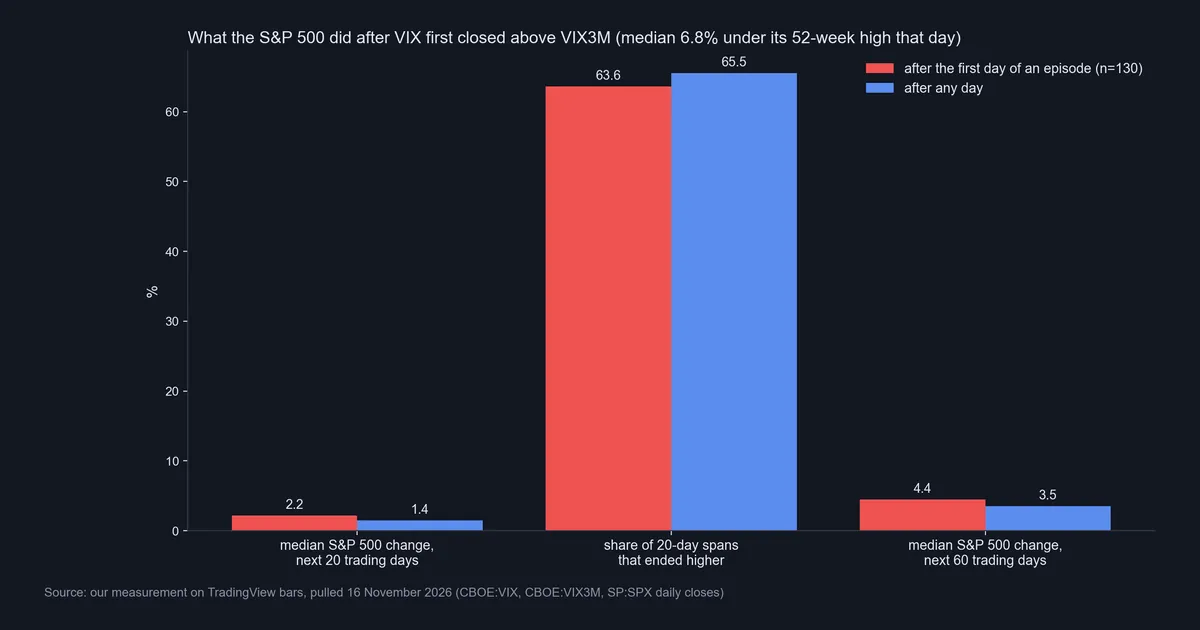
This is the question most people bring to the VIX term structure: is an inversion a chance to buy? We measured the S&P 500 from the first close of each of the 130 episodes. On that day the index sat a median 6.8% under its 52-week high. That is a dip, but short of the 10% line for a market correction.
Over the next 20 trading days the median gain was 2.16%, against 1.44% after any day. Over 60 days it was 4.44% against 3.52%. But the share of 20-day spans that ended higher was 63.6% after an inversion and 65.5% after any day. In other words, the typical result was a bit better, and the odds of a gain were a bit worse.
Read that plainly: a small edge in the median, not a reliable signal. Inverted days also bunch into a few years, such as 2008 and 2020, so those stretches carry a lot of weight. Panic selling has its own cost, as our piece on paper hands shows. Buying into one is the case for going long with a plan and a stop.
Download the complete indicator database
Put these concepts on your charts. One email unlocks the full library of 1,380+ indicators with compiled MT4 and MT5 files, plus my TradingView scripts. No paywall, no spam, unsubscribe any time.
Get free access to my indicator database
One email unlocks 1,380+ free MT4, MT5 and TradingView indicators — the complete library. No single-tool download; you get the whole database.
Where it fails
The ratio is a good thermometer and a poor clock. These are the limits we found.
- Most flips are noise. Of 130 episodes, 64 lasted one day.
- It reacts more than it predicts. By the first inverted close, the S&P 500 was already a median 6.8% off its high.
- The edge is thin. A 20-day median 0.72 points better, with a lower share of gains, is not enough to trade on alone.
- Ratio wicks mislead. Highs and lows on a spread chart come from two data streams.
- Spread charts can repaint. TradingView’s help page says live and historical spread bars may differ.
- Continuous futures roll. VX1! and VX2! switch contracts at expiry, so a one-day jump in their ratio can be a roll.
- It is a stock market gauge. Its link to currencies runs through risk appetite, as our guide to VIX in forex explains.
- You cannot buy the index. Volatility futures and funds behave differently, partly because of contango.
A one-day spike and the futures curve
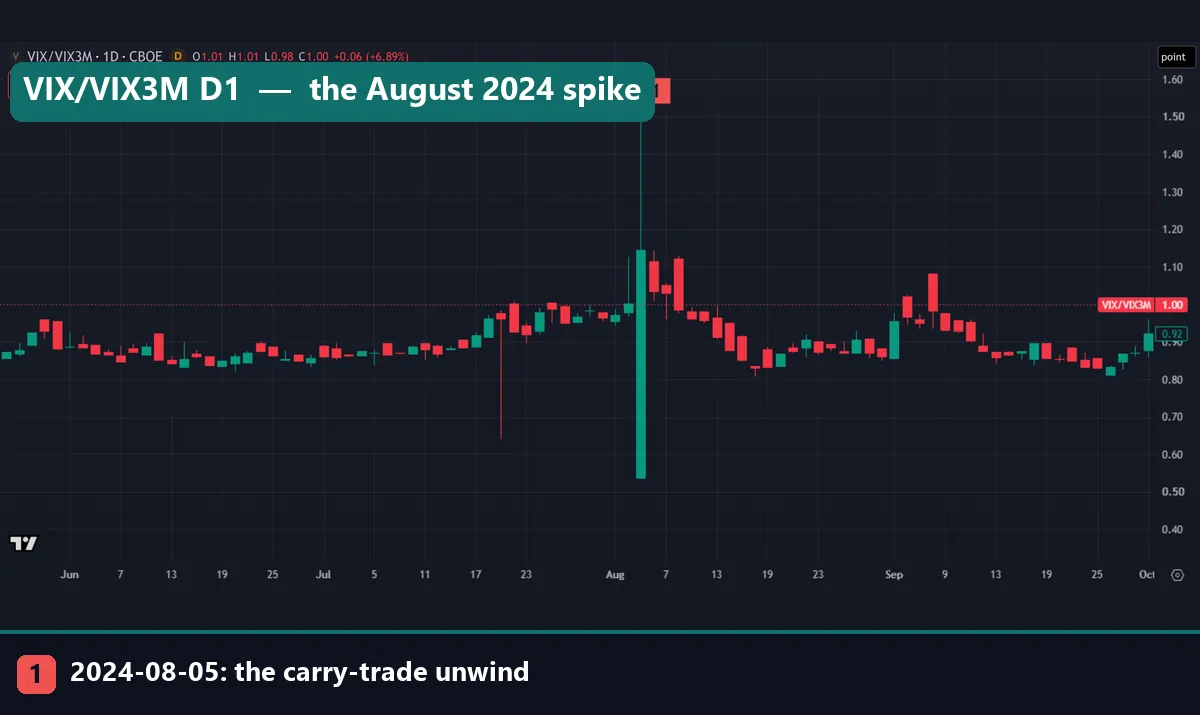
The August 2024 chart shows how one close can fool you. Marker 1 is 5 August 2024, which our label ties to the carry-trade unwind, and the ratio closed at 1.1442. It had crossed 1 on 2 August (1.0021) and fell back to 0.9859 on 8 August, a four-day run. By 16 August the ratio was down to 0.831. Our guide to the carry-trade unwind explains the idea behind the label. The 5 August candle also shows the wick problem at its worst: its range runs from about 0.55 to 1.50, far from the close.
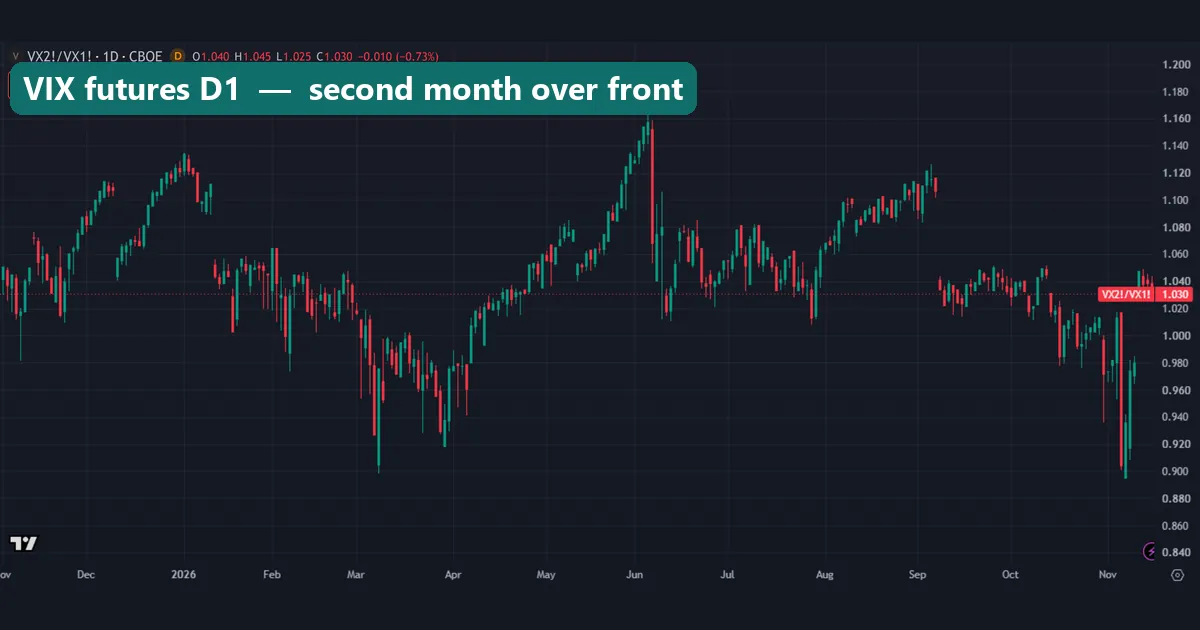
The last chart is the futures version: VX2! divided by VX1! over the past year. Since 2004 the second month sat above the front on 83.2% of days, with a median gap of 5.5%. On this chart the ratio stayed above 1.00 for most of the year, with a top near 1.16 in early June. It dropped under 1.00 in March 2026 and again in early November. Those were the weeks the spot ratio closed above 1: nine times in March, then on 5 and 6 November (1.1029 and 1.0423). The September step, where the bars break off and restart lower, may be a contract roll.
Four common mistakes
- Calling a new regime on one close. Half the episodes in our data lasted two days or less.
- Reading the wrong direction. In VIX / VIX3M, above 1 is stress. In VX2! / VX1!, below 1 is stress.
- Treating a high VIX as an inverted curve. On 13 November 2026 VIX was 19.3, above its 1990 to 2026 median of 17.56, yet the curve sat in contango at 0.936. Level and shape are separate questions.
- Using it as a timing tool on its own. After an inversion the S&P 500 rose over 20 days slightly less often than after any day. Pair it with price, a stop and sensible position sizing.
Where to go next
If the S&P 500 itself is new to you, start with what indices are. For how fear moves currency pairs, read our guide to risk-on and risk-off. To judge a market’s overall bias first, try bullish or bearish. And to build the ratio yourself, TradingView’s help page on spread charts covers the setup.
FAQ: VIX term structure
What is the VIX term structure in simple terms?
It is the shape you get when you line up expected S&P 500 volatility by horizon, from nine days to three months. Most of the time the line slopes up.
What does contango mean for the VIX?
Contango means near-term volatility prices below longer-term volatility. VIX closed below VIX3M on 89.9% of days from December 2007 to November 2026, so it is the normal state.
What does VIX backwardation mean?
It means VIX closed above VIX3M, so the next month looks riskier than the next three. That happened on 10.1% of days in our data, across 130 separate runs.
How do I plot VIX/VIX3M on TradingView?
Type CBOE:VIX/CBOE:VIX3M into the symbol search, pick the daily timeframe and draw a horizontal line at 1.00. Closes above the line mean backwardation.
How long does VIX backwardation usually last?
Not long. The median run in our data lasted 2 days, and 64 of 130 runs lasted one day.
Is an inverted VIX curve a buy signal for stocks?
Not on its own. After the first inverted close, the S&P 500’s median 20-day change was 2.16% against 1.44% after any day, but it rose less often: 63.6% of the time against 65.5%.
Why compare VIX9D with VIX?
VIX9D covers the next nine days, so it reacts faster. It closed above VIX on 26.2% of days from 2011 to 2026, against 10.1% for VIX above VIX3M since 2007, so it flips more often.
Does the VIX term structure matter for forex traders?
Indirectly. VIX comes from US stock options, not currencies, so an inverted curve tells you about risk appetite in general. Use it as background for currency trades, not as a trigger, and remember that results are not guaranteed; past performance is not indicative of future results.
Last updated: 16 November 2026.

About the author
Written by Dominic Walsh, a Forex trader and MT4/MT5 indicator, Expert Advisor and script developer. Every tool on forexmt4systems.com is tested on live charts before release and ships with ready-to-use compiled MT4 (.ex4) and MT5 (.ex5) files. Learn more about the trader and developer behind this site.
How we build, test and correct every tool: Editorial & Testing Policy. Trading carries risk; see the disclaimer.