
A breakaway gap ICT traders talk about is a fair value gap that price never comes back to fill. This guide settles three things. First, what the term means in ICT and how it differs from the classic stock-chart idea. Next, how often such gaps happen in our MT4 data. Last, why you only know a gap was a breakaway gap after the fact.
What a breakaway gap means in ICT
In ICT language, a breakaway gap is a fair value gap that stays open. Price leaves the zone with force and does not return to trade through it. Most gaps get revisited, so traders treat an untouched one as a sign of strong one-sided order flow.
The base pattern is the three-candle fair value gap. If you need a refresher, our guide to FVG meaning in trading covers it step by step. In a bearish gap, candle one’s low sits above candle three’s high. In a bullish gap, candle three’s low sits above candle one’s high. The empty space between them is the gap.
A normal FVG is a place traders expect price to revisit. A breakaway gap is the opposite case. So the same shape carries two readings, and only later price action decides which one it was.
The classic breakaway gap is a different idea
The older term comes from stock charts. Edwards and Magee described gap types in their book on stock trends: common, breakaway, runaway and exhaustion gaps. Their breakaway gap is a true price gap. A stock closes at one price and opens the next day well away from it, with no trades in between.
In that classic sense, the gap also breaks out of a range or chart pattern, often on heavy volume. StockCharts gives a clear summary in its gap analysis page at StockCharts ChartSchool. The gap chart pattern entry on Wikipedia lists the same four types.
Spot forex trades around the clock on weekdays. So true session gaps are rare and mostly appear after the weekend, as our weekend gap forex guide explains. That is why ICT traders moved the idea onto the three-candle gap instead. Our types of gaps in forex page compares the classic types in more detail.
How it works: the rule we used
We needed a rule a computer can check, so we wrote one down. First, find every fair value gap. For a bullish gap, candle three’s low must sit above candle one’s high. For a bearish gap, candle three’s high must sit below candle one’s low. We also set a size floor: the gap must be wider than 0.1 ATR, so tiny slivers do not count.
Next, we watched each gap for a fixed window. A gap counts as filled when price trades through its far edge. For a bearish gap, that far edge is the top, which is candle one’s low. If price never reaches it within the window, we call the gap “never filled”. That is our working version of a breakaway gap.
Then we measured the move. We took the close 20 bars after candle three and compared it with candle three’s close. We counted that distance in the gap’s direction and in ATR units, so pairs and timeframes compare fairly. In short, the formula is: move = (close 20 bars later minus candle three close) divided by ATR, with the sign flipped for bearish gaps. The ATR help page in TradingView’s docs explains the volatility unit.
How we tested
We ran the rule on MetaTrader 4 history from the Capital Point Trading terminal, build 1471. The daily test covered 23 FX pairs from 12 June 2018 to 24 August 2026, which is 37,748 daily candles. The M15 and H1 tests used EURUSD, GBPUSD, USDJPY and XAUUSD from the same terminal. The M15 data ran from 2 June 2025 to 26 August 2026.
The fill windows differ by timeframe. On M15 we watched 96 bars, which is 24 hours. On H1 we watched 48 bars, so 48 hours. On D1 we watched 20 bars, about four trading weeks. The move was always measured 20 bars after the gap.
Every number here is a measurement before spread, swap and commission. The MT4 history has no usable spread, so we did not model costs.
The chart examples come from the TradingView web chart with OANDA data, captured on 7 October 2026. We drew the boxes from bar data we pulled that day. Our full method is on the editorial testing policy page.
Breakaway gap ICT rule settings
Change any of these settings and the share of “never filled” gaps changes too.
| Parameter | Our value | Why it matters |
|---|---|---|
| Gap shape | Three-candle FVG | Candle one and candle three do not overlap. |
| Minimum size | Above 0.1 ATR | Drops gaps too small to see on a chart. |
| Fill test | Trade through the far edge | A touch of the near edge is not a fill. |
| Window, M15 | 96 bars (24 hours) | Longer windows fill more gaps. |
| Window, H1 | 48 bars (48 hours) | Same logic on a slower chart. |
| Window, D1 | 20 bars | Roughly four trading weeks. |
| Move horizon | 20 bars after candle three | Measured in ATR, in the gap’s direction. |
| Early filter | Untouched for the first 3 bars | A test of what you can know early. |
Note the fill test. Some traders call a gap filled once price reaches its midpoint. That midpoint is the consequent encroachment level, covered in our guide on what CE means in ICT trading. Our rule is stricter, so it calls more gaps “never filled” than a midpoint rule would.
Reading a breakaway gap on a chart
Start with the displacement candle. A breakaway gap almost always sits inside one long candle that moves fast. Our page on displacement in trading covers how to spot it.
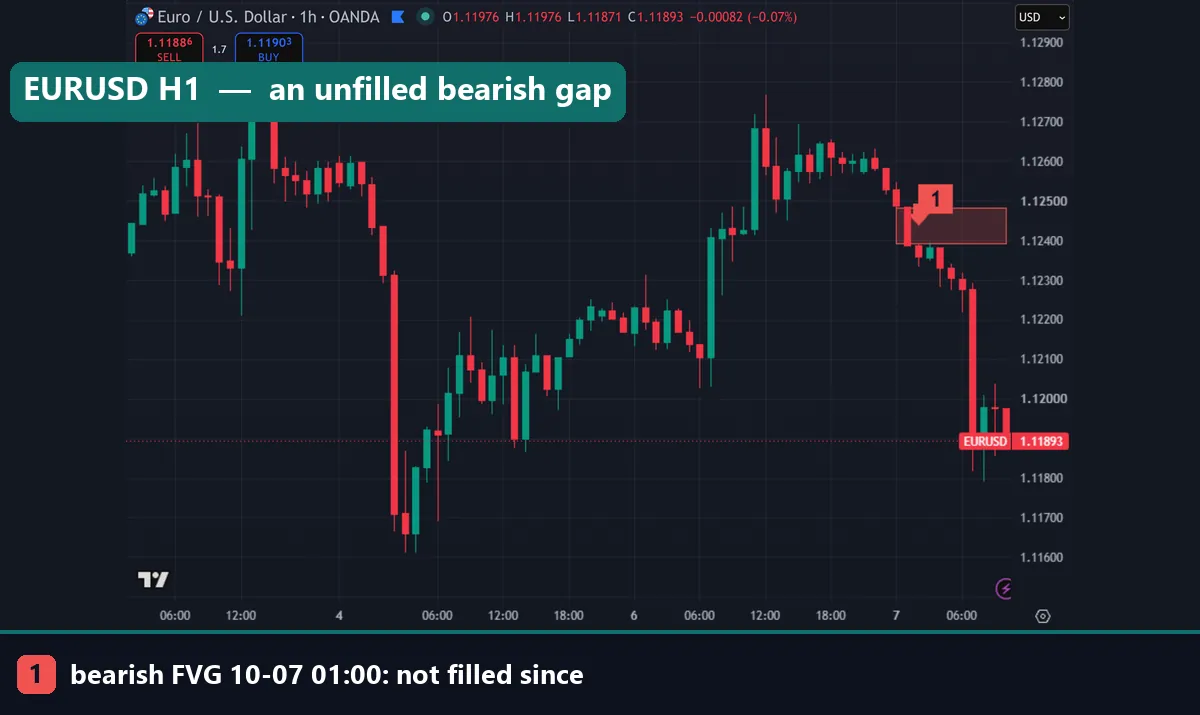
In the EURUSD H1 chart at the top, marker 1 is a bearish gap whose third candle closed at 01:00 UTC on 7 October 2026. The box runs from 1.12392 to 1.12482, a 9-pip gap worth 0.89 ATR. Price never traded back into it. Instead, it kept falling into the 1.119 area by the end of the capture.
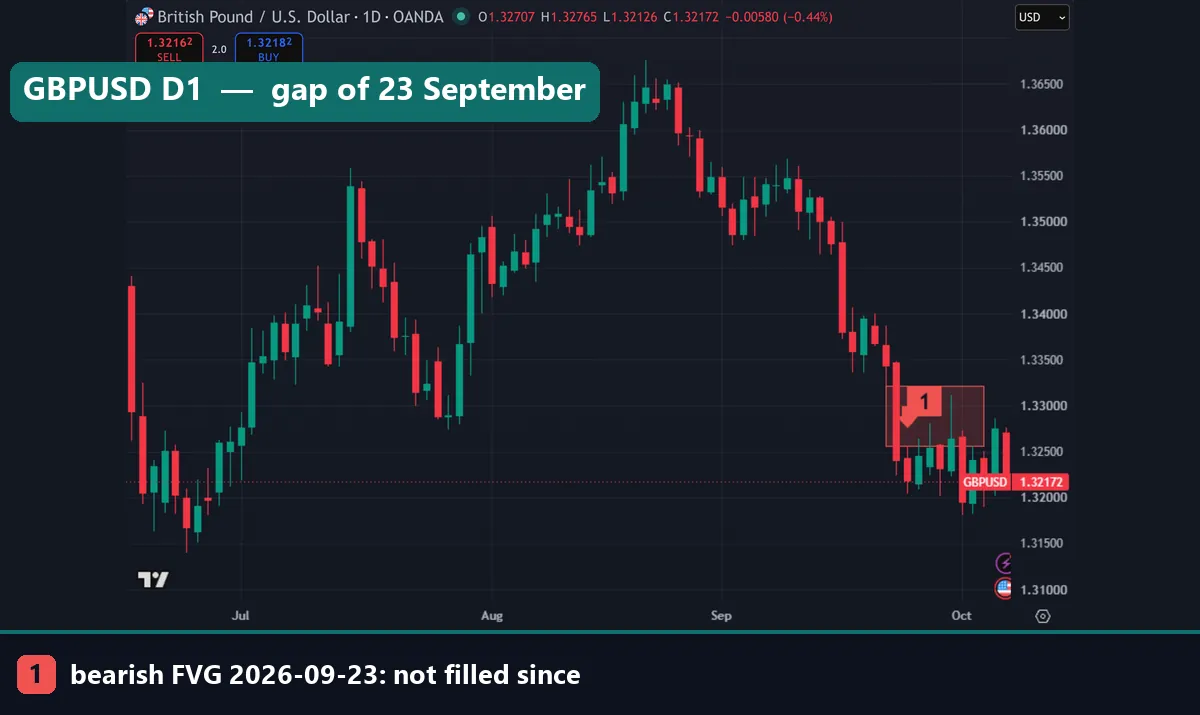
The GBPUSD daily chart shows a larger example. The bearish gap of 23 September 2026 runs from 1.32562 to 1.33216, which is 1.02 ATR. Nine bars later it was still open, and the last close on the chart was 1.32218.
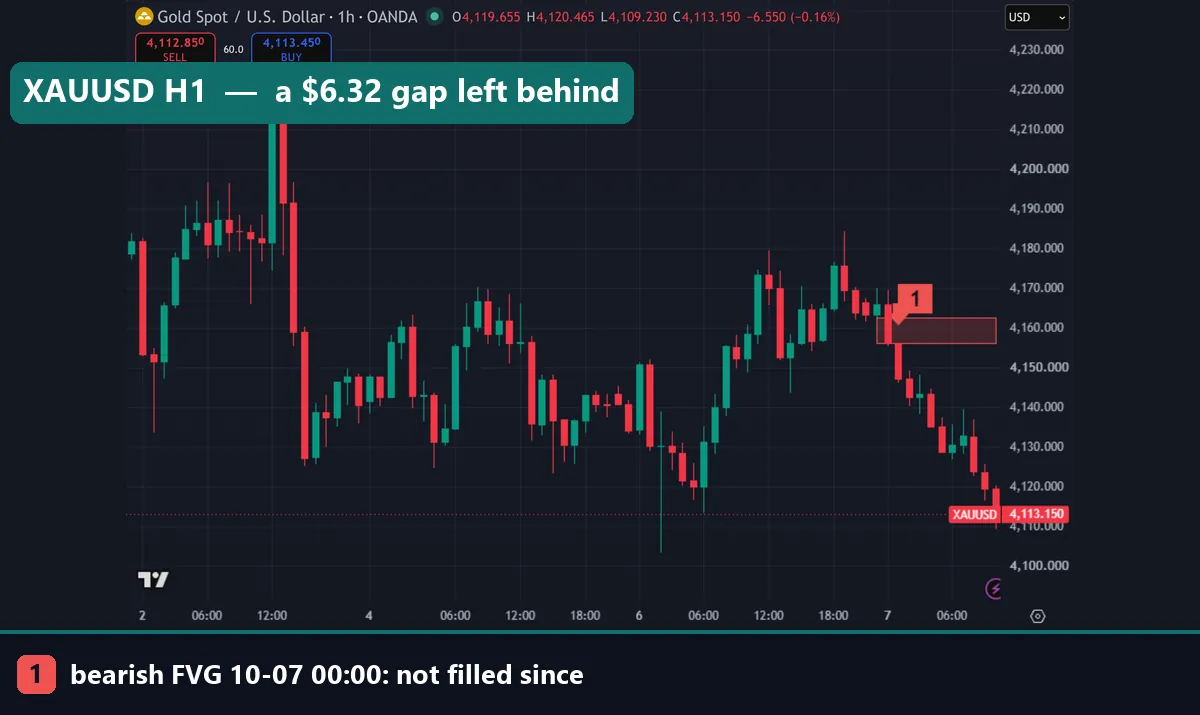
Gold shows the same shape on H1. The bearish gap that formed at 00:00 UTC on 7 October runs from $4,156.29 to $4,162.61, so it is $6.32 wide and 0.48 ATR. Price then slid toward $4,113 without a return. For more on the bearish form, see our bearish FVG guide.
Worked example: GBPJPY daily, September 2026
Here is one gap from start to finish, using numbers from our bar data. On GBPJPY D1, a bearish gap formed with its third candle on 2 September 2026. The gap runs from 214.328 to 216.334. That is about 2.0 yen wide, or 2.06 ATR, which makes it large for a daily chart.
The far edge is 216.334, which is candle one’s low. To count as filled, price had to trade back above it. After 24 daily bars, it had not. So by our rule this gap stayed open, and it fits the ICT idea of a breakaway gap.
The midpoint, or CE level, sits at 215.331. Price did not reach that either. Instead, the pair fell well below the box. The last close in our capture was 209.336 on 7 October. That is about 5.0 yen below the bottom edge of the gap.
Now the honest part. On 2 September, nobody could know this gap would stay open. It looked like any other large bearish FVG, and the label only became true weeks later.
What our data shows
First, unfilled gaps are a minority on every timeframe. On M15, 12.6% of 14,385 gaps stayed unfilled for 24 hours. On H1, 19.4% of 2,963 gaps stayed open for 48 hours. On D1, 27.3% of 5,361 gaps stayed open for 20 bars. So most gaps do get filled.
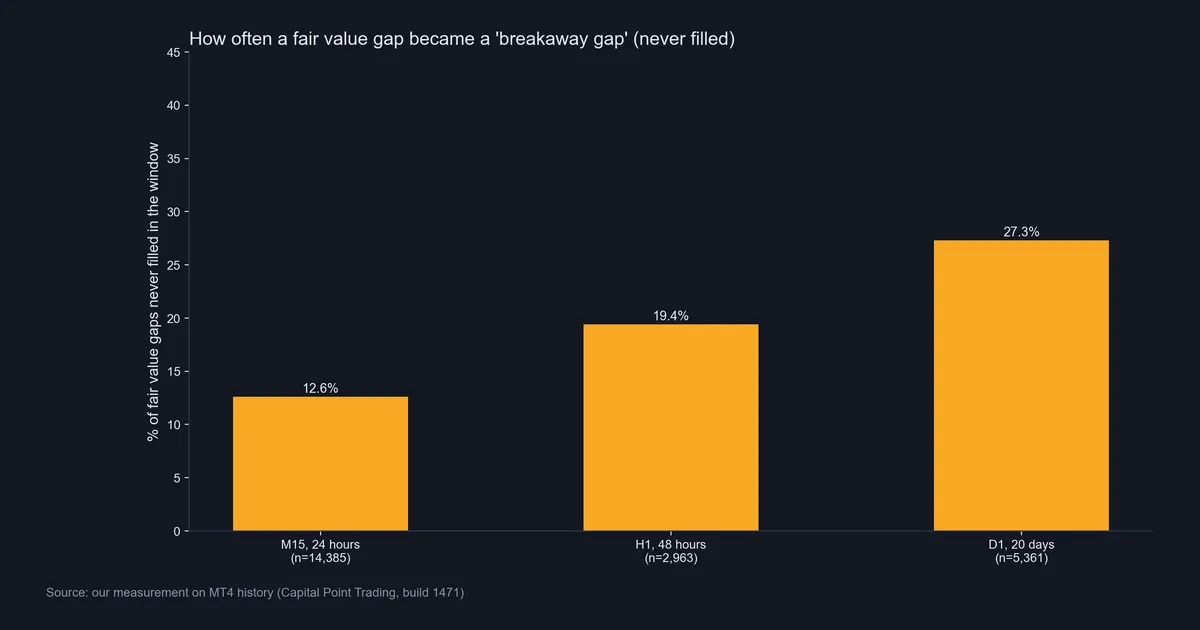
Second, the gaps that stayed open came with much bigger moves. On H1, the median move 20 bars later was +2.98 ATR on EURUSD and +3.06 ATR on gold for unfilled gaps. For filled gaps, it was −0.75 ATR and −0.61 ATR. On D1, the median of the 23 pair medians was +1.81 ATR for unfilled gaps and −0.96 ATR for filled ones.
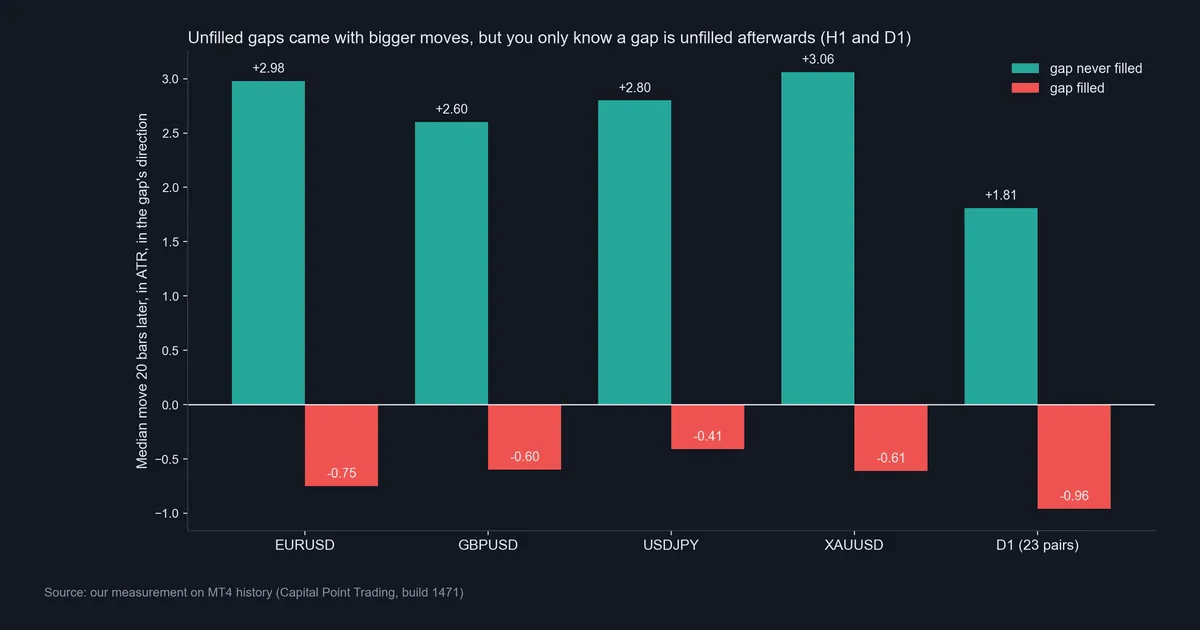
That contrast looks striking. However, it is partly built into the test. A gap that price never revisits is, almost by definition, one where price kept moving away. So the chart above sorts gaps by an outcome you only see later. It does not show an edge you can trade.
We did try one early filter. On EURUSD H1, 255 gaps stayed untouched for their first three bars. Of those, 36.5% were never filled, against 18.1% for all gaps. That roughly doubles the share. Still, about two in three of those gaps got filled anyway.
Download the complete indicator database
Put these concepts on your charts. One email unlocks the full library of 1,380+ indicators with compiled MT4 and MT5 files, plus my TradingView scripts. No paywall, no spam, unsubscribe any time.
Get free access to my indicator database
One email unlocks 1,380+ free MT4, MT5 and TradingView indicators — the complete library. No single-tool download; you get the whole database.
Where it fails
The biggest failure is timing. A breakaway gap is defined by what does not happen later. At the moment the gap forms, you cannot tell it apart from the many gaps that will fill. Our data says most of them fill.
Second, the label depends on the window. A gap that is open after 24 hours may fill on day three. On D1 we used 20 bars. A longer window would turn some of our “breakaway” gaps into filled ones.
Third, small samples hide in the totals. The early filter on EURUSD H1 used 255 gaps. GBPUSD had 238 and USDJPY 223. That is enough to see a pattern, but not enough to trust it across market regimes. Also, we did not test any of this out of sample.
Fourth, costs are missing. On M15, a small gap can be close in size to the spread itself.
Finally, the move figures are medians. Half of the unfilled gaps moved less than the median figure. So the bars in our chart hide a wide spread of outcomes.
A gap that filled: USDJPY H1 for contrast
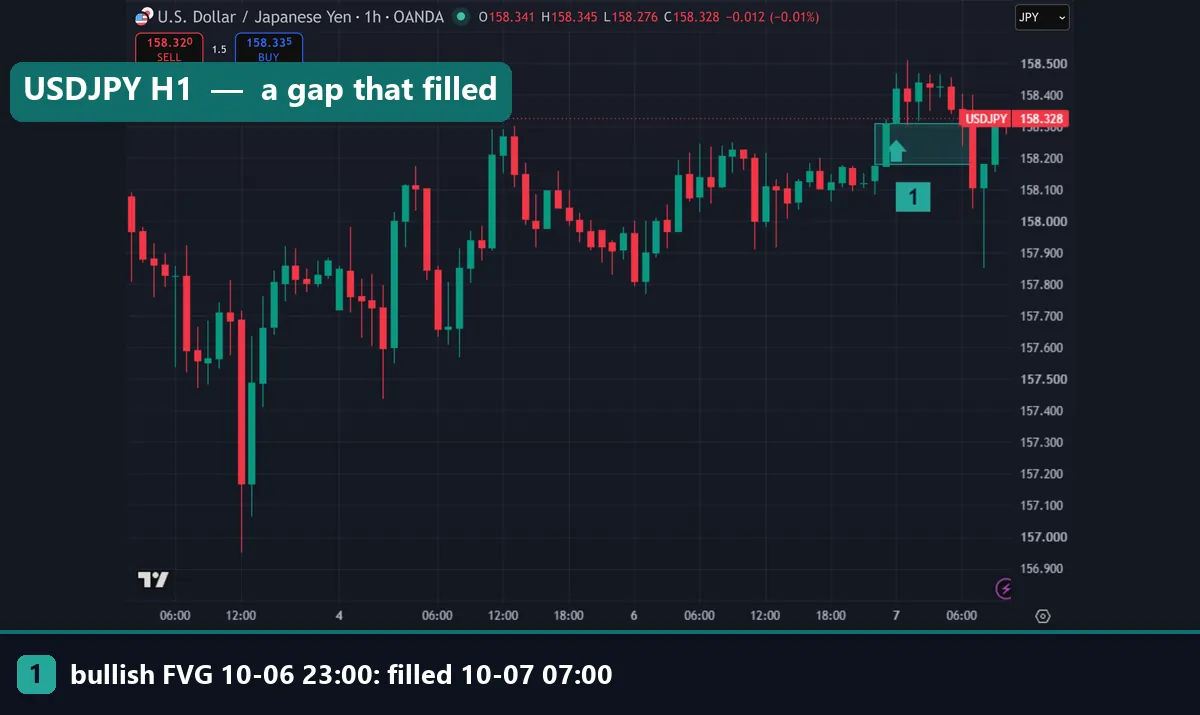
This USDJPY chart shows the more common outcome. A bullish gap formed at 23:00 UTC on 6 October 2026, from 158.182 to 158.312. At 1.03 ATR, it was a solid gap by our rule.
Then, at 07:00 UTC on 7 October, price fell back through the whole box. That took 8 hourly bars. So this gap was filled, and nobody would call it a breakaway gap now. Our bullish FVG guide shows more of these.
Once a gap fills, some traders flip its meaning. A filled bullish gap that price closes through can act as resistance. That idea is the inverse FVG, compared in our IFVG vs FVG guide.
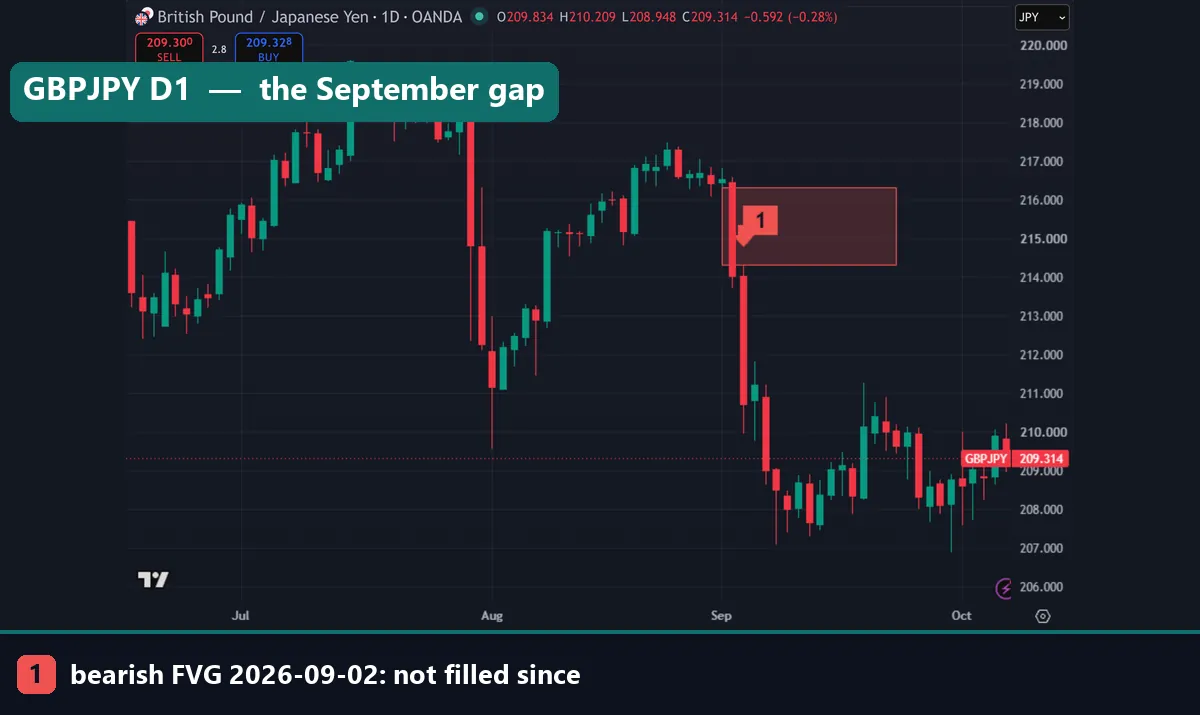
The last image is our second daily example, the GBPJPY gap from the worked example. Note how wide the box is next to the candles that formed it. Still, size alone did not tell anyone in advance whether this gap would hold.
Common mistakes
- Calling a gap “breakaway” as it forms. The label needs time. Until the window closes, it is just a fair value gap.
- Mixing up the two definitions. The Edwards and Magee gap is a true opening gap on a stock chart. The ICT version is a three-candle gap that stays open. They are not the same pattern.
- Reading hindsight charts as proof. Our move chart sorts gaps by an outcome you cannot see in real time. So the big medians do not mean a gap entry works.
- Ignoring the fill rule. A midpoint touch, a near-edge touch and a full trade-through give different answers. Pick one rule and keep it.
Where to go next
If you are new to the method, start with what ICT trading is and our list of ICT terms. Then read about the liquidity void, which is a larger cousin of the fair value gap.
A breakaway gap often sits next to a change in structure. Our page on the market structure shift shows how the two link up. For the volatility unit we used, see what ATR is in trading.
If you want to build your own gap test in MetaTrader, the iATR function reference in the MQL4 docs shows how to read ATR in code.
FAQ
What is a breakaway gap in ICT?
It is a fair value gap that price leaves with force and never comes back to fill. In our test, “never filled” meant price did not trade through the gap’s far edge within a fixed window.
Is an ICT breakaway gap the same as a classic breakaway gap?
No. The classic one, from Edwards and Magee, is a true price gap between two sessions on a stock chart. The ICT version is a three-candle gap inside continuous trading.
How often do fair value gaps stay unfilled?
In our MT4 data, 12.6% on M15 over 24 hours, 19.4% on H1 over 48 hours and 27.3% on D1 over 20 bars. So most gaps were filled.
Can you tell a breakaway gap when it forms?
Not reliably. The label depends on what happens later. Even gaps left untouched for three bars on EURUSD H1 were filled about two times in three.
Do unfilled gaps lead to bigger moves?
Yes, in hindsight. On H1, unfilled gaps showed median moves near +2.6 to +3.1 ATR after 20 bars. But that is partly built in, because an unfilled gap is one where price kept moving away.
What timeframe works best for breakaway gaps?
Daily gaps stayed open most often in our test, at 27.3%. That does not make daily gaps tradeable, and it partly reflects the 20-bar window we chose.
Does the fill rule change the results?
Yes. We counted a fill only when price traded through the far edge. A rule based on the CE midpoint would call more gaps filled and fewer gaps breakaway.
Should I trade every gap that stays open?
Our data does not support a trading rule from this pattern, and all figures are before spread, swap and commission. Treat it as context, not a signal; results are not guaranteed; past performance is not indicative of future results.
Last updated: 7 October 2026.

About the author
Written by Dominic Walsh, a Forex trader and MT4/MT5 indicator, Expert Advisor and script developer. Every tool on forexmt4systems.com is tested on live charts before release and ships with ready-to-use compiled MT4 (.ex4) and MT5 (.ex5) files. Learn more about the trader and developer behind this site.
How we build, test and correct every tool: Editorial & Testing Policy. Trading carries risk; see the disclaimer.