
The FVG meaning in trading is simple: a fair value gap is a three-candle imbalance, a slice of price that one fast candle skipped. This guide settles three things. First, what the gap is and how to draw it. Next, what our own count of 23,050 gaps says about the popular claim that “price always returns to fill the gap”. Finally, why a high fill rate still does not give you a trade.
FVG meaning in trading: a three-candle imbalance
FVG stands for fair value gap. Some traders also call it an imbalance or an inefficiency. It lives inside three consecutive candles. The middle candle moves so hard that the wicks of the candles on either side never touch.
In a bullish gap, the low of candle three sits above the high of candle one. So the price range between them traded only once, on the way up, inside one candle. A bearish gap is the mirror: the high of candle three sits below the low of candle one.
The idea comes from the ICT and smart money concepts schools. They read it as “unfinished business” left by one-sided orders. That story is hard to prove. Still, the shape itself is objective.
It is not a classic price gap. An opening gap is a jump between one close and the next open. An FVG forms inside continuous candles. Our page on the types of gaps in forex covers the opening kind.
How a fair value gap forms, and the exact rule
A gap needs displacement: one large candle that travels much further than its neighbours. Our guide to displacement in trading shows that candle. Without it, the outer wicks overlap and no gap forms.
Here is the rule in plain terms. Number the candles 1, 2 and 3 from left to right.
- Bullish FVG:
Low[3] > High[1]. The zone runs fromHigh[1](bottom edge) toLow[3](top edge). - Bearish FVG:
High[3] < Low[1]. The zone runs fromHigh[3](bottom edge) toLow[1](top edge). - Midpoint:
(top + bottom) / 2. Many traders call this the consequent encroachment level. - Size:
top - bottom, converted to pips.
Price fills a bullish gap when it trades back down to the bottom edge. It fills a bearish gap when it trades back up to the top edge. A partial fill only reaches the midpoint. If price then closes beyond the zone, many traders flip it. That is the inversion FVG, a separate topic.
How to draw a fair value gap on your chart
The steps are the same in TradingView and MetaTrader 4.
- Find a large candle and check the candles on either side.
- For a move up, the low of candle three must sit above the high of candle one. For a move down, check the opposite.
- Pick the rectangle tool. Anchor one corner at the high of candle one and the other at the low of candle three.
- Extend the box to the right until price trades back to its far edge. That point is the fill.
- Optionally add a horizontal line at the midpoint.
That is exactly how we drew every box in this article. In TradingView, Pine Script can draw the same box with code, and TradingView’s Pine Script docs on lines and boxes explain the box.new() call. If you would rather not draw by hand, our non-repaint FVG indicator marks gaps on MT4 and MT5. It installs like any custom indicator; see how to install MT4 and MT5 indicators.
Wait for candle three to close before you draw. Until then, the gap can still vanish.
How we tested the “gaps get filled” claim
We counted gaps in raw price history and checked what happened next. The data came from MetaTrader 4, build 1471, on a Capital Point Trading terminal.
- M15 and H1: EURUSD, GBPUSD, USDJPY and XAUUSD, 1 July 2025 to 26 August 2026. That gave 85,399 M15 bars and 21,357 H1 bars.
- D1: 23 FX pairs, 12 June 2018 to 24 August 2026, a total of 37,748 daily candles.
- Gap rule: the three-candle rule above. We ignored gaps smaller than 0.1 of ATR(14), so single-point slivers do not count.
- Fill rule: price trades back to the far edge within a look-ahead window. That window was 96 bars on M15 (one day), 48 bars on H1 (two days) and 20 bars on D1 (about four weeks).
The chart examples come from the TradingView web chart with OANDA prices, captured on 1 October 2026, using the same three-candle rule. All times are UTC. Our wider method is in the editorial testing policy.
We did not trade these gaps, so the numbers say nothing about profit, spread or slippage.
Parameters that change what counts as a gap
Two traders can look at the same chart and count a different number of gaps. These are the settings behind that difference, with the values we used.
| Parameter | Our setting | What changes if you move it |
|---|---|---|
| Price points compared | Wicks: high of candle 1 vs low of candle 3 | Using bodies instead finds more gaps, and they are wider |
| Minimum size | 0.1 x ATR(14) | A higher floor removes small gaps; a zero floor counts tiny slivers |
| Fill definition | Price reaches the far edge | A midpoint or first-touch rule reports higher fill rates |
| Look-ahead window | 96 bars M15, 48 bars H1, 20 bars D1 | A longer window lets more gaps fill; a shorter one lowers the rate |
| Timeframe | M15, H1, D1 | Higher timeframes form wider gaps that fill less often in our data |
| Confirmation | Candle 3 closed | Drawing before the close repaints when the candle changes |
Write your settings down before you test. Otherwise you can tune the rule until the result looks good.
Reading bullish and bearish gaps on a chart
A bullish gap sits below price after a rise, and traders read it as possible support. A bearish gap sits above price after a drop, read as possible resistance. Our separate pages on the bullish FVG and the bearish FVG go deeper into each side.
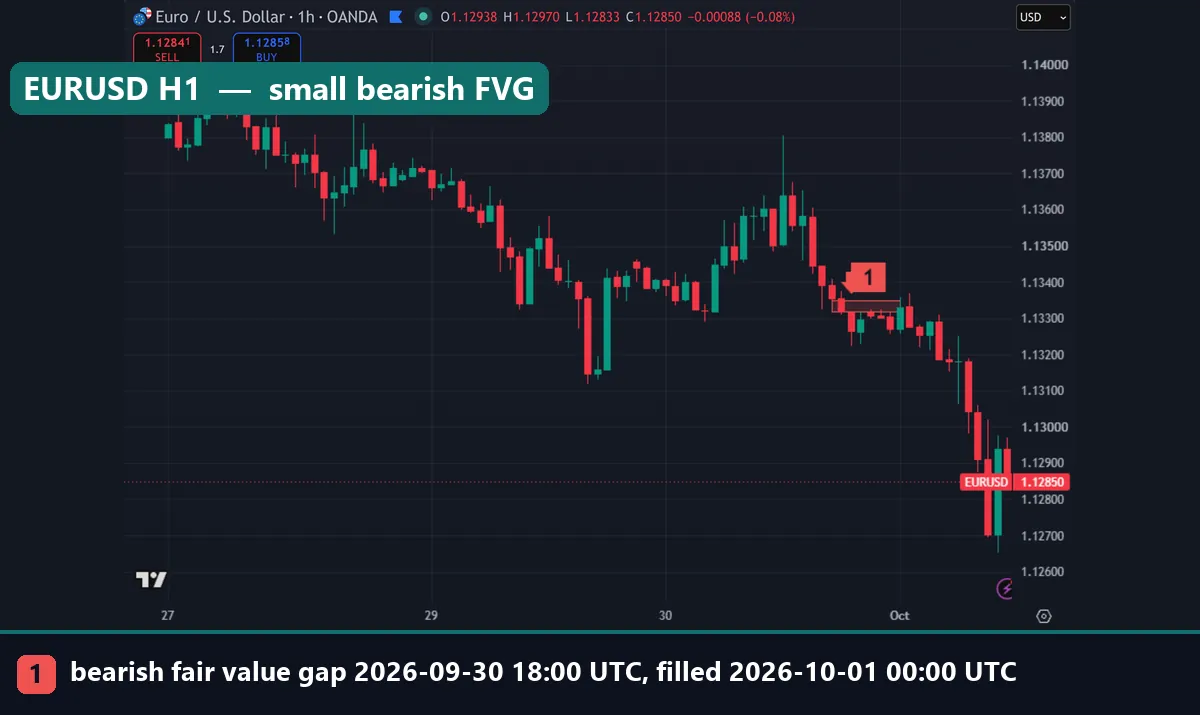
The EURUSD H1 chart above shows a bearish gap. The three candles opened at 17:00, 18:00 and 19:00 UTC on 30 September 2026. The zone ran from 1.13319 to 1.13350, just 3.1 pips. That is smaller than the 7.8-pip median of our H1 sample. Price came back up and filled it at 00:00 UTC on 1 October, five hours after candle three opened. Then it kept falling.
Lower timeframes can also stack gaps on top of each other.
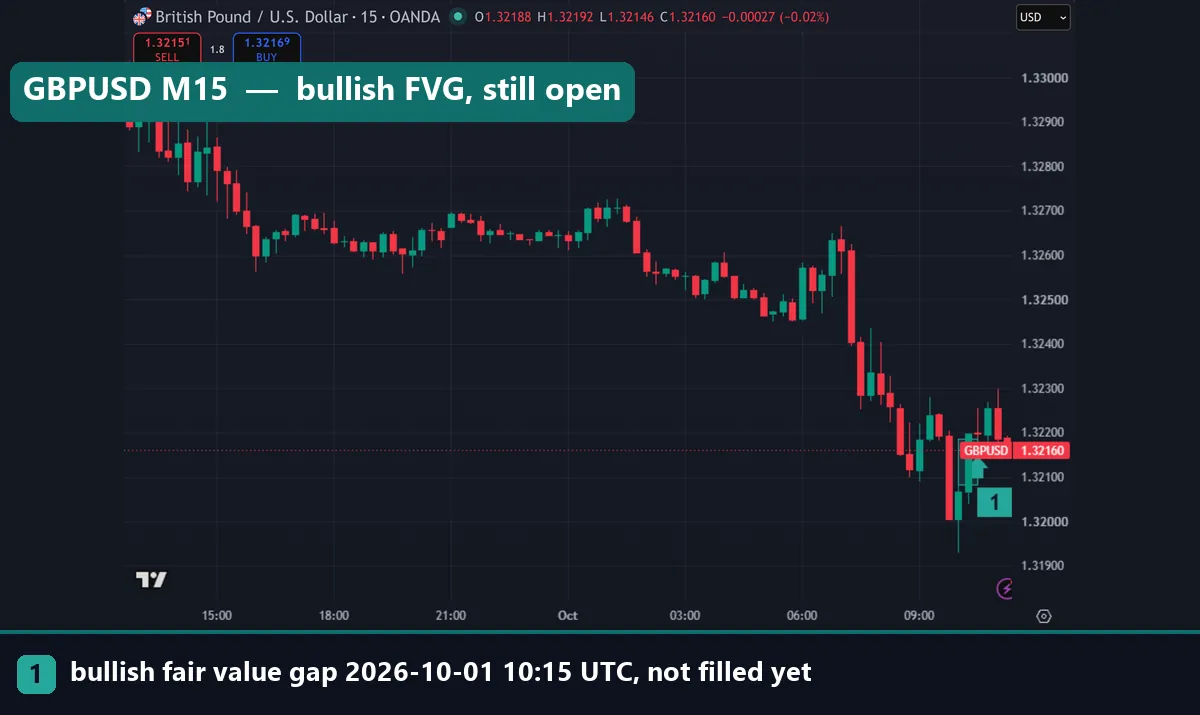
On GBPUSD M15, a bearish gap formed from 09:30 to 10:00 UTC on 1 October, between 1.32084 and 1.32182. Price filled it at 10:15. Then a bullish gap opened at almost the same prices, 1.32084 to 1.32186, from 10:00 to 10:30. At 10.2 pips, it was nearly three times our M15 median of 3.6 pips. It had not filled when we took the screenshot. In short, the same price band switched sides inside 45 minutes.
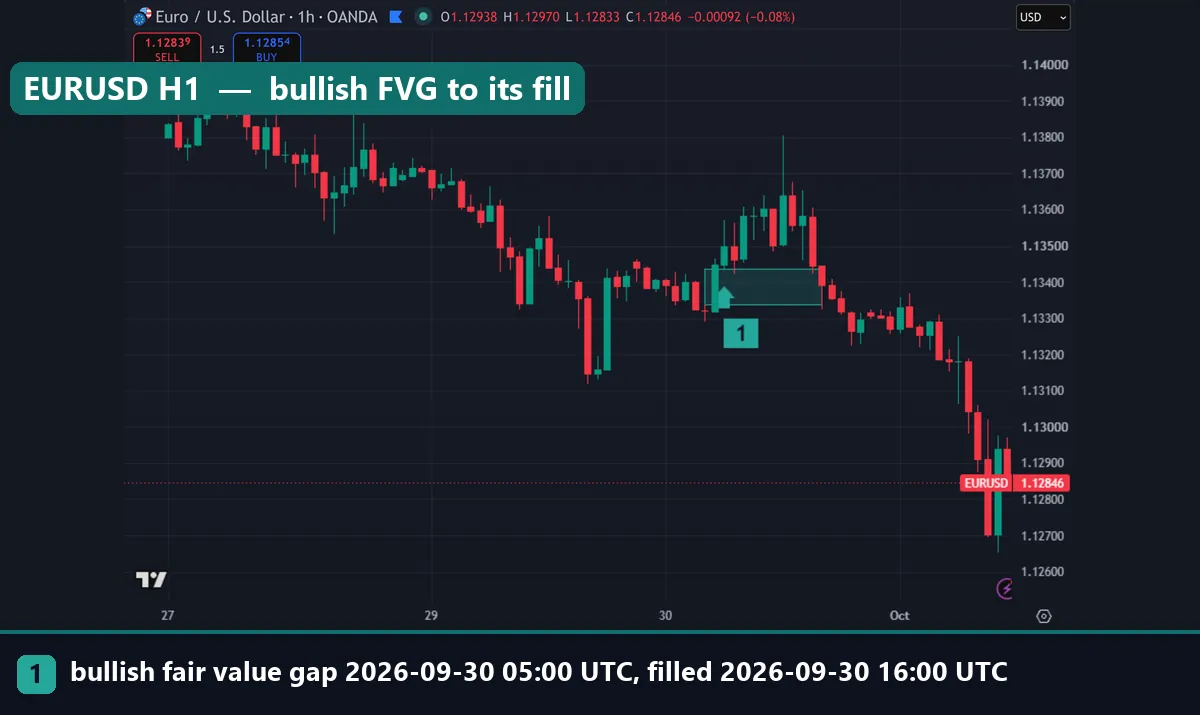
Worked example: EURUSD H1 on 30 September 2026
The first image shows a full life cycle. Here are the numbers.
- Candle 1 opened at 04:00 UTC. Its high was 1.13339.
- Candle 2 opened at 05:00 UTC and carried price up.
- Candle 3 opened at 06:00 UTC. Its low was 1.13436, above the high of candle 1.
- Gap: 1.13339 to 1.13436, so 9.7 pips wide. That is a bit larger than our H1 median of 7.8 pips.
- Midpoint: (1.13436 + 1.13339) / 2 = 1.133875.
- Fill: price traded back to 1.13339 at 16:00 UTC, ten hours after candle three opened.
Now look at what happened in between. First, price rallied away from the gap, with a wick near 1.1380 on the chart. Then it turned and dropped straight through the zone. After the fill, it did not bounce. By the time of our capture on 1 October, EURUSD traded at 1.12846, about 49 pips below the bottom edge of the gap.
So “it will fill” was true here. Yet a buyer in the gap would have needed a stop. Our guide on how to use a stop loss explains why that stop decides the outcome, not the fill.
Larger gaps: gold on H1 and the euro on the daily chart
Gap size scales with the market and the timeframe.
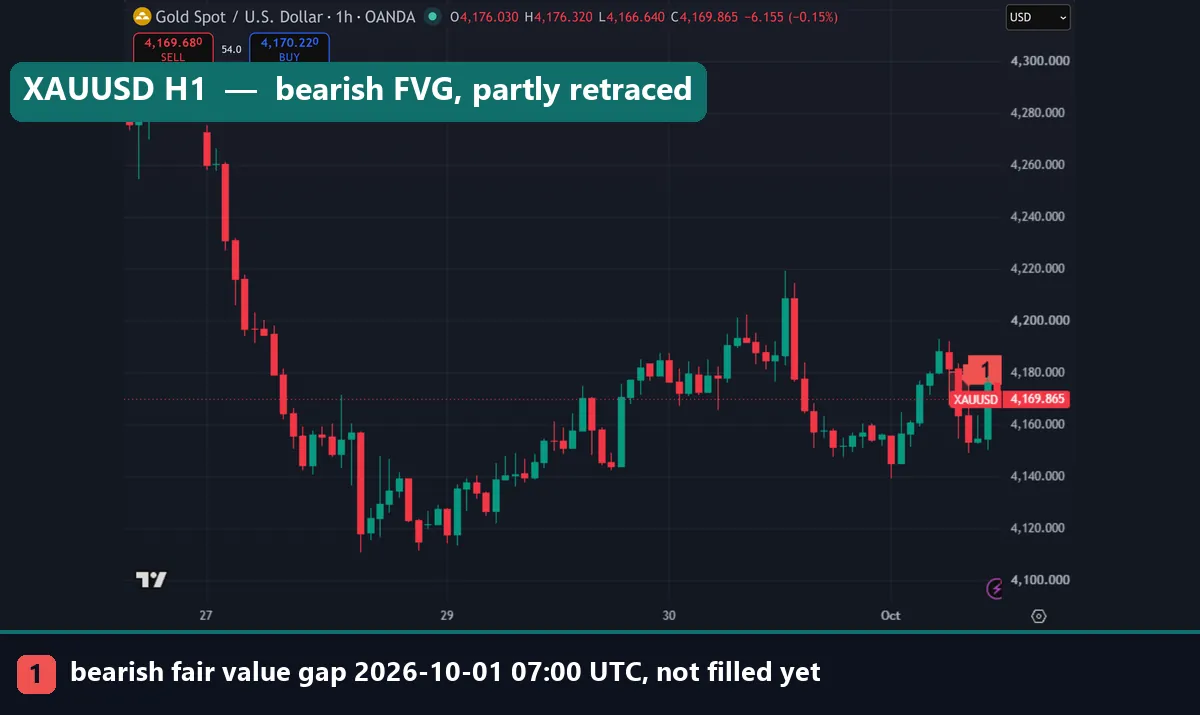
On XAUUSD H1, a bearish gap formed from 06:00 to 08:00 UTC on 1 October 2026. It ran from 4,167.87 to 4,180.635, a band of about $12.77. When we took the capture, price had already pushed back into it and traded at 4,169.865. Even so, it had not reached the top edge, so by our rule the gap remained open. This shows why the fill definition matters: a touch rule would call it done.
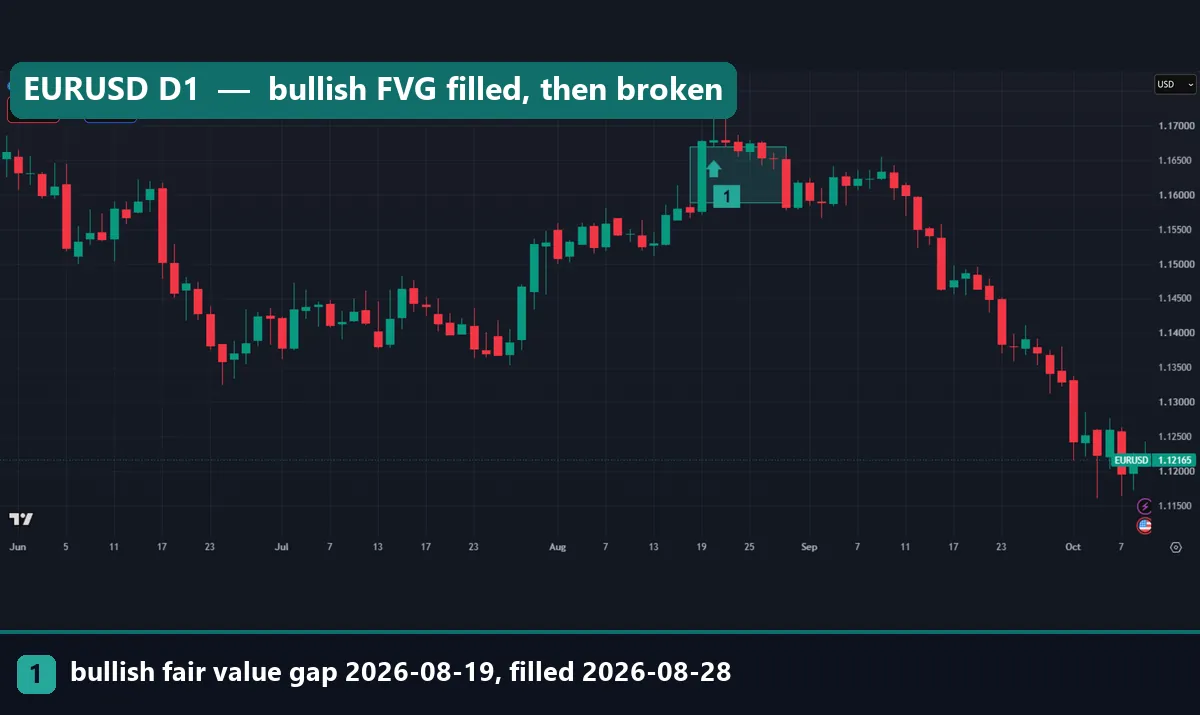
On EURUSD D1, a bullish gap formed around 19 August 2026, from 1.15884 to 1.16694. At 81 pips, it was close to three times our D1 median of 29.5 pips. Price filled it on 28 August, nine calendar days later. Then the euro kept sliding. On 1 October the daily close stood at 1.12837, roughly 305 pips under the bottom edge. It worked as a fill target but failed as support.
Download the complete indicator database
Put these concepts on your charts. One email unlocks the full library of 1,380+ indicators with compiled MT4 and MT5 files, plus my TradingView scripts. No paywall, no spam, unsubscribe any time.
Get free access to my indicator database
One email unlocks 1,380+ free MT4, MT5 and TradingView indicators — the complete library. No single-tool download; you get the whole database.
What our fill rates say, and what they do not
Here are the measured numbers with their sample sizes.
- M15: 14,385 gaps on 4 symbols. Median size 3.6 pips. Price reached the midpoint in 90.4% of cases and filled the whole gap in 87.5%, within 96 bars.
- H1: 3,304 gaps on the same 4 symbols. Median size 7.8 pips. Midpoint 84.8%, full fill 80.4%, within 48 bars.
- D1: 5,361 gaps on 23 FX pairs. Median size 29.5 pips. Midpoint 78.7%, full fill 72.7%, within 20 bars.
So most gaps get revisited. But gaps are also common. We found 168.4 per 1,000 bars on M15, 154.7 on H1 and 142.0 on D1. That is roughly one new gap every six to seven bars.
Also, the gaps are small next to normal daily movement. We did not measure how often price returns to a random level of the same distance. Therefore we cannot say how much of the 87.5% is special to gaps and how much is just normal wandering. Treat the fill rate as a base rate, not as an edge.
Where it fails
A fill rate is not a trade. It has no entry, no stop and no time limit.
- The fill can come after a large adverse move. In our EURUSD H1 example, price first ran more than 30 pips the other way.
- A fill is not a reversal. On EURUSD D1, price filled the gap and then fell about 305 pips.
- The 12.5% to 27.3% that do not fill are the expensive ones. A trader waiting on them holds a loser the longest.
- Timing is loose. A gap that fills on day 19 is no help to a scalper.
- Costs are missing. Our counts use raw history with no spread, and a 3.6-pip M15 gap leaves little room for one.
Also, change the size floor, fill rule or window, and every percentage moves.
Unfilled gaps and our fill-rate chart
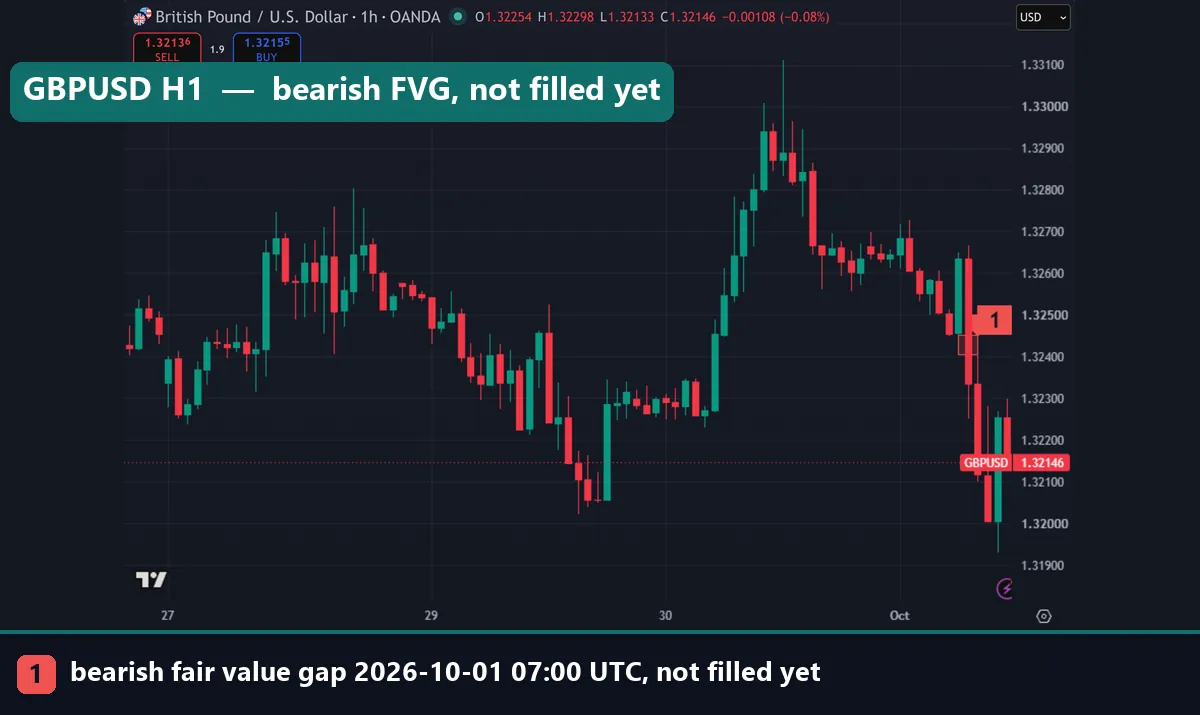
This GBPUSD H1 chart shows a bearish gap from 06:00 to 08:00 UTC on 1 October 2026, between 1.32405 and 1.32452. At 4.7 pips it is small. Price then fell away and traded at 1.32146 at our capture, about 26 pips below the gap. It was still open. Most H1 gaps fill within 48 bars, but nobody can say whether this one will.
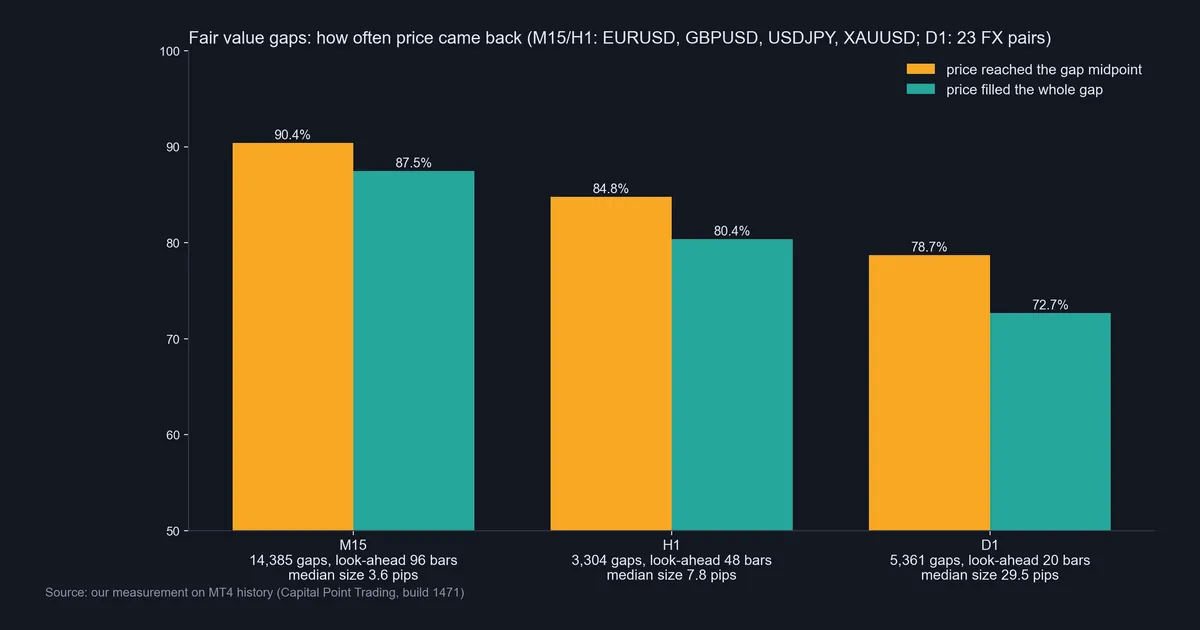
Our chart sums up the test. The fill rate drops as the timeframe rises, from 87.5% on M15 to 80.4% on H1 and 72.7% on D1. Midpoint rates follow the same order. Note that the D1 sample covers 23 pairs while the intraday samples cover four symbols, so the groups are not identical.
Common mistakes with fair value gaps
- Trading every gap. With a new gap every six to seven bars, most of them are noise. Context such as a market structure shift or a premium or discount zone narrows the list.
- Treating a fill as a bounce. The fill only says price came back. As the daily euro chart showed, it can pass straight through and keep going.
- Drawing before candle three closes. The gap can vanish before the close. Wait, then draw.
- Sizing the stop to the gap, not to the market. A 3-pip gap does not mean a 3-pip stop is safe. Set risk first; our page on risk per trade shows how.
Also, an FVG is not an order block. See our fair value gap vs order block comparison.
Where to go next
- When a gap fails and flips, read IFVG vs FVG.
- For a wider zone made of several gaps, see the liquidity void.
- For overlapping bullish and bearish gaps, like the GBPUSD M15 case, see the balanced price range.
- For where gaps sit relative to stops, read liquidity in trading.
For outside reading, StockCharts ChartSchool’s gap analysis covers classic opening gaps. The market microstructure article on Wikipedia explains how orders actually move price. The BIS Triennial Survey of FX turnover shows how deep the currency market is.
FAQ
What does FVG mean in trading?
FVG means fair value gap: a three-candle pattern where the wicks of candles one and three do not overlap.
What is the FVG pattern in simple words?
It is a hole in the traded range left by one fast candle, between the wicks of candles one and three.
Do fair value gaps always get filled?
No. In our data, 87.5% of M15 gaps filled within 96 bars, 80.4% of H1 gaps within 48 bars and 72.7% of D1 gaps within 20 bars. The rest stayed open inside those windows.
Which timeframe is best for FVGs?
None by default. M15 gaps filled more often in our test but had a 3.6-pip median size. Daily gaps were wider, at 29.5 pips, and filled less often.
Is the midpoint of an FVG important?
Many traders watch it as a halfway level. In our data, price reached the midpoint more often than the far edge: 90.4% vs 87.5% on M15 and 78.7% vs 72.7% on D1.
Can I trade an FVG on its own?
We would not. A gap gives you a zone but no entry, stop or time limit.
Is an FVG the same as a price gap?
No. A price gap is a jump between one close and the next open. An FVG forms inside continuous candles.
Does a filled gap mean price will reverse?
No. On EURUSD D1 in August 2026, price filled a bullish gap and then fell about 305 pips by 1 October. A fill tells you price came back, nothing more; results are not guaranteed; past performance is not indicative of future results.
Last updated: 1 October 2026.

About the author
Written by Dominic Walsh, a Forex trader and MT4/MT5 indicator, Expert Advisor and script developer. Every tool on forexmt4systems.com is tested on live charts before release and ships with ready-to-use compiled MT4 (.ex4) and MT5 (.ex5) files. Learn more about the trader and developer behind this site.
How we build, test and correct every tool: Editorial & Testing Policy. Trading carries risk; see the disclaimer.