
What is CE in trading ICT? CE stands for consequent encroachment, and it is simply the 50% midpoint of a fair value gap or of a long wick. This guide shows how to find the level, how to read it, and what happened at the CE across 22,709 gaps we measured on MetaTrader 4 history. In short, price reached the midpoint most of the time, but once it got there, it nearly always kept going through the whole gap.
What is CE in trading ICT? Consequent encroachment defined
The term comes from the Inner Circle Trader (ICT) teaching, which you can follow on the Inner Circle Trader channel on YouTube. The CE is the halfway line of an imbalance. So it is a level, not a signal.
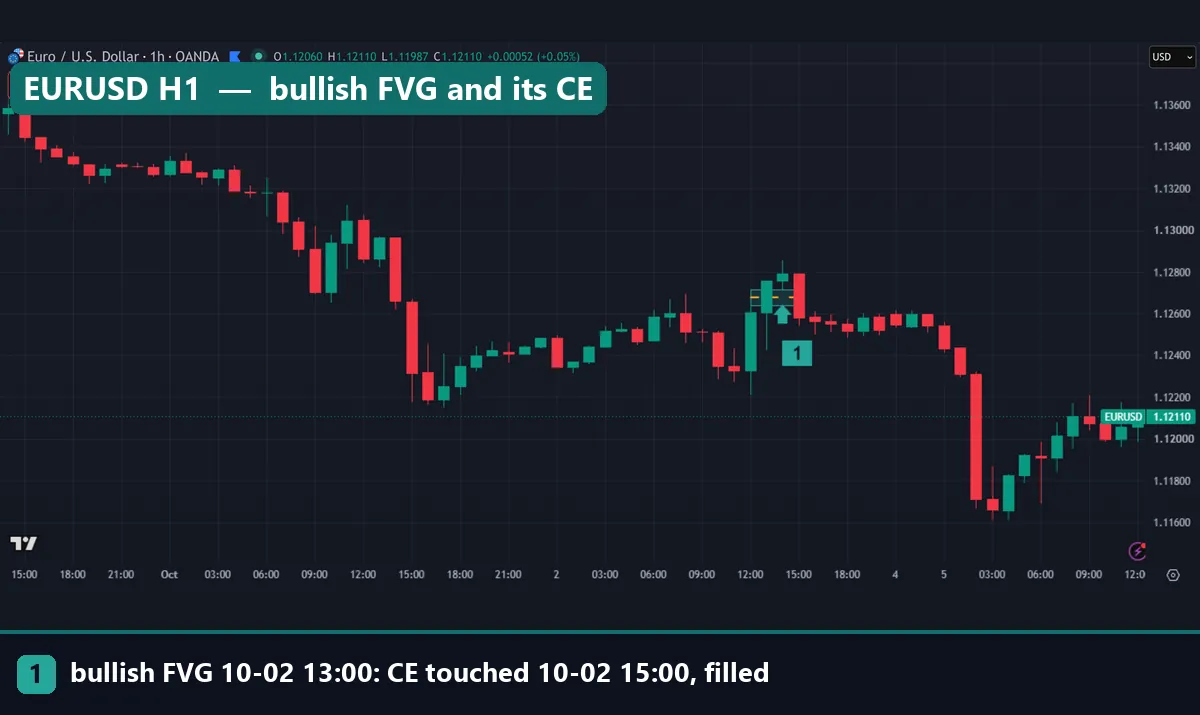
Most of the time, traders apply it to a fair value gap. That is the three-candle pattern where the wicks of candle one and candle three do not overlap. The space between them is the gap, and the CE sits in its middle. The first chart shows a small bullish gap on EURUSD H1 from 2 October 2026, between 1.12638 and 1.12716, with the CE at 1.12677.
A gap is one-sided trading. If price fills half of it, the move has “encroached” on the imbalance. ICT followers watch whether the candle bodies respect that halfway line or close through it. For the wider vocabulary, our list of ICT terms covers the related labels in one place.
How the CE level is calculated
The math is one line. First, find the two edges of the gap. Then average them.
For a bullish FVG, the bottom edge is the high of candle one, and the top edge is the low of candle three. So the formula is CE = (High of candle 1 + Low of candle 3) / 2.
For a bearish FVG, it flips. The top edge is the low of candle one, and the bottom edge is the high of candle three. The formula becomes CE = (Low of candle 1 + High of candle 3) / 2.
For a wick, take the extreme of the wick and the nearest edge of the body. On an upper wick, that means CE = (High + the higher of Open and Close) / 2. A lower wick mirrors it with the low and the lower of the two body prices.
There is no length setting and no lag. Once candle three closes, the midpoint is fixed. The real judgement call is which gaps you count.
How we tested consequent encroachment
We measured the CE on two data sources. First, we used MetaTrader 4, build 1471, on a Capital Point Trading terminal.
- M15: EURUSD, GBPUSD, USDJPY and XAUUSD, June 2025 to August 2026, 14,385 gaps.
- H1: the same four symbols, 2,963 gaps.
- D1: 23 currency pairs, 12 June 2018 to 24 August 2026, 5,361 gaps from 37,748 daily candles.
Next, we took the chart examples on a TradingView web chart with OANDA data on 5 October 2026. The intraday shots cover 1 to 5 October; the daily shot covers July to October. In every image, the box is the gap and the yellow dashed line is the CE.
We did not test a trading rule here. We only measured touches and fills, before spread, swap and commission. Our general approach is set out in our editorial testing policy.
The parameters behind our numbers
Every gap study depends on a few choices. Here are ours.
| Parameter | Our value | Why it matters |
|---|---|---|
| Gap rule (bullish) | Candle 3 low above candle 1 high | The standard three-candle FVG shape |
| Minimum gap size | More than 0.1 ATR | Drops tiny gaps that are just noise |
| CE level | 50% of the gap | The midpoint, with no rounding to round numbers |
| “Entered the gap” | Price traded past the near edge | The loosest kind of revisit |
| “Reached the CE” | Price traded to the midpoint | The touch most ICT traders watch |
| “Fully filled” | Price traded to the far edge | The gap is gone |
| Window, M15 | 96 bars (24 hours) after candle 3 | Shorter windows give lower rates |
| Window, H1 | 48 bars (48 hours) | Same idea, one timeframe up |
| Window, D1 | 20 bars (about a month) | Daily gaps get more time |
Bearish gaps use the mirror rule. Also note that a touch means price traded at the level, even briefly. We did not ask for a candle body to close there.
Reading the CE on a chart
Start with the box, then draw the midpoint inside it.
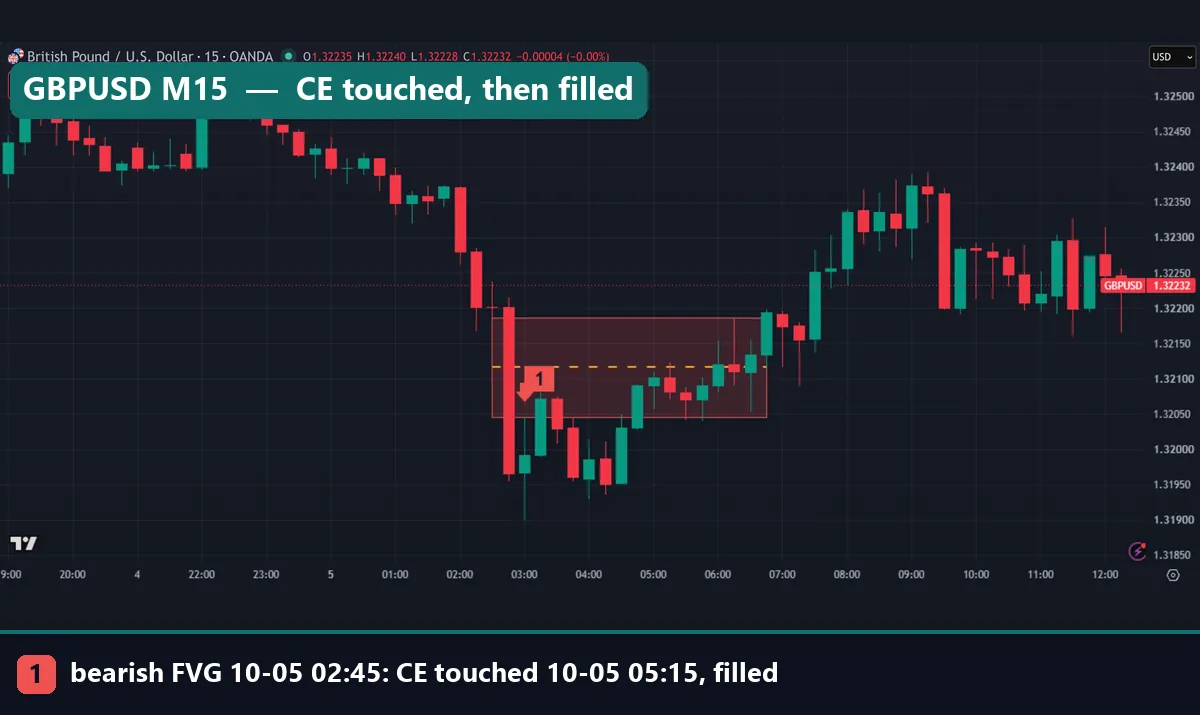
The GBPUSD 15-minute chart shows a bearish gap from the early hours of 5 October 2026. Price dropped hard, then climbed back. It traded into the box, met the dashed CE line, and kept going until the gap was full. So the line marked where half the imbalance was gone, but it did not stop the move.
Still, the chart teaches one useful habit. Look at the candle bodies, not only the wicks. Several bodies in that example closed below the CE before price finally broke higher.
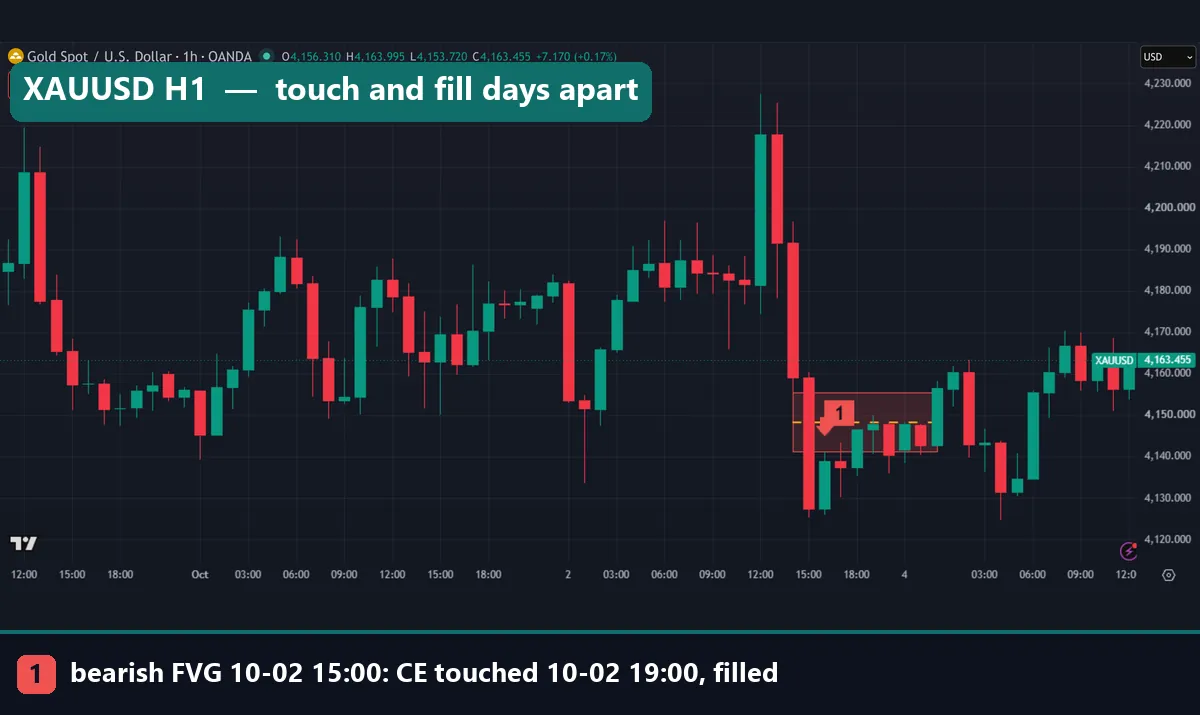
The gold chart shows the same thing one timeframe up. The bearish gap formed on 2 October 2026 in the 15:00 UTC hour. Its edges are $4,141.21 and $4,155.52, so the box is about $14.31 tall and the CE sits at $4,148.36. Price touched the CE at 19:00 UTC the same day. However, the full fill came only on 5 October at 00:00 UTC, after the weekend.
Worked example: a GBPUSD gap, step by step
Let us work through the GBPUSD gap from the chart above with real prices.
- Find the edges. The gap formed around 02:45 UTC on 5 October 2026. Its top edge is 1.32186 and its bottom edge is 1.32045.
- Measure the gap. 1.32186 minus 1.32045 is 0.00141, so the gap is 14.1 pips tall.
- Find the CE. Add the edges and halve them: (1.32186 + 1.32045) / 2 = 1.321155. Rounded to the chart’s five digits, that is 1.32116.
- Note the distances. The CE sits 7.05 pips inside each edge. So a trader selling at the CE with a stop above the gap carries at least 7 pips of room, before spread.
- Watch the return. Price reached the CE at 05:15 UTC, two and a half hours after the gap formed.
- Watch the far edge. Price filled the whole gap at 06:45 UTC, 90 minutes after the CE touch.
So the level was hit, but the clean turn many traders hope for did not come. Instead, the gap filled. One case proves nothing alone, but our counts below show it is the common case.
What our measurement shows across timeframes
We grouped four symbols on M15 and H1, and 23 pairs on D1.
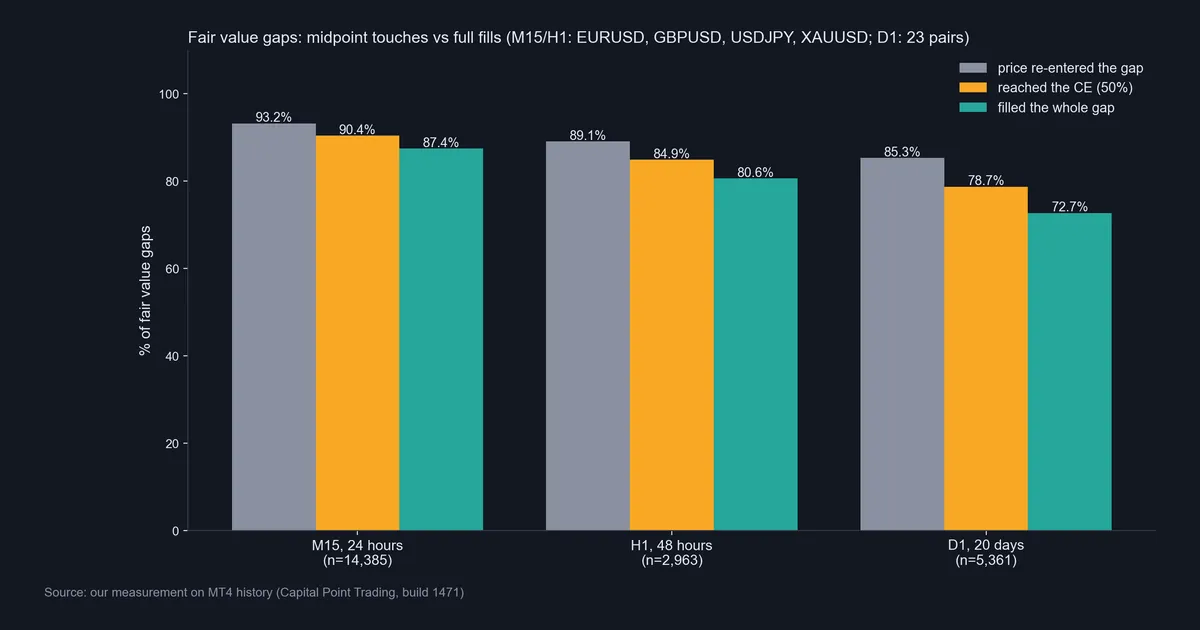
On M15, price re-entered 93.2% of gaps within 24 hours. It reached the CE in 90.4% and filled the whole gap in 87.4%. On H1, the rates were 89.1%, 84.9% and 80.6% within 48 hours. On D1, they were 85.3%, 78.7% and 72.7% within 20 days.
The higher the timeframe, the more gaps stayed open. Still, even on daily charts, roughly three gaps in four were fully filled within a month. On M15, XAUUSD reached the CE in 88.8% of 4,059 gaps, against 91.1% of 4,876 for EURUSD.
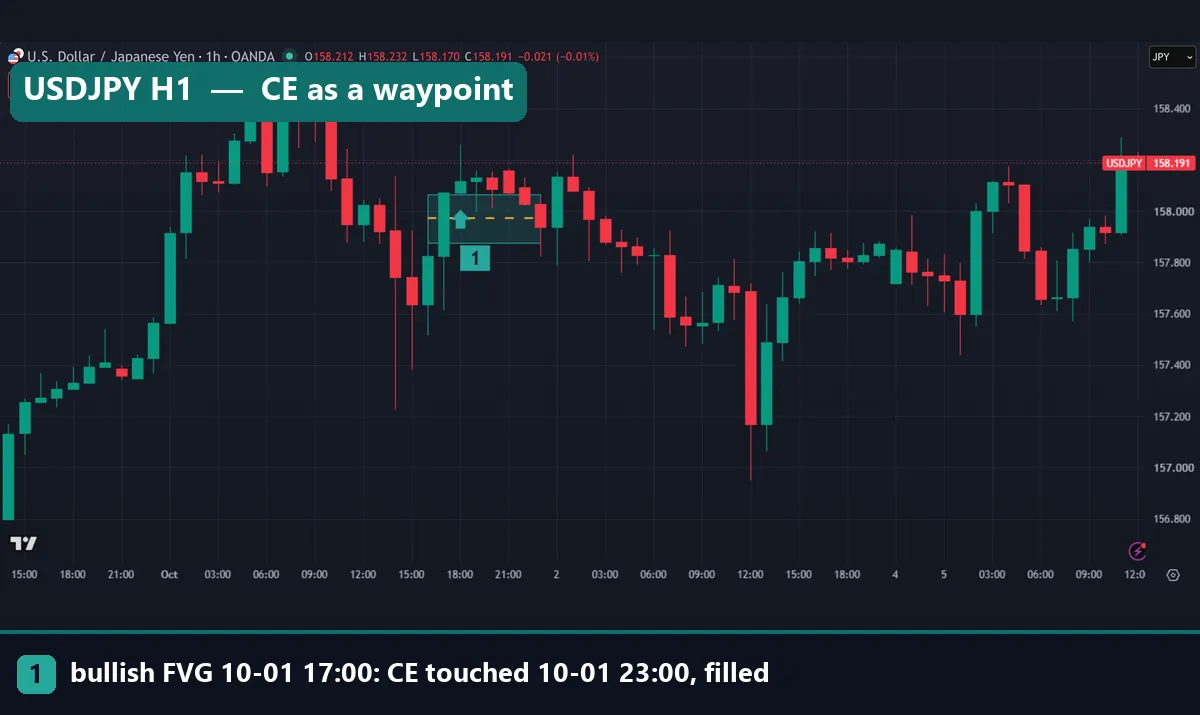
The USDJPY hourly chart is a clean example of the typical case. A bullish gap formed on 1 October 2026 in the 17:00 UTC hour, between 157.878 and 158.066. The CE sits at 157.972, and the gap is 18.8 pips tall. Price came back down, touched the CE at 23:00 UTC, and filled the whole gap within that same hour. The midpoint was a waypoint, not a pause.
Download the complete indicator database
Put these concepts on your charts. One email unlocks the full library of 1,380+ indicators with compiled MT4 and MT5 files, plus my TradingView scripts. No paywall, no spam, unsubscribe any time.
Get free access to my indicator database
One email unlocks 1,380+ free MT4, MT5 and TradingView indicators — the complete library. No single-tool download; you get the whole database.
Where it fails
Here is the plain finding. Of the gaps where price reached the CE, between 96.2% and 97.1% went on to a full fill on M15. On H1, the range was 94.4% to 95.8%. So in our data, the CE rarely acted as a floor or ceiling within the window. Once price got there, it almost always kept going.
That has three consequences. First, a high touch rate is not an edge. Most gaps get revisited anyway, so a level inside the gap will be touched often. Second, the touch rate says nothing about direction afterward. We did not measure what price did after the fill, so we cannot tell you whether the gap then “worked” as support or resistance.
Third, the numbers depend on our rules. A smaller window, a larger minimum gap, or a body-close test would all change them. We also measured history before spread, so a touch by one pip on a raw chart may not be a touch on your broker’s feed. So treat these figures as a description, not a reason to trade the midpoint.
The daily chart and the touch-then-fill pattern
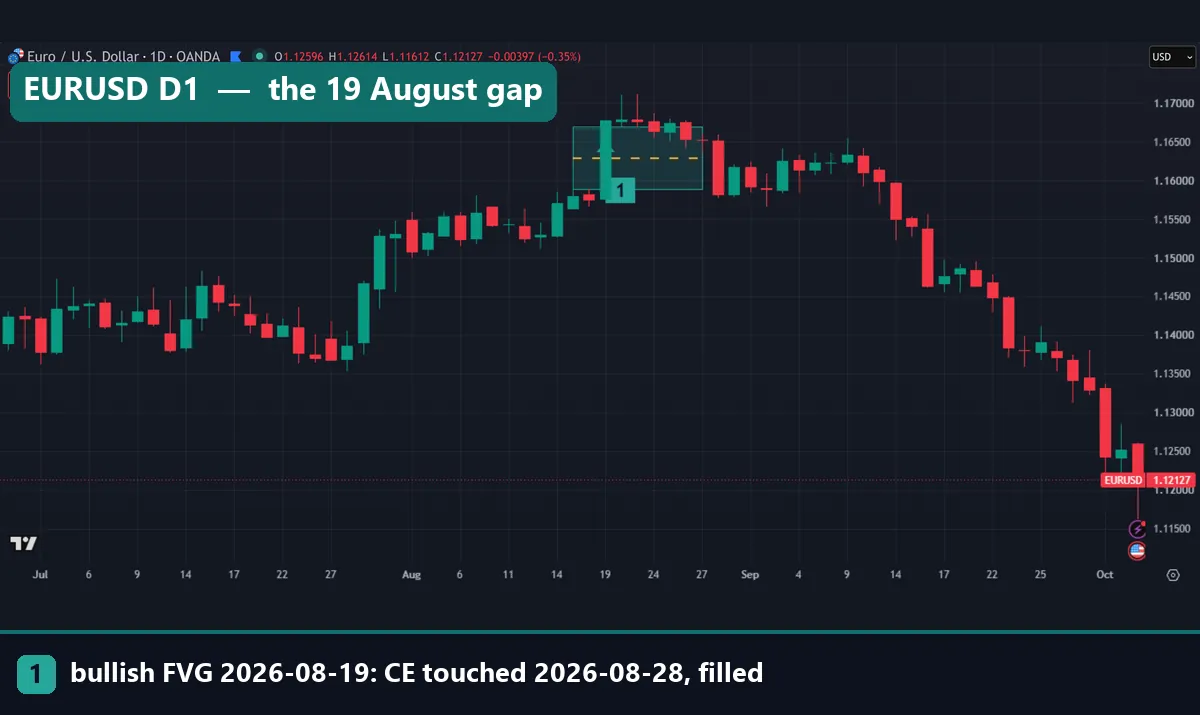
The EURUSD daily chart shows a large bullish gap from 19 August 2026, between 1.15884 and 1.16694. That is 81 pips, with the CE at 1.16289. Price drifted sideways in the upper half of the gap, then dropped back on 28 August. It touched the CE and filled the full gap on the same day. Afterward, the pair kept falling toward the 1.12 area by early October.
Not every gap closes, though. In the same EURUSD daily data, five bearish gaps from 14 September to 1 October 2026 were still open on 5 October.
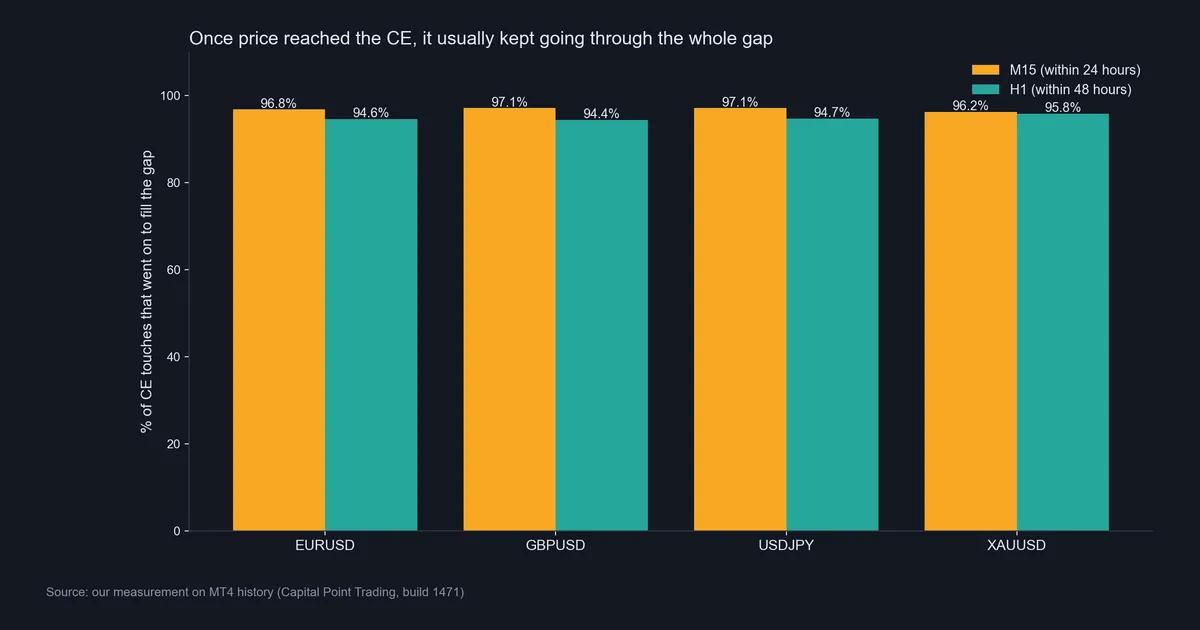
On each of the four symbols, more than 94% of CE touches turned into full fills. One honest exception sits in the TradingView data: on 5 October 2026, a EURUSD 15-minute bullish gap from 07:30 UTC had its CE touched at 08:00 UTC and was still not filled when we captured it.
CE on wicks, order blocks and other zones
ICT traders apply the same midpoint elsewhere. On a long wick, the CE is half the wick. On an order block, some traders call the 50% line the “mean threshold,” which is the same math under another name. Our fair value gap vs order block guide explains how the two zones differ.
The level also appears in related gap types. A balanced price range is where two opposing gaps overlap, and its midpoint follows the same rule. A gap that fails and flips becomes an inversion FVG, and some traders then watch its CE from the other side.
We only measured three-candle gaps, so test other zones on your own data.
CE vs the 50% Fibonacci level
The CE often gets confused with the 50% retracement. The Fibonacci 50% level halves a whole swing, from swing low to swing high. The CE halves only the gap, which is usually a small slice of that swing.
Also, ICT uses the 50% of a dealing range to split it into premium and discount. That is a third midpoint with yet another anchor. So when someone says “50%,” ask which range they mean.
Our guide on how to use Fibonacci retracement shows how to draw the swing version. The optimal trade entry zone covers the deeper 62% to 79% retracements.
Common mistakes with consequent encroachment
1. Treating every touch as a reaction. Price reached the CE in most gaps we measured, and then usually kept going. Instead, watch what the candle bodies do.
2. Drawing the CE on gaps that do not qualify. Tiny gaps appear all the time on low timeframes. That is why our rule needed a gap bigger than 0.1 ATR.
3. Confusing the CE with a stop level. A stop placed just past the CE sits inside the gap. Our data says price often trades through that area to the far edge. So a stop there can be hit by an ordinary fill. If you use a stop, the stop loss guide covers the basics of placing one.
4. Ignoring the timeframe. A 15-minute gap and a daily gap behave differently. On D1, 78.7% reached the CE within 20 days. On M15, 90.4% reached it within 24 hours.
Where to go next
If you are new to gaps, start with the basics of displacement in trading, since that fast candle is what leaves the gap. Then read about the liquidity void, a larger cousin of the FVG. For the broad picture, our guide on what ICT trading is puts all these terms in context.
To mark gaps on MetaTrader, see our ICT FVG indicator. If you prefer to draw your own box, MetaTrader uses a rectangle object, described in the MQL5 documentation for OBJ_RECTANGLE.
For the classic view of chart gaps, which predates ICT, read gaps and gap analysis at StockCharts ChartSchool. For why one-sided moves happen at all, see market microstructure on Wikipedia.
FAQ about CE in ICT trading
What does CE stand for in ICT trading?
CE stands for consequent encroachment, which is the 50% midpoint of a fair value gap or of a long wick.
How do I calculate the CE of a fair value gap?
Add the two edges of the gap and divide by two; for a bullish gap, that is the high of candle one plus the low of candle three, halved.
Is the CE the same as the 50% Fibonacci level?
No, because the CE halves only the gap, while the 50% Fibonacci level halves a whole swing from low to high.
How often does price reach the CE?
In our MT4 data, price reached the CE in 90.4% of M15 gaps within 24 hours, 84.9% of H1 gaps within 48 hours and 78.7% of D1 gaps within 20 days.
Does the CE act as support or resistance?
Rarely in our data, because 94.4% to 97.1% of CE touches on M15 and H1 went on to fill the whole gap.
Can I use the CE on an order block or a wick?
Yes, traders use the same 50% math on wicks and order blocks, but we only measured three-candle gaps, so test those zones yourself.
Does the CE level repaint?
No, once the third candle closes, both gap edges are fixed, so the midpoint never moves.
Can I trade the CE on its own?
We did not test a trading rule, and our touch-then-fill numbers argue against using the midpoint alone as an entry; results are not guaranteed; past performance is not indicative of future results.
Last updated: 5 October 2026.

About the author
Written by Dominic Walsh, a Forex trader and MT4/MT5 indicator, Expert Advisor and script developer. Every tool on forexmt4systems.com is tested on live charts before release and ships with ready-to-use compiled MT4 (.ex4) and MT5 (.ex5) files. Learn more about the trader and developer behind this site.
How we build, test and correct every tool: Editorial & Testing Policy. Trading carries risk; see the disclaimer.