
The Gambian dalasi is the currency of The Gambia, and on our data feed it went from 9.965 per US dollar in August 1997 to 74.4 on 16 November 2026. We use 29 years of daily quotes to pin down three points. First, how much value the dalasi lost, and how to work that out without flipping the sign. Second, which big moves on a USD/GMD chart look real and which look like the feed stalling and then catching up. Third, why a chart rate is not the rate the central bank publishes.
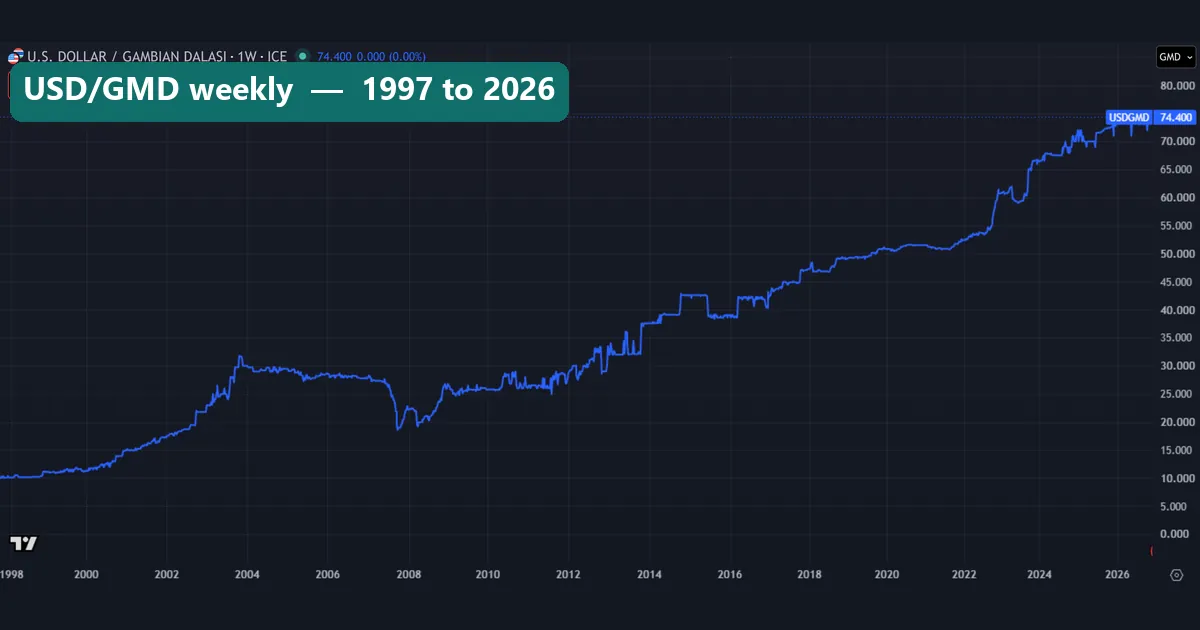
The weekly line climbs for most of 29 years. It breaks twice: a sharp dip in late 2007, and a high shelf that steps down in mid-2015 and stays lower into 2016. The chart counts dalasis per dollar, so every step up is a step down for the dalasi. Our guide to line charts in forex covers how to read one.
What the Gambian dalasi is
The dalasi is the national money of The Gambia, a small country on the West African coast. Notes and coins come from the Central Bank of The Gambia. Under ISO 4217 it carries the letters GMD and the number 270. SIX’s ISO 4217 currency code lists show both codes, plus two digits for the minor unit. Those digits are the bututs: 100 bututs make one dalasi.
The Gambian dalasi article on Wikipedia dates the currency to 1971, when it replaced the Gambian pound at 5 dalasis per pound. Prices carry the letter D, so D74 means 74 dalasis.
Like other national money today, the dalasi is a fiat currency, backed by the state rather than by gold. For its neighbours, see our guide to African currencies or our GHC currency guide on the Ghanaian cedi.
How the USD/GMD quote works
Charts list the pair as USD/GMD, which counts how many dalasis a single US dollar buys. So the line rises when the dalasi weakens, and it falls when the dalasi gains.
That inversion trips people up, so do the sums on purpose. For the change in the dalasi’s value, divide the old rate by the new rate, then take away 1.
dalasi change = (old USD/GMD rate / new USD/GMD rate) - 1
Across our window, 9.965 / 74.4 – 1 = -0.866. That is an 86.6% drop in what a dalasi buys in dollars. Now look from the other side. The dollar’s gain is 74.4 / 9.965 – 1, or +646.6%. Both numbers describe one move. TradingView’s USD/GMD symbol page reports the dollar side, which is why its all-time figure looks so large.
Single days say little. The median daily move is just 0.08%, so the long fall came mainly from a handful of bad years. Over long spans, a currency’s slide tends to track its inflation gap with the US; see how inflation affects forex.
How we tested
Our source is the FX_IDC:USDGMD symbol on the TradingView web chart, and its header credits ICE. Daily, weekly and monthly bars came down over two days, 16 and 17 November 2026. Anything stamped 17 November was still live at pull time, and we discarded it. That makes Monday 16 November 2026 our last complete close.
The daily series starts on 20 August 1997. A daily FX_IDC bar is time-stamped 22:00 UTC the night before the session it records, and we filed each one under that session’s date. Next, we screened out bad prints. A close went out if it sat more than 5% from the median of the 11 closes centred on it. That removed 67 prints, most of them from 2010 to 2013, and left 6,286 daily closes.
Then we measured year-end changes, unchanged days, flat stretches and pauses longer than five calendar days. We did not simulate trades, so spreads and fees play no part. Our editorial testing policy describes the checks we run on figures like these. The two data charts, images four and five, come from these bars too. For why feeds lag or differ, see our note on TradingView real-time data.
Our test settings and headline numbers
Each value below comes from the same FX_IDC daily closes, after the bad-print screen.
| Parameter or result | Value |
|---|---|
| Symbol | FX_IDC:USDGMD on the TradingView web chart (source shown: ICE) |
| Bars | Daily for every figure; weekly and monthly only for the long charts |
| Date window | 20 August 1997 to 16 November 2026 |
| Daily closes kept | 6,286, with 67 bad prints removed |
| Bad-print rule | Close more than 5% from the median of the 11 closes around it |
| Pause rule | More than 5 calendar days between two prints: 144 pauses |
| Flat-stretch rule | Every close within 0.5% of the first close of the stretch |
| First and last close | 9.965 and 74.4 dalasis per US dollar |
| Change in the dalasi’s value | -86.6% |
| Weakest dalasi | 74.95 per dollar on 31 August 2026 |
| Strongest dalasi | 9.965, the very first print, 20 August 1997 |
| Median daily move | 0.08%, in absolute terms |
| Days with no change | 37.1% |
| Longest flat stretch | 138 trading days, 15 June 2020 to 22 January 2021, from 51.25 to 51.67 |
Two rows need a caution. The strongest print is simply the first one, so it marks where the feed starts, not a peak. Also, the 144 pauses are uneven: most fall in the feed’s first five years and in 2006, when prints came far less often.
Reading the chart: two jumps on 1 November
The daily candles from September 2012 to January 2014 show this feed at its noisiest.
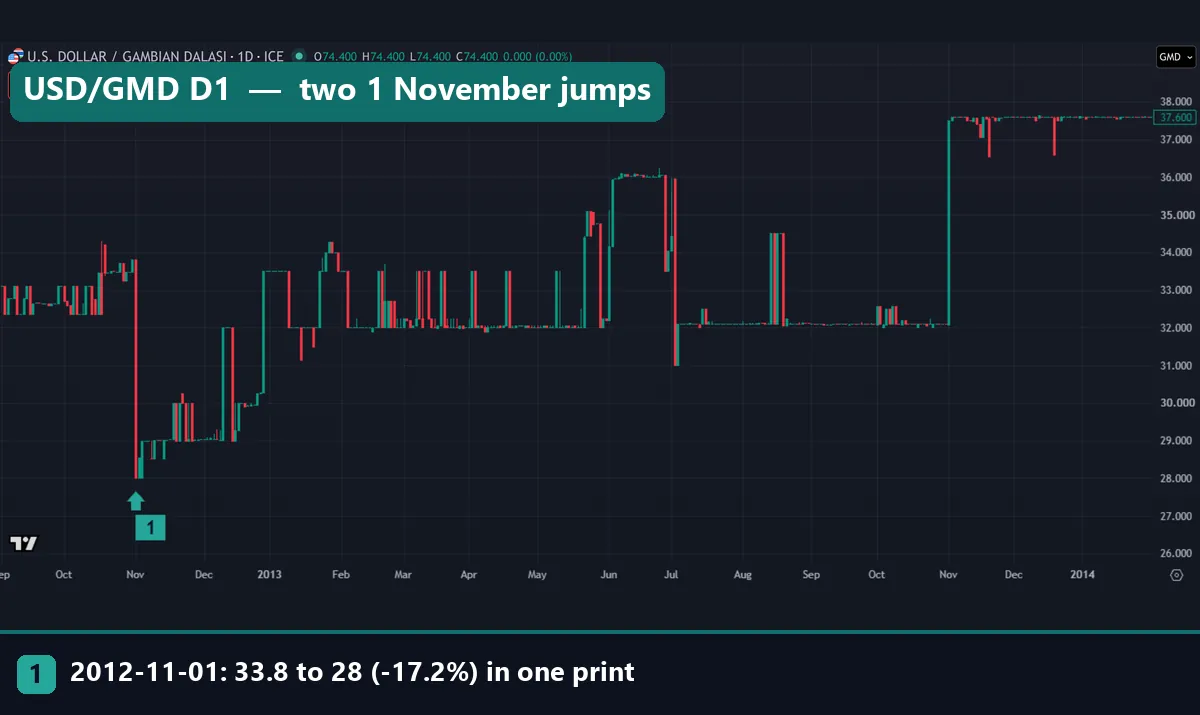
Marker 1 sits on 1 November 2012. The quote closed at 33.8 the day before, then printed 28, a fall of 17.2% in the rate. By the formula above, that is a one-day gain of 20.7% for the dalasi.
No pause came first, yet the low did not last. The quote crept back up through November and December. Then on 28 December 2012 it leapt from 30.28 to 33.5 in one print.
Through 2013 the candles flicker between about 31 and 36. From July they settle near 32.1, apart from a few bumps and a short spike in August. On 1 November 2013 the quote jumped from 32.08 to 37.5, up 16.9%, and stayed near 37.6 into 2014.
Two outsized single-print moves on the same date, a year apart, look more like a feed resetting than a market trading. We found no central bank notice for either date, so we do not name a cause.
Reading the chart: 138 quiet days near 51.5
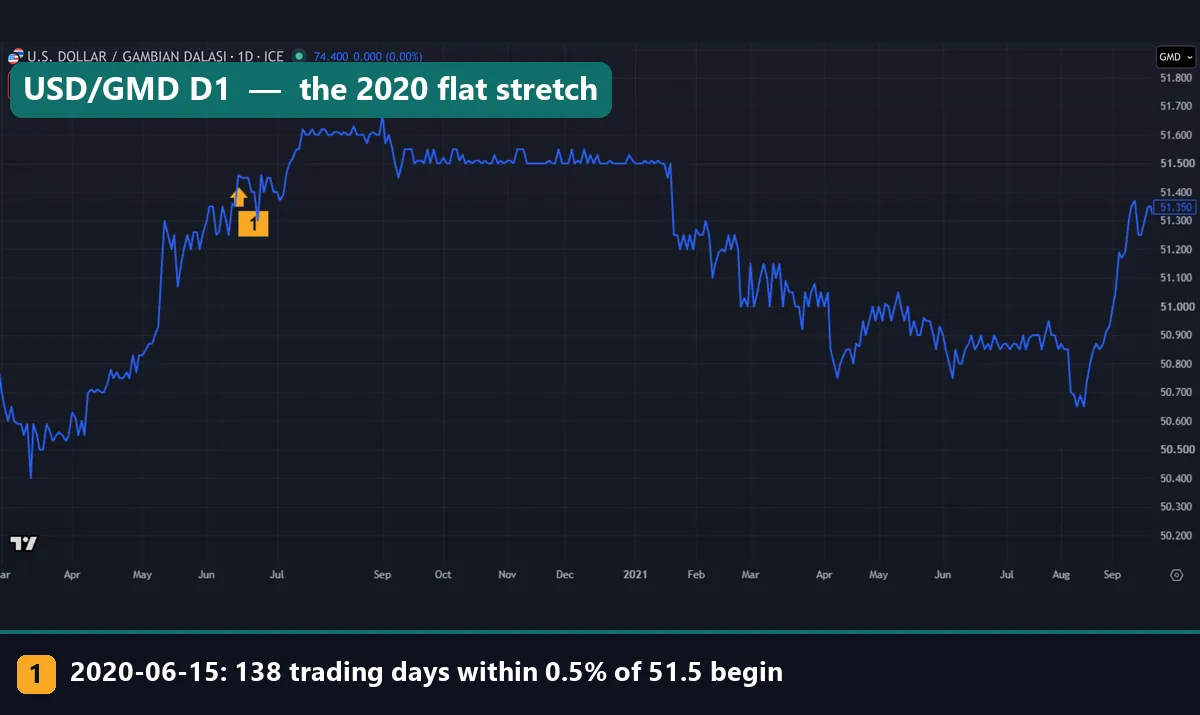
This line runs from March 2020 to September 2021. Marker 1 is 15 June 2020, where the longest flat stretch in our data begins. For 138 trading days, up to 22 January 2021, every close stayed within 0.5% of where the stretch opened. The band ran from 51.25 to 51.67, around a median of 51.5.
After that, the line broke lower and a second calm spell followed. From 23 March to 10 August 2021, the quote spent 86 trading days between 50.69 and 51.08.
Flat does not mean frozen here. The line still twitches by a few bututs most days. In our fifth image, 2021 has one of the lowest shares of unchanged prints, yet one of the smallest average moves. So this looks like a quiet market that kept quoting, not a stalled feed. The dalasi lost only 1.3% in 2020 and 1.8% in 2021.
Worked example: 200 US dollars in dalasis
Here is the plain conversion on real closes. Suppose someone sends 200 US dollars to family in The Gambia. Multiply the dollars by the USD/GMD rate.
- 20 August 1997, at 9.965: 200 x 9.965 = 1,993 dalasis.
- End of 2006, at 27.725: 5,545 dalasis.
- End of 2007, at 22.2: 4,440 dalasis, fewer than a year earlier, since the dalasi gained 24.9% in 2007.
- 16 November 2026, at 74.4: 14,880 dalasis.
Check it from the dalasi side: 9.965 / 74.4 – 1 = -0.866. The shift that turned 1,993 dalasis into 14,880 cut the dalasi’s dollar value by 86.6%.
The rate you pick matters too. The Central Bank of The Gambia’s daily valuation rates table listed the US dollar at 72.90 for 17 November 2026. At that rate, 200 dollars come to 14,580 dalasis, or 300 fewer than our feed’s 16 November close implies. That is a gap of about 2.1%, one day apart.
Holders feel the reverse. At year-end rates, 10,000 dalasis were worth 190.66 dollars at the end of 2021 and 134.41 dollars on 16 November 2026, a loss of 29.5%. For other amounts, our currency converter does the multiplication for you.
Twenty-nine years in two charts
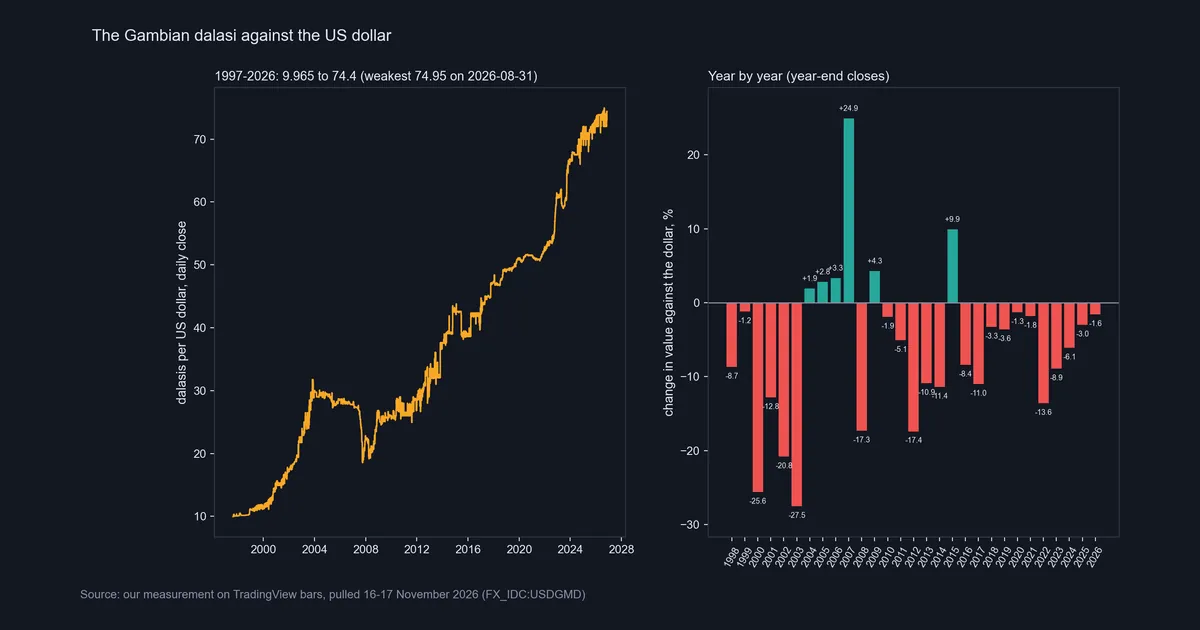
The bars are mostly red: the dalasi lost value in 23 of the 29 years from 1998 to 2026, with 2026 counted to 16 November. The worst was 2003, when the rate went from 21.75 to 30, a 27.5% loss. In 2007 the rate fell from 27.725 to 22.2, a 24.9% gain, but 2008 took most of it back. Since 2022 the losses have shrunk each year, from 13.6% down to 1.6% so far in 2026.
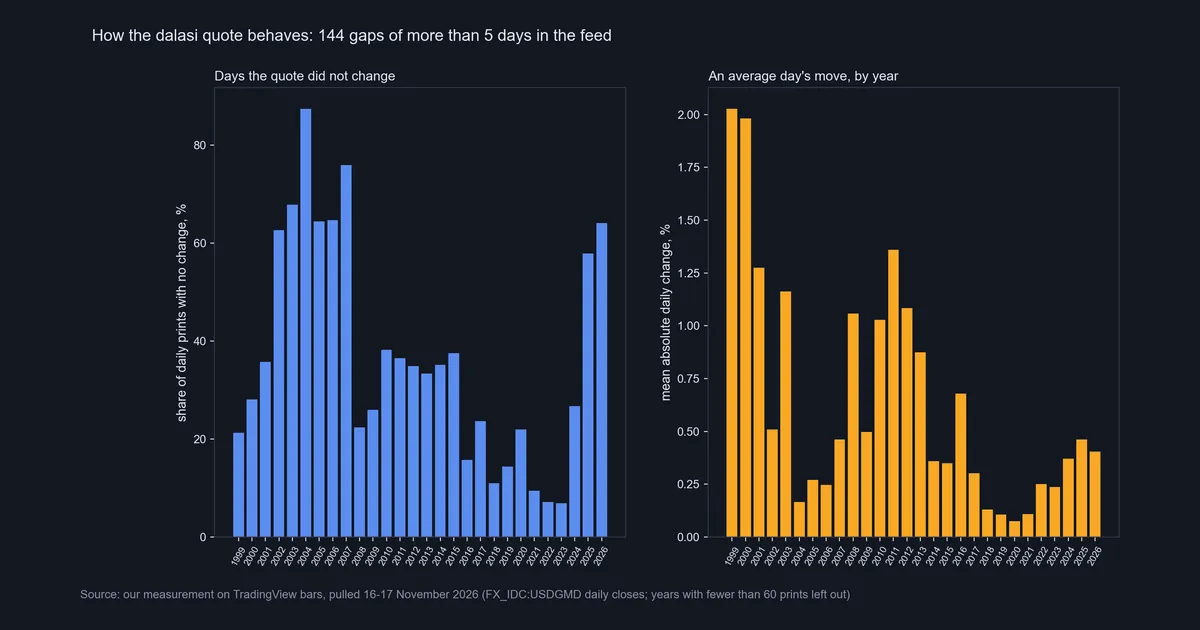
The fifth image measures the feed, not the currency. On the left, unchanged prints top 80% in 2004 and fall under 10% from 2021 to 2023, then climb back above half in 2025 and 2026. On the right, the average daily move is about 2% in 1999 and 2000, but under 0.15% from 2018 to 2021. Years with fewer than 60 prints, 1997 and 1998, drop out.
Download the complete indicator database
Put these concepts on your charts. One email unlocks the full library of 1,380+ indicators with compiled MT4 and MT5 files, plus my TradingView scripts. No paywall, no spam, unsubscribe any time.
Get free access to my indicator database
One email unlocks 1,380+ free MT4, MT5 and TradingView indicators — the complete library. No single-tool download; you get the whole database.
Where it fails: the limits of a vendor quote
A USD/GMD chart is a useful record, but it falls short in five ways.
First, the chart carries a vendor’s price, while the official figure comes from the central bank. The two differ, as the 72.90 against 74.4 example showed. For paperwork that needs an official rate, use the bank’s own table.
Second, the feed goes silent. We counted 144 pauses of more than five calendar days, and when quoting resumes, one print carries every missed day. A six-day silence from 21 to 27 May 2013 ended with the rate 8.59% higher. Call that the feed catching up, not a crash.
Third, the feed repeats itself. On 37.1% of days the close matched the day before. From the line alone, you cannot tell a calm market from a quote nobody refreshed.
Fourth, small bad prints survive our screen. The 5% rule catches wild outliers, but a one-day drop to a round 72.000 stays in. That is why our 2026 range starts at 71: the low is one of those dips.
Fifth, there is no volume and no dealing price. The SELL and BUY boxes on our captures read 74.400 and 76.400 on capture day, not on any date shown. Our guide to the spread in forex explains two-way quotes.
The last twelve months and the monthly view
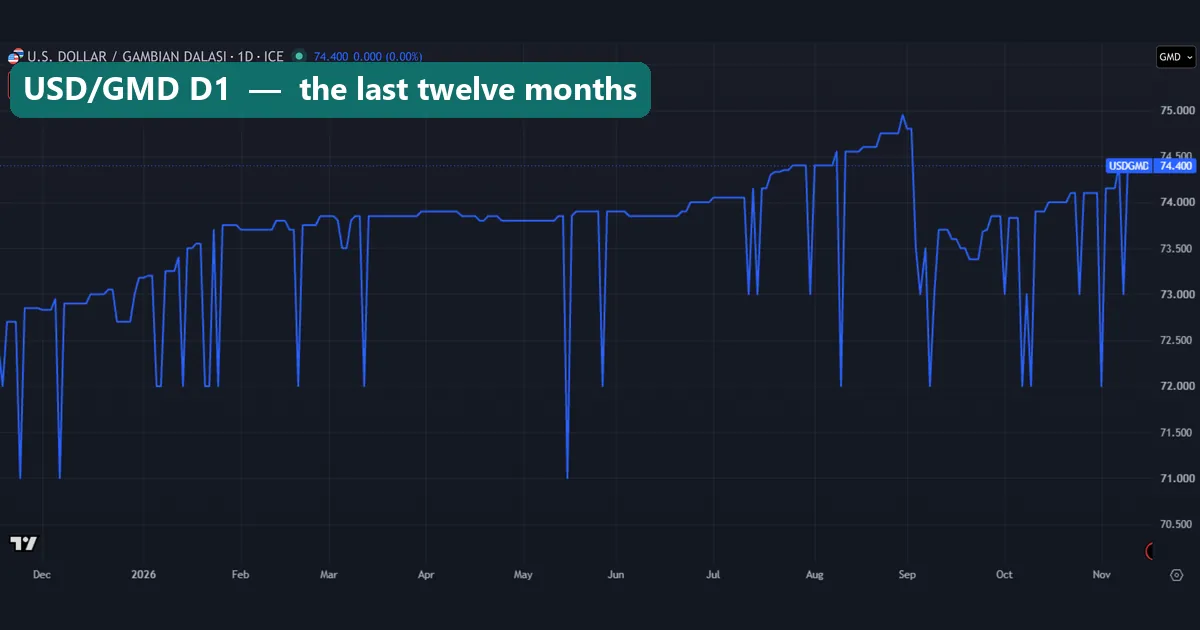
From late November 2025, the line climbs slowly from about 72.7 to the record 74.95 on 31 August 2026. It slips back to between 73 and 74 in September, then reaches 74.4 in November. More than a dozen times, it drops to a round 72.000 for one print and snaps back the next day. A few dips land on 71.000 or 73.000 instead. That reads like a quoting habit of the feed, not like trade.
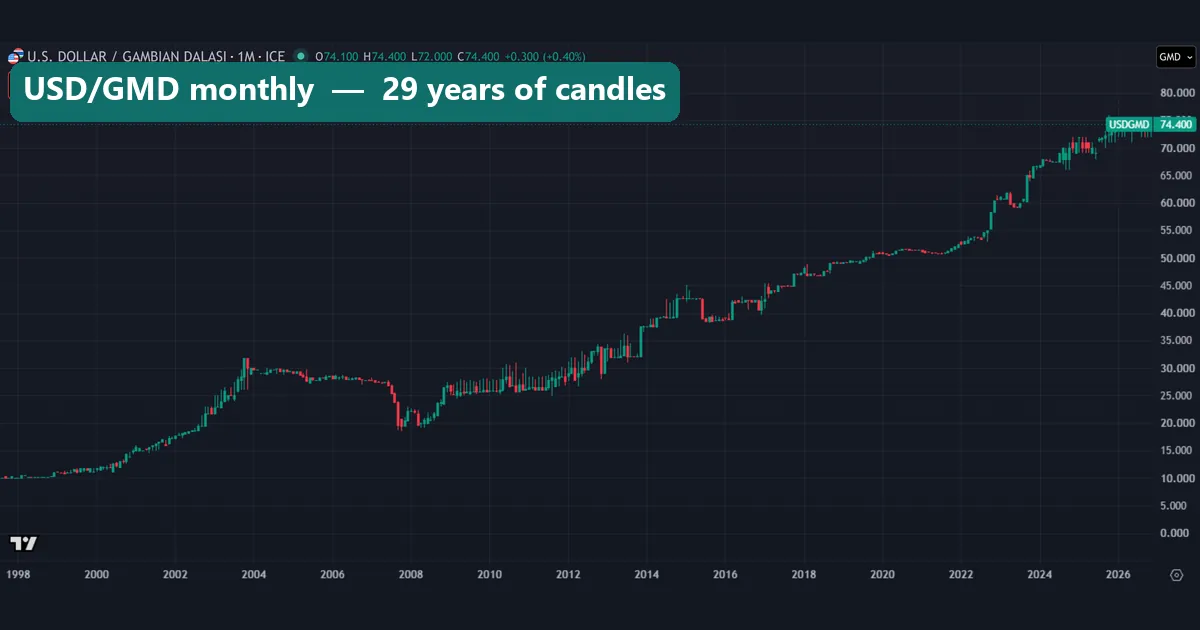
The monthly candles squeeze all 29 years into one picture. On capture day, the header shows the current month at an open of 74.100, a high of 74.400, a low of 72.000 and a close of 74.400. That low is one of the single-print dips. So a monthly range on this feed can be wider than any rate that held for a full day.
Four common mistakes with dalasi charts
Reading the line the wrong way. A rising USD/GMD line means a weaker dalasi. Check the pair order before you call a move good or bad.
Treating one print as an event. The 17.2% drop of 1 November 2012 reversed within two months. Before you name a cause for a jump, look at the days around it and check for a pause.
Confusing the dollar’s gain with the dalasi’s loss. The dollar rose 646.6% against the dalasi, but the dalasi lost 86.6%. No currency can lose more than 100%, so a bigger loss figure means the sum ran the wrong way.
Quoting the feed as the official rate. Our feed’s 74.4 and the central bank’s 72.90 differ by about 2.1%. When a figure must match an official source, take the bank’s table and note its date.
Where to go next
We have measured several thin, dollar-quoted currencies the same way. Compare the dalasi with the Liberian currency, another West African money with a patchy feed, or the Cape Verde escudo off the same coast. Further afield, read about the Egyptian pound and the BWP Botswana pula.
Our list of the weakest currency in the world puts an 86.6% fall in context. And our explainer on what imports are shows why a country that buys more abroad than it sells needs dollars to pay for it.
FAQ: Gambian dalasi questions
Which code and symbol does the Gambian dalasi use?
It is GMD, with the numeric code 270. One dalasi splits into 100 bututs, and local prices use the letter D.
How far has the dalasi fallen against the US dollar?
In our feed, the rate rose from 9.965 per dollar on 20 August 1997 to 74.4 on 16 November 2026. So the dalasi lost 86.6% of its dollar value.
What was the dalasi’s weakest close on record?
On 31 August 2026, at 74.95 per dollar, the highest USD/GMD close in our data. By 16 November 2026 the rate had eased to 74.4.
Did the dalasi really gain about 20% in one day in 2012?
The feed shows 33.8 on 31 October 2012 and 28 on 1 November. But the quote climbed back within two months and we found no official notice, so we treat it as a data event.
Why does the USD/GMD line keep dropping to 72.000 for a day?
Those dips are round-number prints in the vendor feed. The quote goes back to its earlier level the next day, so they do not show a rate that held.
Is the TradingView rate the official dalasi rate?
No. The Central Bank of The Gambia publishes its own daily valuation rate. On 17 November 2026 its table showed 72.90, while our feed closed at 74.4 a day earlier.
In which years did the dalasi gain value?
Only six of the 29 years from 1998 to 2026: 2004, 2005, 2006, 2007, 2009 and 2015. The biggest gain came in 2007, at 24.9%.
Will past USD/GMD moves show where the rate heads?
No. It records a reference feed full of pauses, repeats and stray prints, and none of it is a dealing price. Read it as history and plan for surprises either way: results are not guaranteed; past performance is not indicative of future results.
Last updated: 17 November 2026.

About the author
Written by Dominic Walsh, a Forex trader and MT4/MT5 indicator, Expert Advisor and script developer. Every tool on forexmt4systems.com is tested on live charts before release and ships with ready-to-use compiled MT4 (.ex4) and MT5 (.ex5) files. Learn more about the trader and developer behind this site.
How we build, test and correct every tool: Editorial & Testing Policy. Trading carries risk; see the disclaimer.