
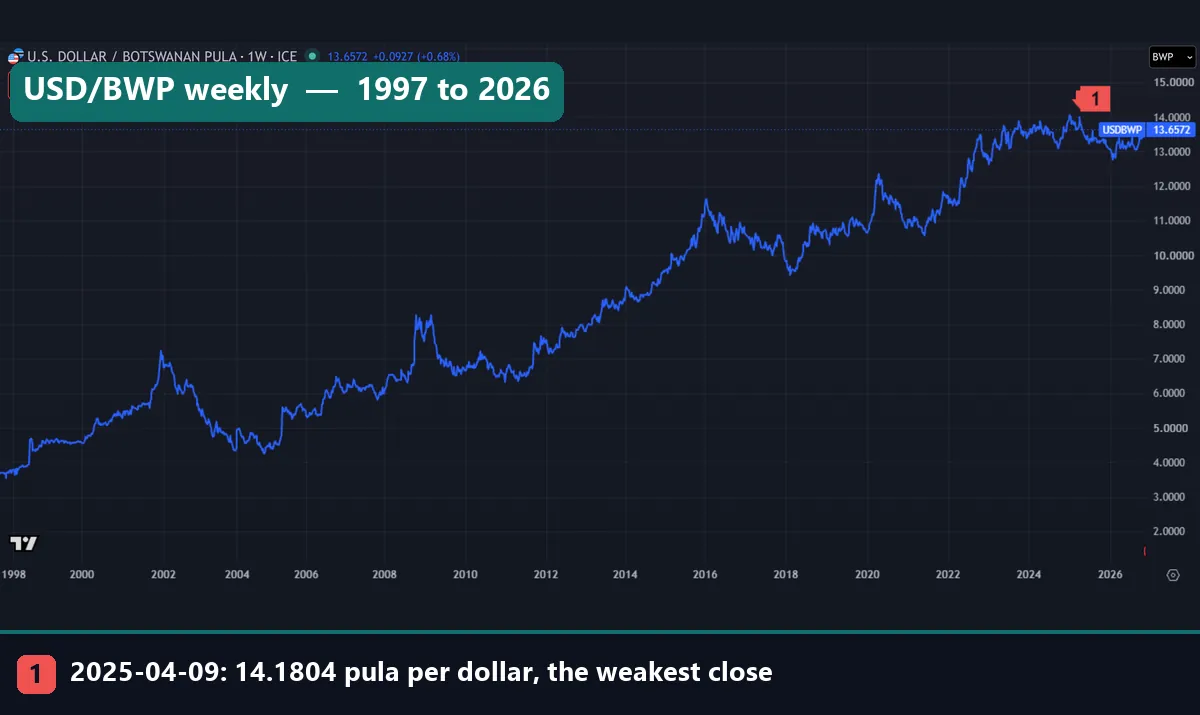
A search for BWP Botswana is a search for the pula, the currency of Botswana, whose ISO code is BWP. The pula is not nailed to the dollar, and it does not float freely either. It follows a basket of the South African rand and the IMF’s Special Drawing Right, and that basket slides a little each day. We measured 6,616 daily USD/BWP closes from 20 August 1997 to 13 November 2026 to see what that link does. In short, the pula lost 72.7% of its value against the US dollar, yet against the rand it ended almost where it stood in mid-2005.
What BWP Botswana means: the pula in brief
The Botswana pula entry on Wikipedia covers the basics. The pula arrived on 23 August 1976 and replaced the South African rand at par. Its name means rain in Setswana, and one pula splits into 100 thebe. The Bank of Botswana issues it.
The same entry sketches the link. At first the pula tracked the dollar. It floated from January 1979, then from June 1980 it followed a basket of the rand and the SDR, the IMF’s unit of account. So the pula sits between a free float and a hard peg.
On a quote screen the pair shows as USD/BWP, the pula you get for one dollar. When that count climbs, the pula has lost ground. In our data it rose from 3.6969 to 13.5645. The strongest close was 3.541 on 14 October 1997, and the weakest was 14.1804 on 9 April 2025, marker 1 above. Like most money today, the pula is a fiat currency, and policy sets its worth.
How the pula’s crawling peg works
Botswana calls its system a crawling peg. The Bank of Botswana’s exchange rate framework page dates it to May 2005. Before that, the Bank devalued the pula twice: by 7.5% in February 2004 and by 12% in May 2005. The crawl took over from such one-off steps.
The crawl works on the basket, not on the dollar. Each year the Bank sets a rate from the forecast inflation gap between Botswana and its trading partners. Then the basket value shifts by that rate in small daily steps. A Botswana Daily News report of 18 August 2026 describes those steps and puts the weights at 50% rand and 50% SDR. Meanwhile, the Bank’s table lists a crawl of -2.76% a year from July 2025. Our page on how inflation affects forex explains why an inflation gap wears a currency away.
A dollar chart shows the sum of these parts. In log terms, our simplified model reads:
move in USD/BWP = w_rand x move in USD/ZAR
                + w_SDR  x move in USD/SDR
                + daily crawl
rand per pula   = USDZAR / USDBWP
This is our model, not the Bank’s formula. Still, it shows the key point. When the rand drops against the dollar, the pula drops by only part of that move. When the dollar slips against the other SDR currencies, that leg lifts the pula.
How we tested
We pulled daily closes for FX_IDC:USDBWP, FX_IDC:USDZAR and FX_IDC:EURUSD on the TradingView web chart on 16 November 2026. Bars dated 16 November were still forming, so we left them out. That leaves USD/BWP from 20 August 1997 to 13 November 2026, or 6,616 days. We read the charts on daily and weekly bars, and the chart header names ICE as the source.
Next, we cleaned the file. A close more than 5% from the median of the 11 prints around it counted as bad, and 5 went out. Three sat in August and September 1998, at 4.6512, 4.6849 and 4.6827. Then we built rand per pula, USD/ZAR divided by USD/BWP, from 1 June 2005.
For the basket, we regressed the weekly log change of USD/BWP on USD/ZAR and on euros per dollar. The euro stands in for the SDR side. We fitted three periods: 2005 to 2012 (391 weeks), 2013 to 2019 (360) and 2020 to 2026 (358). We ran no trade test, so spreads and fees play no part. Our editorial testing policy sets out how we handle vendor data.
The pula’s numbers at a glance
| Item | Value | Source |
|---|---|---|
| Code and subunit | BWP, 100 thebe | Wikipedia |
| Regime | Crawling peg since May 2005 | Bank of Botswana |
| Basket | Rand and IMF SDR | Bank of Botswana |
| Weights, August 2026 | 50% rand, 50% SDR | Botswana Daily News |
| Crawl from July 2025 | -2.76% a year | Bank of Botswana |
| Devaluations | 7.5% (Feb 2004), 12% (May 2005) | Bank of Botswana |
| USD/BWP, 13 November 2026 | 13.5645 | Our bars |
| Weakest close | 14.1804 (9 April 2025) | Our bars |
| Median daily move | 0.33% | Our bars |
| Rand per pula, 13 November 2026 | 1.2476 | Our bars |
| Fitted rand weight, 2020 to 2026 | 0.37 (R² 0.69) | Our fit |
Treat the last row with care. A fitted weight describes past moves, and it does not replace the published 50%.
Reading USD/BWP on a chart
Start with the weekly chart at the top. The line climbs over 29 years, but in bursts. It spikes around the turn of 2002, in late 2008, in early 2016 and in early 2020. After each spike the pula won some ground back, for example 28.7% in 2002, 21.5% in 2003 and 12.8% in 2009.
Now zoom in on May 2005. On 30 May the close went from 4.7919 to 5.4017, up 12.73% in one print. For the pula, that is a loss of about 11.3% of its dollar value. The size fits the 12% devaluation the Bank records, though the cut applied to the basket, not to the dollar.
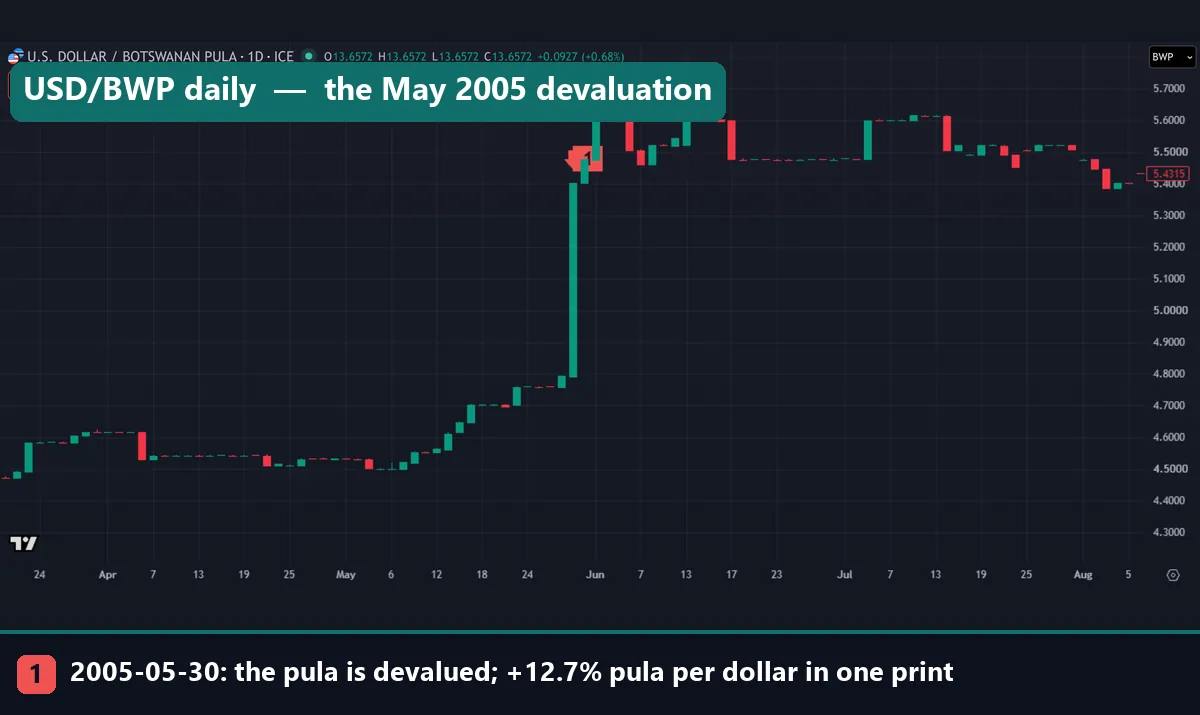
Two more details sit on this chart. In April the bars barely move: the feed held between 4.5106 and 4.5419 for 20 days, from 6 April to 3 May 2005. After the jump, the line rises for two more sessions toward 5.6 and then goes sideways. So a devaluation is rarely one clean bar.
The rand per pula line
A dollar quote mixes two stories: the dollar and the basket. Dividing USD/ZAR by USD/BWP takes the dollar out. You can type that ratio into the symbol box, as TradingView’s help page on spread charts shows.
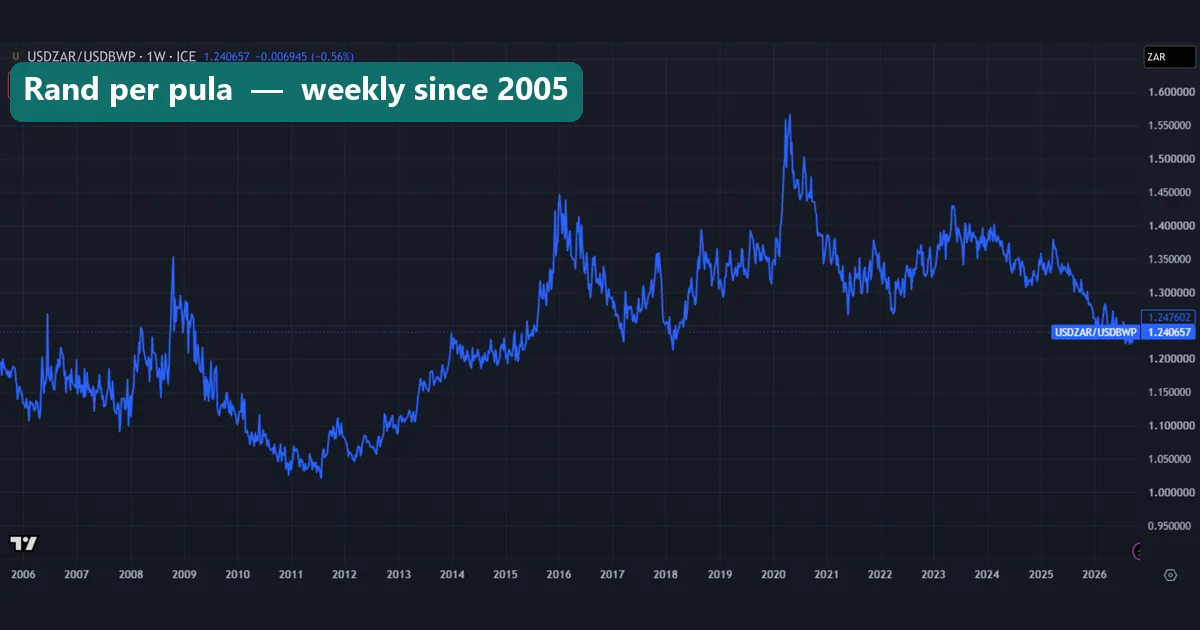
This line has no real trend. Rand per pula was 1.2296 on 1 June 2005 and 1.2476 on 13 November 2026, about 1.5% apart after 21 years. Over those years the dollar chart climbs steadily. So the pula has travelled with the rand, not apart from it.
Its swings still matter. The low came on 13 September 2011 at 1.0169, when a pula bought barely one rand. The high came on 3 April 2020 at 1.5588, after the rand had fallen far faster than the pula. In 2020 the Bank also moved to a faster downward crawl, and its framework page ties that step to COVID-19. Late 2008 shows a smaller spike, and the sharpest USD/BWP print after 2005 came then: 6 October 2008, up 7.41% from 6.9171 to 7.4299. Our guide to currency correlation in forex covers how pairs move in step.
Worked example: 1,000 pula on 13 November 2026
- USD/BWP closed at 13.5645, so 1,000 pula buy 1,000 / 13.5645 = 73.72 US dollars.
- Rand per pula was 1.2476, so the same 1,000 pula equal 1,247.60 rand.
- Multiply the two: 1.2476 x 13.5645 = 16.92 rand per dollar. The USD/ZAR chart below opens its next bar at 16.9233, so the cross holds.
- On 20 August 1997, 1,000 pula bought 1,000 / 3.6969 = 270.50 dollars. Now they buy 73.72, which is the 72.7% loss in one line.
Next, test the fit. Suppose the rand loses 2% against the dollar in a week. Our 2020 to 2026 fit says USD/BWP would tend to rise about 0.74%, or 0.37 times 2%. If the euro also gains 1% on the dollar, that leg points to a fall of about 0.2%. With an R² of 0.69, about 31% of weekly variation stays unexplained, so these are tendencies, not rules.
Finally, compare the year with the crawl. The pula has lost 3.7% against the dollar in 2026 so far, from 13.0679 at the end of 2025. A crawl of -2.76% a year can explain part of that. The basket currencies’ own swings make up the rest. Our currency converter runs this kind of sum for other pairs.
What our two data charts show
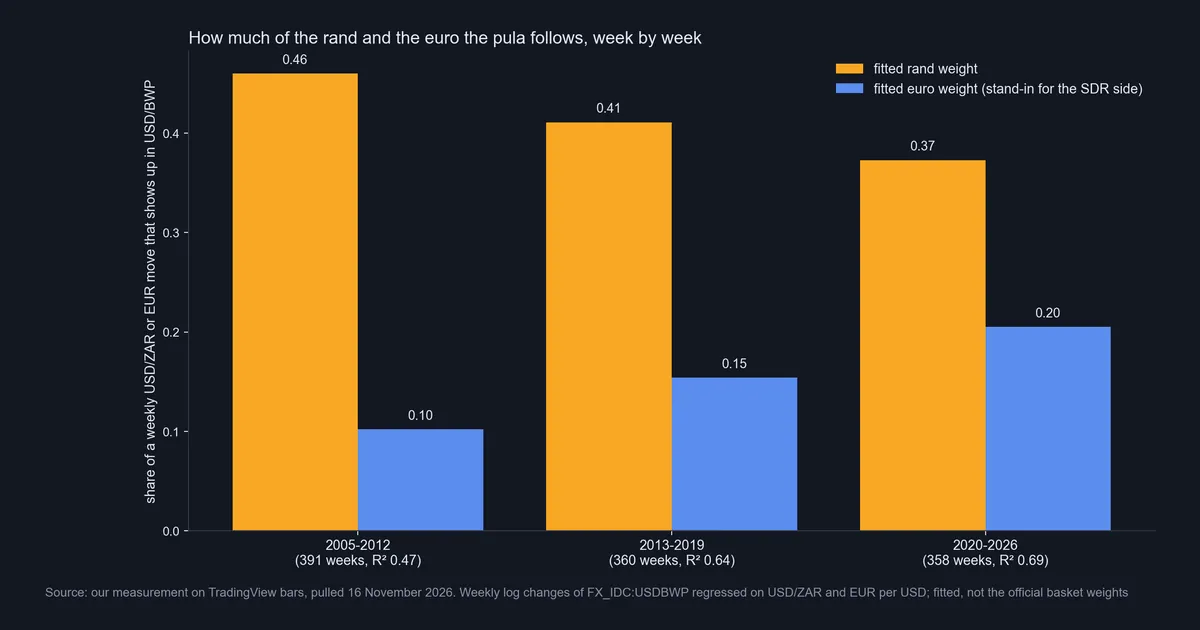
The rand weight eases from 0.46 (2005 to 2012) to 0.41 (2013 to 2019) and 0.37 (since 2020). Meanwhile, the euro weight climbs from 0.10 to 0.15 and then 0.20. The fit also tightens, with R² rising from 0.47 to 0.64 and then 0.69.
Why is the rand weight below the published 50%? First, the euro is only part of the SDR. Second, noise in the rand and euro closes tends to pull a fitted weight toward zero. Third, the Bank reviews the weights twice a year, so one number per period blends several settings. That is why we call these figures a record, not a rule.
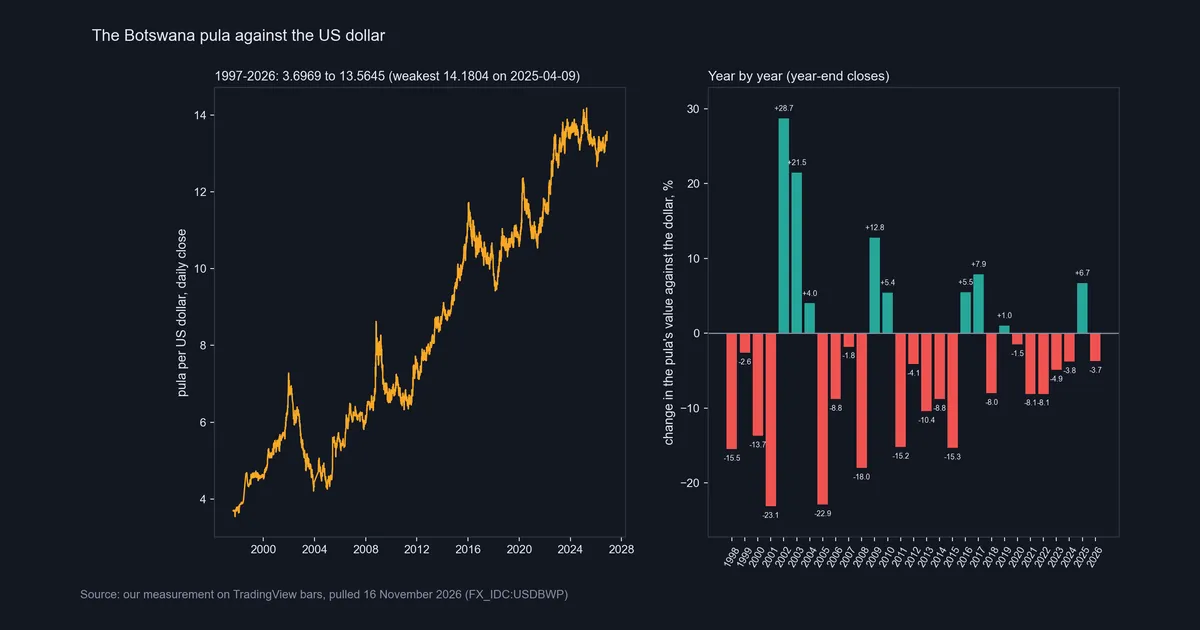
The second chart adds the pula’s yearly change against the dollar. Red bars dominate. In the 28 full years from 1998 to 2025, the pula gained in 9 and lost in 19. Its worst years were 2001 (-23.1%), 2005 (-22.9%) and 2008 (-18.0%). By contrast, 2025 brought a gain of 6.7%, the best since 2017.
Download the complete indicator database
Put these concepts on your charts. One email unlocks the full library of 1,380+ indicators with compiled MT4 and MT5 files, plus my TradingView scripts. No paywall, no spam, unsubscribe any time.
Get free access to my indicator database
One email unlocks 1,380+ free MT4, MT5 and TradingView indicators — the complete library. No single-tool download; you get the whole database.
Where it fails
A rate on a chart is a data vendor’s quote, not the Bank of Botswana’s official rate. For a thin currency, vendor prints can lag, skip days or jump. So treat our figures as a measurement of the feed, and ask the Bank for anything official.
The record has holes. On 19 April 2004 the rate rose 6.33%, which looks like a one-day event. But the print before it was 4.432, the same figure that closed 2003. In other words, the feed had not moved since the year turned. Since the Bank dates its 7.5% devaluation to February 2004, this bar is the feed catching up. A real gap, of the kind in our guide to types of gaps in forex, comes from trading. This one comes from missing data.
September 1998 is murkier. The 29 September print rose 13.71%, from 3.9393 to 4.4793. Yet the three prints our filter removed sat between 4.65 and 4.68, so the true path is unclear. We found no source naming a cause, so we name none.
The fit has limits too. It rests on a stand-in for the SDR, and it explains only 47% to 69% of weekly moves. It also says nothing about the future, because each review can change the weights or the crawl. And a crawling peg can still move in a step, as 2004 and 2005 showed.
The last twelve months: USD/BWP beside USD/ZAR
These two daily charts cover November 2025 to November 2026. First comes USD/BWP, then USD/ZAR.
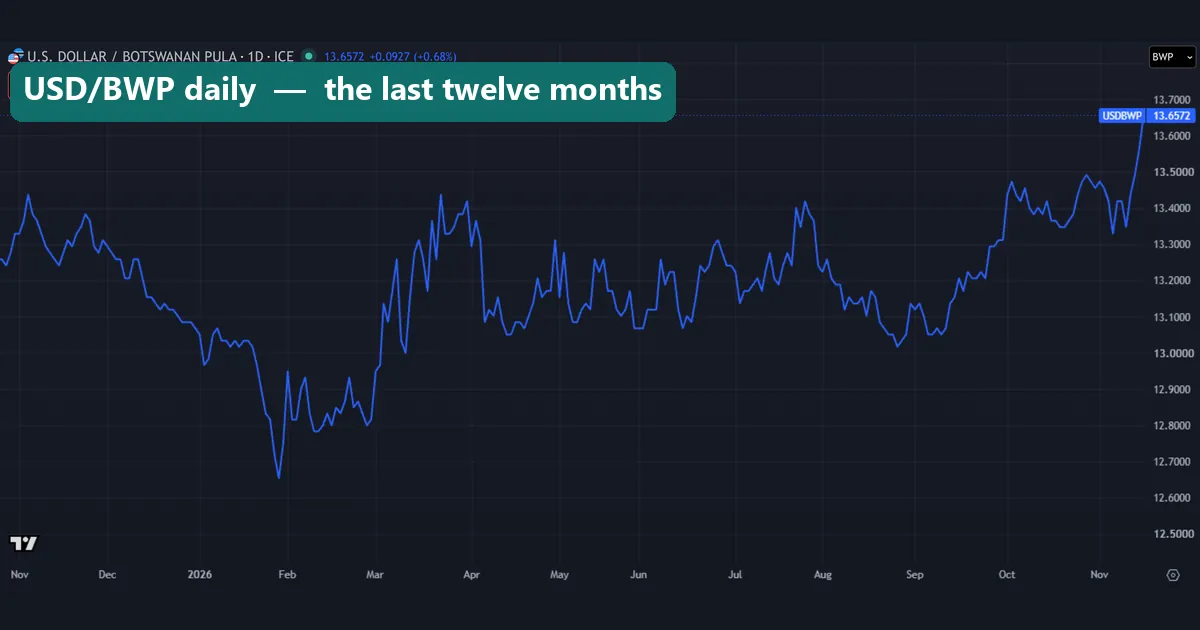
Both lines fall into late January 2026 and rebound into late March. Both drift sideways in mid-year, then climb from September into November. The shapes match because the rand is half the basket. The size differs, though. USD/ZAR runs from above 17.4 to below 15.7, while USD/BWP mostly stays between 12.6 and 13.5.
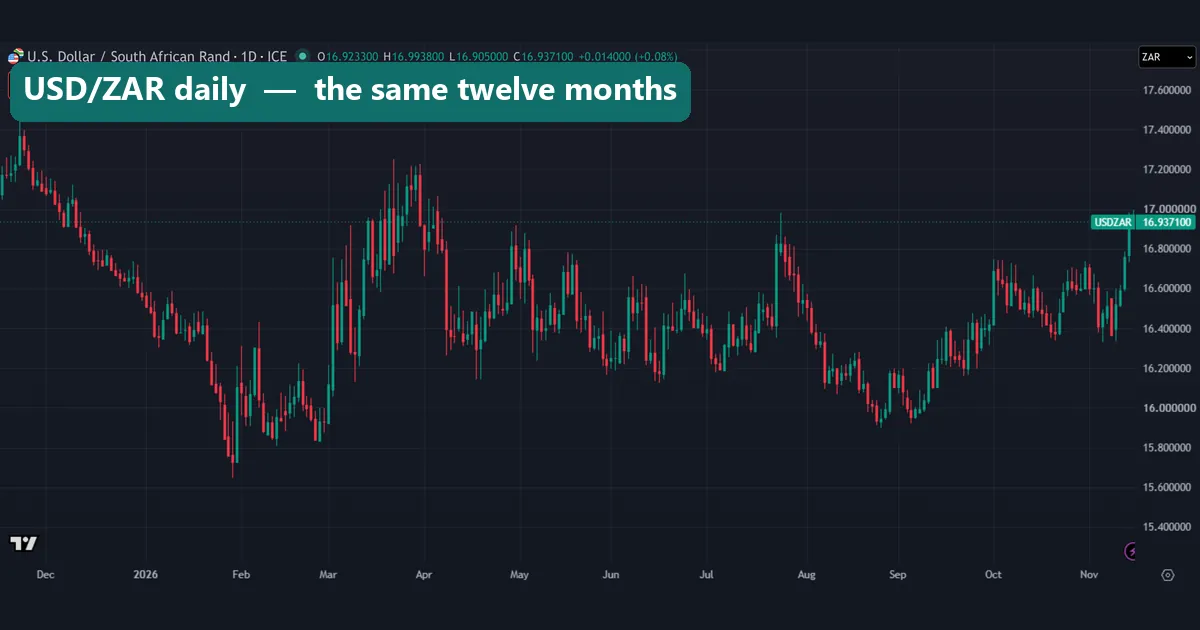
That gap in size is the basket at work, since the SDR half absorbs part of each rand move. Read together, USD/BWP looks like a damped copy of USD/ZAR. Our forex correlation matrix shows how other pairs line up. One caution: the last USD/BWP point is the 16 November bar, still forming when we captured it.
Common mistakes with the pula
Reading a rising line as a stronger pula. USD/BWP counts pula per dollar, so a climb means each pula buys less.
Treating every tall bar as a market event. The 1998 and 2004 jumps both follow gaps in the feed. Check the prints before a big bar, and the Bank’s dates, before you call it a crash.
Assuming a fixed peg. Some currencies hold one fixed rate, like the lev in our BGN currency guide. The pula does not. Its basket value crawls, and its dollar rate floats with the rand and the SDR.
Expecting to see the crawl day to day. A crawl of -2.76% a year comes to about a hundredth of a percent a day. Our median daily move is 0.33%, so the crawl hides in the noise and shows only over months.
Where to go next
Our guide to African currencies sets the pula beside its neighbours. Two single-currency guides take other paths: the Ghanaian cedi and the Egyptian pound. For the extremes, compare the weakest currency in the world with the most valuable currency in the world.
On method, our guide to line charts in forex explains closes-only charts, and our TradingView chart walkthrough covers the controls. When the whole dollar moves, the dollar index guide helps. For policy changes, return to the Bank of Botswana’s framework page above, which lists every crawl rate since June 2005.
FAQ: BWP Botswana and the pula
What does BWP stand for?
BWP is the ISO code for the Botswana pula, which splits into 100 thebe.
Is the pula tied to the US dollar?
No. It follows a basket of the rand and the IMF’s SDR, and the basket value crawls. Its dollar rate floats with those two parts.
Why does USD/BWP move with USD/ZAR?
The rand makes up half the basket, per the August 2026 Daily News report. In our 2020 to 2026 data, weekly changes in the two pairs had a correlation of 0.81.
What was the weakest pula rate in your data?
The weakest close was 14.1804 pula per dollar on 9 April 2025.
Did Botswana devalue the pula?
Yes. The Bank of Botswana lists 7.5% in February 2004 and 12% in May 2005. Our feed shows the second on 30 May 2005, a jump of 12.73% in one print.
How fast does the crawl move?
The Bank lists -2.76% a year from July 2025. It reviews the rate twice a year, so check its page for the current figure.
Why do some old USD/BWP bars look flat?
The feed stalls at times. Our longest quiet stretch ran 31 days, from 21 February to 3 April 2008, between 6.5116 and 6.5424.
Will the pula keep falling against the dollar?
We do not forecast it. The pula fell in 19 of 28 full years, and the crawl points down, but policy and the rand can turn. Read the data as history: results are not guaranteed; past performance is not indicative of future results.
Last updated: 16 November 2026.

About the author
Written by Dominic Walsh, a Forex trader and MT4/MT5 indicator, Expert Advisor and script developer. Every tool on forexmt4systems.com is tested on live charts before release and ships with ready-to-use compiled MT4 (.ex4) and MT5 (.ex5) files. Learn more about the trader and developer behind this site.
How we build, test and correct every tool: Editorial & Testing Policy. Trading carries risk; see the disclaimer.