
ICC vs ICT trading is a question about two very different things: ICC is a three-step entry pattern, while ICT is a whole vocabulary of price ideas. ICC stands for indication, correction, continuation. ICT stands for the Inner Circle Trader concepts, such as fair value gaps, liquidity and order blocks. This guide settles what each one is, where they overlap, and what happened when we coded ICC as a strict rule and ran it on 23 daily FX pairs. The short answer: it lost 30.7R over 843 trades before costs.
What ICC actually is
ICC is a retail framework for trading with a trend after it shows its hand. First comes the indication: price breaks a recent swing high or swing low. Next comes the correction: price pulls back against that break. Finally comes the continuation: price resumes in the direction of the break, and that is where the entry sits.
ICC is not an indicator; instead, it is a way to sequence a trade. It says “wait for proof, wait for a pullback, then join the move”. Most of its parts are old. For example, the idea of a primary move, a reaction and a resumption goes back to Dow Theory at StockCharts ChartSchool. ICC gives those steps short names and a fixed order.
Traders describe ICC loosely. Some want the correction to touch a fair value gap, so we had to pin the rule down before testing it.
ICC vs ICT trading: the core difference
ICT is broader. It is the teaching brand of Michael J. Huddleston, and it covers many named ideas. Our glossary of ICT terms lists them in one place, and the overview of what ICT trading is explains the origin. In short, ICT tries to explain why price moves: it looks for resting stop orders, imbalances and time windows.
By contrast, ICC only describes what the swing sequence looks like. It does not care about liquidity pools or kill zones. That makes ICC easier to learn and to test.
The two overlap in one spot. An ICT “break of structure” is close to an ICC indication. Likewise, an ICT entry on a pullback into a fair value gap or an optimal trade entry zone looks a lot like an ICC correction. Many traders blend them: ICT for context, ICC for timing. However, blending does not make either one work on its own, as our numbers show below.
How ICC works, step by step
First, define a swing. We used an 11-bar swing: a high with no higher high within 5 bars on each side. It is a wider version of a Bill Williams fractal (two bars on each side), which the iFractals reference in the MQL5 documentation describes. A swing only counts once the five bars after it have closed.
Next, the indication. For a long setup, a daily candle has to close above the last confirmed swing high. Then the correction. Price has to pull back at least 38.2% of the move, but it must not break the opposite swing low. The depth formula is simple:
depth = (indication high - correction low) / (indication high - move origin low)
A correction counts when depth is 0.382 or more. Also, Fibonacci retracement on Wikipedia explains where the 38.2% level comes from. Finally, the continuation. Price has to close back above the indication high within 15 bars. When it does, the trade opens at the next bar’s open.
For risk, the stop sits 0.1 ATR beyond the correction extreme. The target is 2R, so the reward is twice the distance from entry to stop. If neither level is hit within 20 bars, the trade closes at the time exit. Shorts mirror every step.
How we tested
We wrote the rule above as code and ran it on MetaTrader 4 history. The data came from a Capital Point Trading terminal, MetaTrader 4, build 1471. It covered 23 FX pairs on the daily chart, from 12 June 2018 to 24 August 2026. Every result is in R and is measured before spread, swap and commission.
We then drew the steps on a TradingView web chart with OANDA data. The shots come from 7 and 8 October 2026. They show EURUSD, GBPUSD and GBPJPY on the daily chart, plus USDJPY and AUDUSD on the 1-hour chart. All times in the text are UTC.
For the ICT side, we did not test one full ICT model. Instead, we reuse our earlier measurements of single ICT ideas: fair value gaps, daily high and low sweeps, and a similar pullback rule. Our method and limits follow the editorial testing policy.
The ICC settings we used
These are the exact parameters behind every number on this page.
| Step | Our rule | Closest ICT idea |
|---|---|---|
| Swing point | 11-bar swing high or low (5 bars on each side), confirmed | Swing high / swing low |
| Indication | Daily close through the last confirmed swing | Break of structure |
| Correction depth | At least 38.2% of the move | Discount or premium pullback |
| Correction limit | Must not break the opposite swing | Structure stays intact |
| Time window | 15 bars for correction and continuation | No fixed window |
| Continuation | Close beyond the indication extreme | Displacement after the pullback |
| Entry | Next bar’s open | Often a gap or block retest |
| Stop | 0.1 ATR beyond the correction extreme | Beyond the swing |
| Target and exit | 2R, or a 20-bar time exit | Opposing liquidity |
The right column is only a rough match. ICT teachers rarely give fixed numbers, so there is no single ICT setting to copy.
Reading ICC on a chart
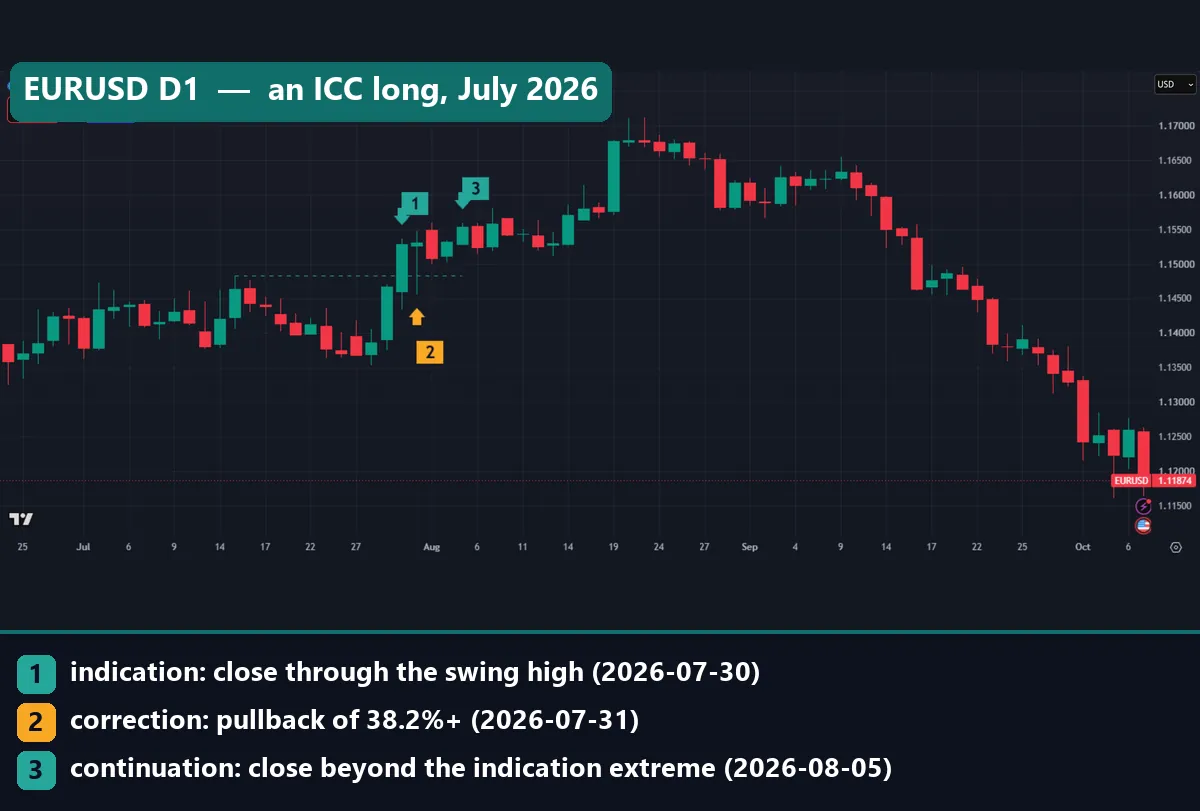
On each chart, marker 1 is the indication, marker 2 is the correction and marker 3 is the continuation. The dashed line is the swing level that price broke.
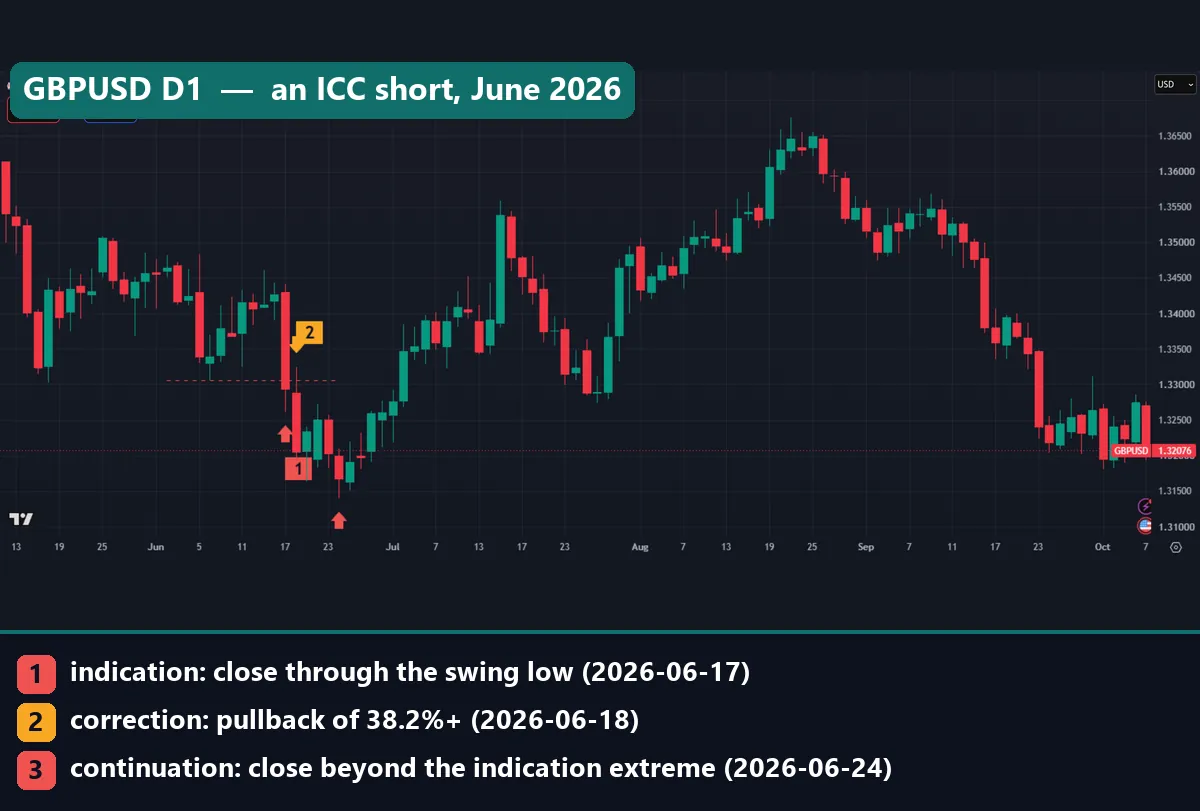
The GBPUSD daily chart shows a short setup. The dashed red line sits at 1.3306. On 17 June 2026 a daily candle closed below it, which is the indication. On 18 June price bounced, and that was the correction. Then on 24 June a candle closed below the indication low, which completed the continuation.
Still, look at what came next on the same chart. Price made one more low in late June, then turned and climbed above 1.35000 by mid-July. So a clean ICC short does not mean the trend keeps going for long.
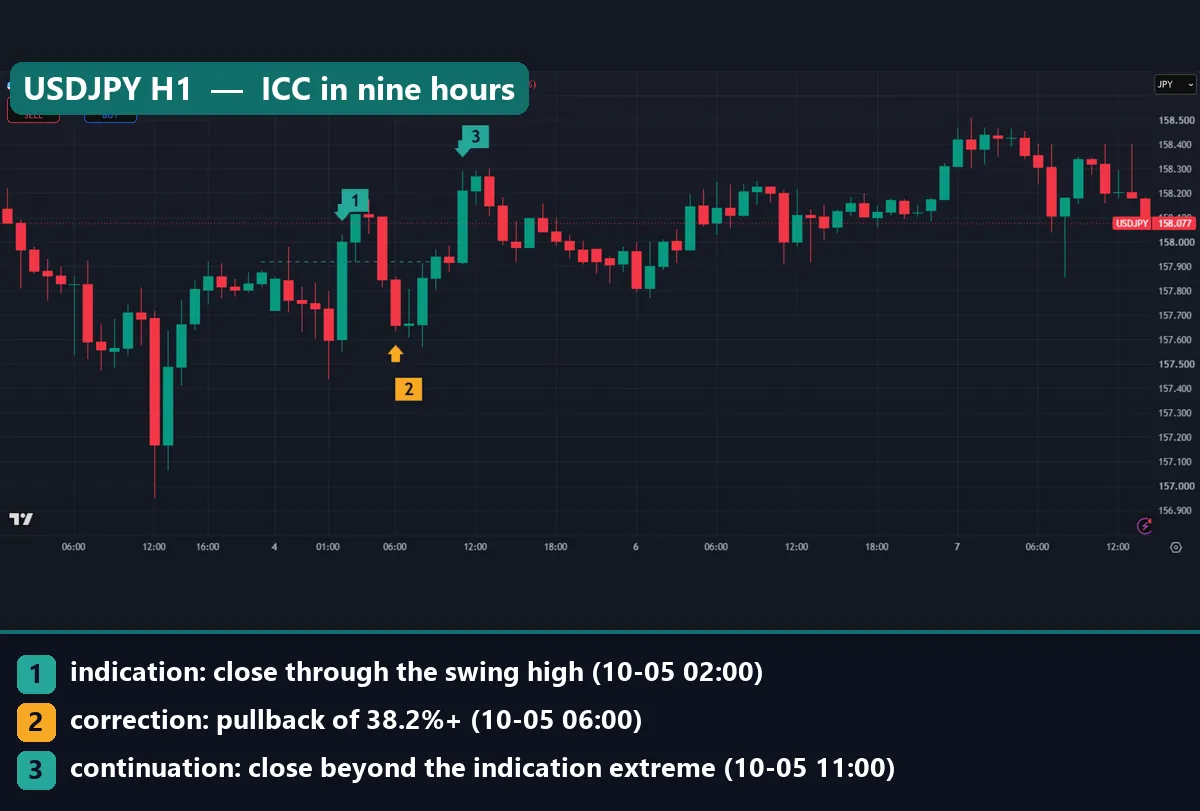
The USDJPY 1-hour chart shows the same three steps on a fast timeframe. Here the dashed line is 157.92. The indication closed at 02:00 on 5 October, the correction printed at 06:00, and the continuation closed at 11:00. That whole sequence took nine hours. On lower timeframes, a 38.2% pullback can be only a few candles.
Worked example: EURUSD daily, July to August 2026
Go back to the first chart. The dashed green line marks a swing high at 1.14824 from mid-July. On 30 July 2026 a daily candle closed above it. That is the indication. On 31 July price dipped, leaving a long lower wick, and the pullback reached at least 38.2% of the move. That is the correction. Then on 5 August a candle closed above the indication high. That is the continuation.
Under our rule, the trade opens at the next day’s open. The stop goes 0.1 ATR below the 31 July low. The target sits at twice that distance above the entry.
We do not have the fill-by-fill record for this one trade, so we will not claim its outcome. What the chart does show is the path. Price traded up near 1.17000 around 19 to 21 August, then fell. By 7 October it closed at 1.11874, well below the broken level. In other words, the setup marked a real swing, but the move it joined did not last.
The data also flagged two short setups on EURUSD daily in June, on 5 June and 12 June. Both used the same broken level, 1.15763. So one swing break can produce more than one indication, and a trader has to decide which one counts.
What 843 ICC trades showed
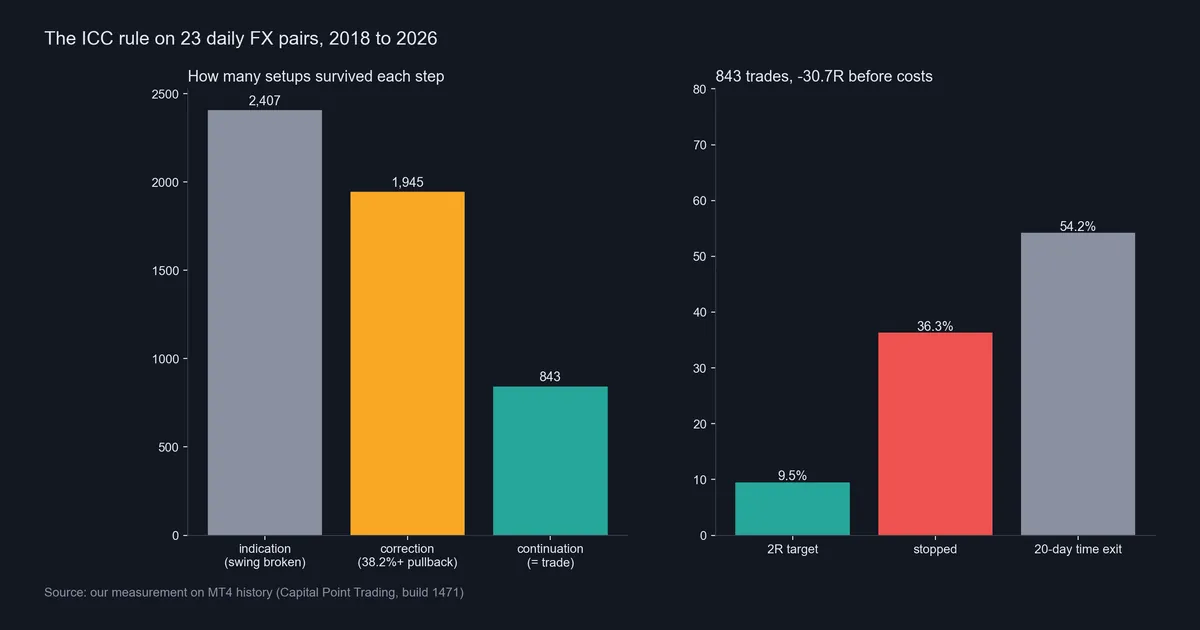
Across 23 pairs, the rule found 2,407 indications. Of those, 1,945 got a valid correction. Only 843 reached a continuation and became trades. In short, roughly one swing break in three turned into an entry.
The results were weak. Just 9.5% of trades hit the 2R target. Another 36.3% hit the stop. The other 54.2% ran out of time and closed at the 20-day exit. Overall, the rule lost 30.7R before costs. That is about minus 0.04R per trade, and costs would push it lower. The expectancy entry at BabyPips explains why a small negative number per trade adds up over time.
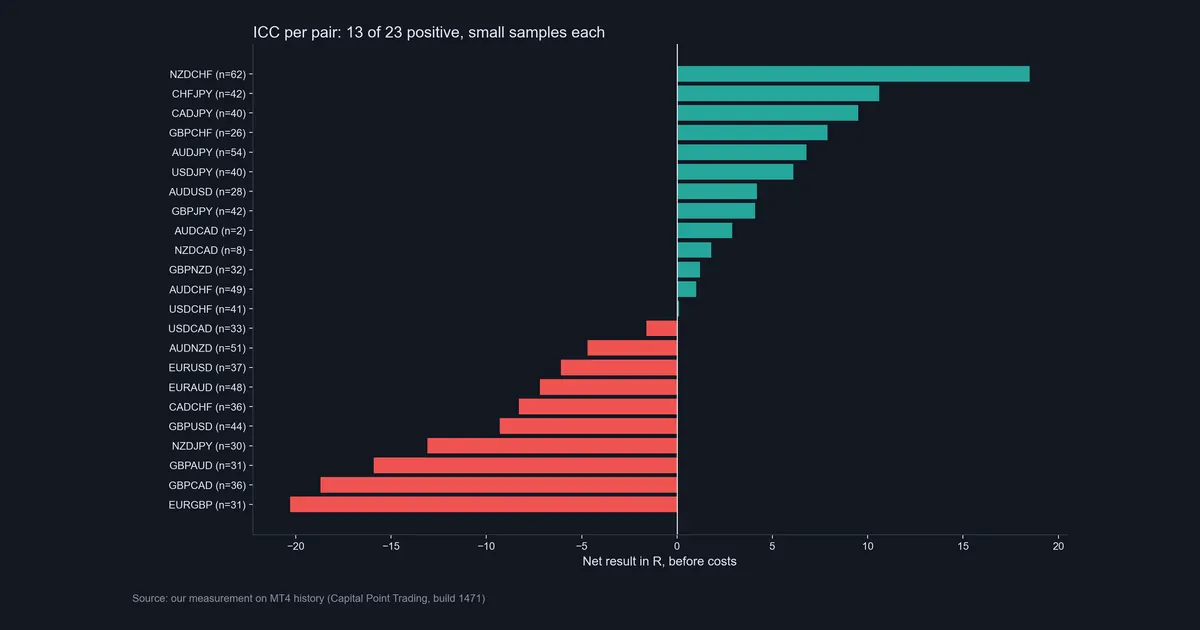
By pair, 13 of the 23 finished positive. NZDCHF was best at +18.5R over 62 trades. EURGBP was worst at -20.3R over 31 trades. However, these per-pair samples are small. AUDCAD had only 2 trades and NZDCAD had 8. With so few trades, a pair’s sign tells you little.
Download the complete indicator database
Put these concepts on your charts. One email unlocks the full library of 1,380+ indicators with compiled MT4 and MT5 files, plus my TradingView scripts. No paywall, no spam, unsubscribe any time.
Get free access to my indicator database
One email unlocks 1,380+ free MT4, MT5 and TradingView indicators — the complete library. No single-tool download; you get the whole database.
How the ICT ideas we measured compare
This is not a like-for-like contest. Still, our earlier tests show how often some ICT events happen.
- Fair value gaps. On the same 23 daily pairs we found 5,361 gaps. Within 20 bars, 78.7% reached the midpoint and 72.7% filled completely. Our guide to FVG meaning in trading has the rule.
- Daily sweeps. On EURUSD 15-minute data, over 297 days, price took the previous day’s high on 45.5% of days and the low on 52.2%. Our liquidity in trading guide covers it.
- A close cousin. Our trend pullback strategy test also joins a trend after a pullback. It lost 20.1R over 1,737 trades before costs.
Gaps fill often and sweeps are common, but an event that happens most days is expected, not a signal. Both ICC and the pullback rule show that “join the trend after a dip” is not enough by itself on daily FX.
Where it fails
ICC fails in five plain ways. First, it is late by design. You wait for a break, a pullback and a second break. By the continuation close, much of the move can be over.
Second, the 2R target rarely arrived. Only 9.5% of our trades reached it. More than half simply stalled until the time exit.
Third, the framework is loose. “Correction” has no fixed depth in most ICC teaching, so two traders can mark the same chart in two ways. We chose 38.2% and 15 bars. Other choices would give other numbers.
Fourth, the labels are easy to draw in hindsight. On a finished chart, every clean trend shows an indication, a correction and a continuation. Live, you do not know which swing break is real.
Finally, our test has limits of its own. It used daily data only, one broker feed and no costs.
Two more ICC setups, read with hindsight
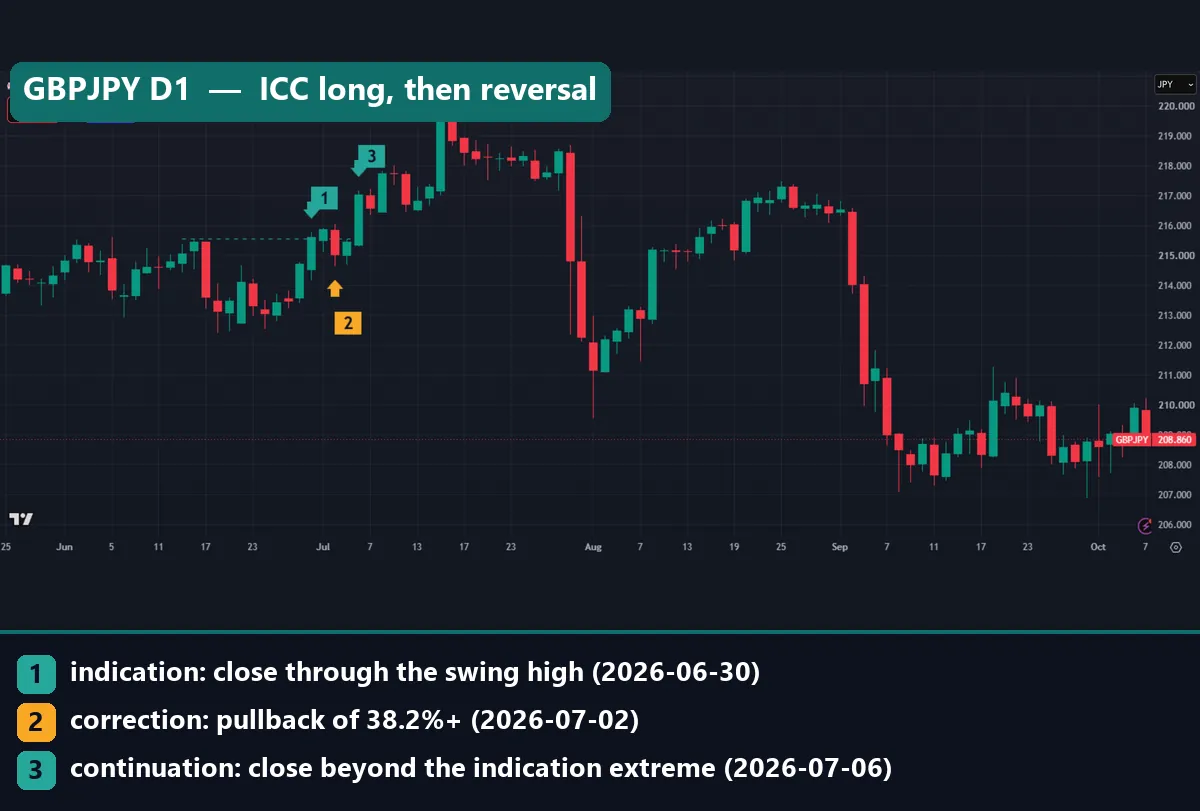
On GBPJPY daily, the dashed level sits at 215.566. The indication closed on 30 June 2026, the correction came on 2 July, and the continuation closed on 6 July. Afterwards, price pushed close to 219.50 by mid-July. Then, in late July, a run of long red candles took it back below 212.00. So the same chart holds a good-looking ICC long and a sharp reversal a few weeks later.
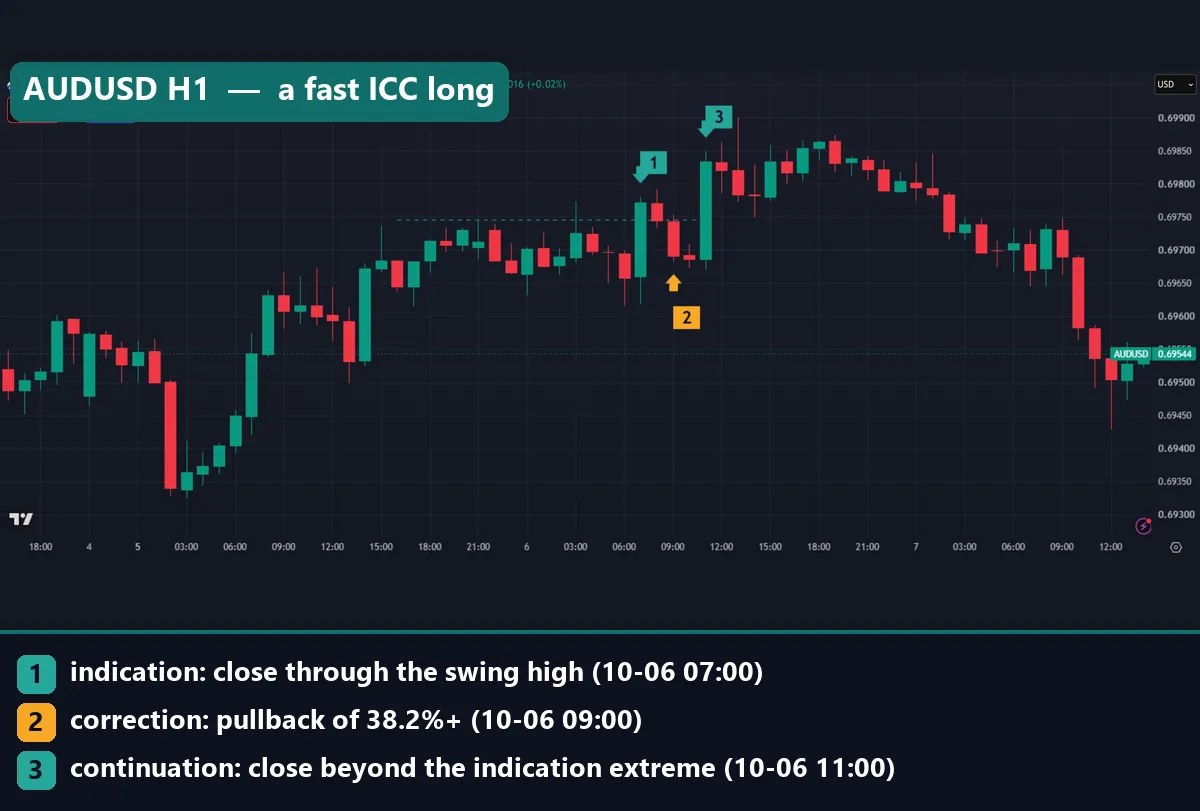
The AUDUSD 1-hour chart is a quicker case. The level is 0.69746. The indication closed at 07:00 on 6 October, the correction at 09:00 and the continuation at 11:00. Yet by 7 October price had slipped back under 0.69600. Our data also shows two AUDUSD hourly indications on 2 October, at 03:00 and 06:00, that shared one continuation bar at 13:00. Again, the steps are clear only after they finish.
Common mistakes with ICC and ICT
- Counting a wick as an indication. A wick through a swing is not a close through it. Wait for the close.
- Calling any dip a correction. If you skip a minimum depth, every small pause becomes a setup. As a result, you take far more trades than the rule allows.
- Stacking ICT labels to feel sure. Adding a gap, a sweep and a kill zone to an ICC setup can feel like confirmation. But each extra label is another choice made after the fact.
- Trusting a few winning pairs. Thirteen pairs ended positive in our test, mostly on small samples. Choosing them now and trading only those is a classic way to fool yourself.
Where to go next
For structure breaks, start with BOS vs CHoCH and our page on market structure in forex. For the pullback side, read how to use Fibonacci retracement. For gap midpoints, see what CE means in ICT.
If you prefer tools, our break of structure indicator marks swing breaks on MT4 and MT5. Also, the ICT market structure indicator draws swings and shifts. For one more honest test of an ICT idea, read our breakaway gap ICT guide.
FAQ: ICC vs ICT trading
What does ICC stand for in trading?
ICC stands for indication, correction, continuation: a swing break, a pullback, then a break beyond the first move’s extreme.
Is ICC part of ICT?
No, ICC is a separate retail framework, but its indication looks like an ICT break of structure, so many traders mix the two.
Did ICC make money in your test?
No, our strict ICC rule lost 30.7R over 843 daily trades on 23 FX pairs from 2018 to 2026, and that was before costs.
How deep should an ICC correction be?
There is no agreed depth, so we used at least 38.2% of the move without breaking the opposite swing, and other depths will give other results.
Which timeframe suits ICC best?
We only measured the daily chart, so we cannot rank timeframes; the hourly charts on this page show the shape, not tested results.
Why did so few trades hit the 2R target?
Only 9.5% reached 2R because price often stalled after the continuation, and 54.2% of trades closed at the 20-day time exit instead.
Can I add ICT filters to improve ICC?
You can test it, but every added filter is another choice, so judge it on fresh data, not on the charts you used to build it.
Should I trade ICC or ICT?
ICC showed no edge in our daily FX data, and we have not tested a full ICT model, so treat both as ways to describe price and test any rule before you risk money; results are not guaranteed; past performance is not indicative of future results.
Last updated: 8 October 2026.

About the author
Written by Dominic Walsh, a Forex trader and MT4/MT5 indicator, Expert Advisor and script developer. Every tool on forexmt4systems.com is tested on live charts before release and ships with ready-to-use compiled MT4 (.ex4) and MT5 (.ex5) files. Learn more about the trader and developer behind this site.
How we build, test and correct every tool: Editorial & Testing Policy. Trading carries risk; see the disclaimer.