
A key level is a price where traders expect the market to react, so they place orders there and watch it closely. This guide settles three things: what counts as a key level, how to read one on a chart, and whether round numbers like 1.1200 really hold better than other prices. We measured that last question on four markets, and the answer is less flattering than most trading courses suggest.
What a key level is
A key level is a horizontal price that has mattered before or that many traders agree to watch. It is not a magic line. Instead, it is a place where buy and sell orders tend to gather, so price often slows, stalls or turns there.
Most traders treat key levels as the bones of support and resistance. A level below price acts as support. A level above price acts as resistance. Once price closes clearly through a level, the roles often swap, so old support becomes new resistance.
The word “key” claims the level matters more than the prices around it. We test that claim below.
Types of key level traders mark
Traders use the term for several different things. Here are the common ones, with the reason each one gets attention:
- Prior swing highs and lows. These are the turning points of past moves. Stop orders often sit just beyond them, which is the basis of most liquidity pool ideas.
- Round numbers. Prices ending in 00 or 50, such as 1.3200 or 158.00, are also called psychological levels. People like tidy numbers for take-profits and limit orders.
- The daily, weekly and monthly open. Many intraday traders judge the session by whether price trades above or below the open. Our daily open indicator draws that line on MT4 and MT5.
- Pivot points. These come from a formula on the prior day’s high, low and close. See pivot points explained for the math.
- Previous day and session highs and lows. These are the edges of recent ranges, and trading sessions often open by testing them.
Supply and demand zones are bands rather than single lines. Our page on support and resistance vs supply and demand covers that split.
How a key level works
The mechanism is simple. Orders cluster at prices people can see and agree on. Limit orders sit at a level and absorb the first push into it. Stop orders sit just beyond it and add fuel once price breaks through. So a level can produce a bounce or a fast break, and both come from the same cluster.
Research backs the clustering part. Carol Osler studied this at the New York Fed, and her paper Support for Resistance on the Federal Reserve Bank of New York site tested published support and resistance levels on intraday exchange rates. The psychological level entry on Wikipedia gives the general idea behind round numbers.
To test any of this you need a clear rule for a “touch” and a “hold”. Ours uses ATR, the average true range over 14 bars, so the rule scales with volatility:
touch = bar range includes level L, and the prior close sat at least 0.2 x ATR awayhold = within 12 bars, price moves 0.5 x ATR away from L on the arrival side before any close 0.5 x ATR through L
The ATR help page in TradingView’s docs explains the volatility measure we used.
How we tested key levels
We focused on round numbers, because they are the one type of key level that every trader draws in the same place. Prior highs and pivots depend on choices. A round number does not.
First, we read H1 history from MetaTrader 4, build 1471, on the Capital Point Trading terminal. The windows were EURUSD from 22 December 2025 to 26 August 2026, GBPUSD and USDJPY from 22 December 2025 to 13 August 2026, and XAUUSD from 1 July 2025 to 20 August 2026. Next, we placed a grid every 50 pips on the currency pairs and every $10 on gold.
Then came the control. We shifted the same grid off the round numbers by 10, 20, 30 and 40 pips (gold: $2, $4, $6 and $8). If round numbers are special, the true 00 and 50 lines should hold more often than the shifted lines. All results are raw price behaviour, before spread, swap and commission.
The chart examples come from the TradingView web chart with OANDA data, H1, captured on 9 October 2026 for the window 6 to 9 October 2026. Our method rules are on the editorial testing policy page.
Test parameters
These are the settings behind every number in this guide. If you rebuild the test, change one at a time.
| Parameter | Value we used | Why it matters |
|---|---|---|
| Timeframe | H1 | Enough touches per level to count |
| Grid step | 50 pips (gold $10) | Matches the 00 and 50 levels people draw |
| Control shifts | 10, 20, 30, 40 pips (gold $2 to $8) | Same spacing, but not round |
| Arrival filter | Prior close at least 0.2 ATR away | Stops one level counting the same bar twice |
| Hold test | 0.5 ATR bounce before a 0.5 ATR close through | Defines success and failure |
| Time limit | 12 bars | Half a trading day on H1 |
| ATR length | 14 bars | Scales the rule to each market |
Reading a key level on a chart
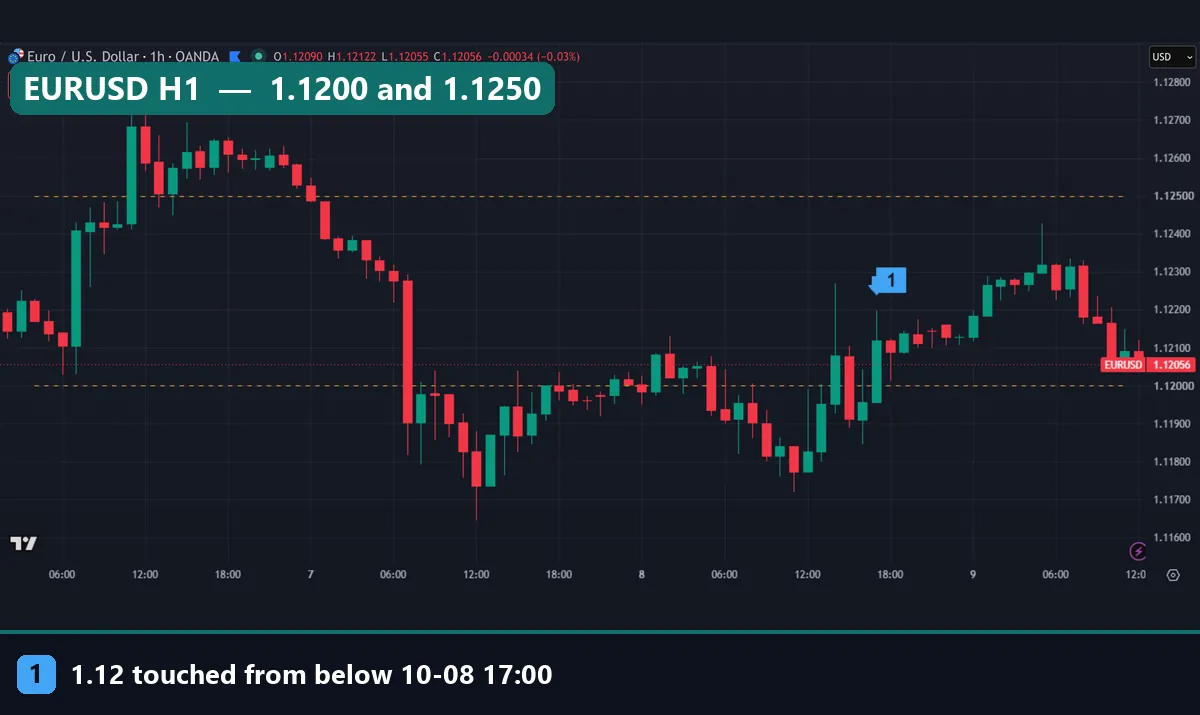
Start by drawing only a few lines. On the charts below, the yellow dashed lines are the 00 and 50 levels, and the blue markers show bars that touched one.
In the first chart, EURUSD spent most of 8 October trading around 1.1200. Our touch log lists six H1 bars that touched it between 08:00 and 17:00 UTC: five came from below and one from above. That back and forth is normal. A level rarely gets one clean touch.
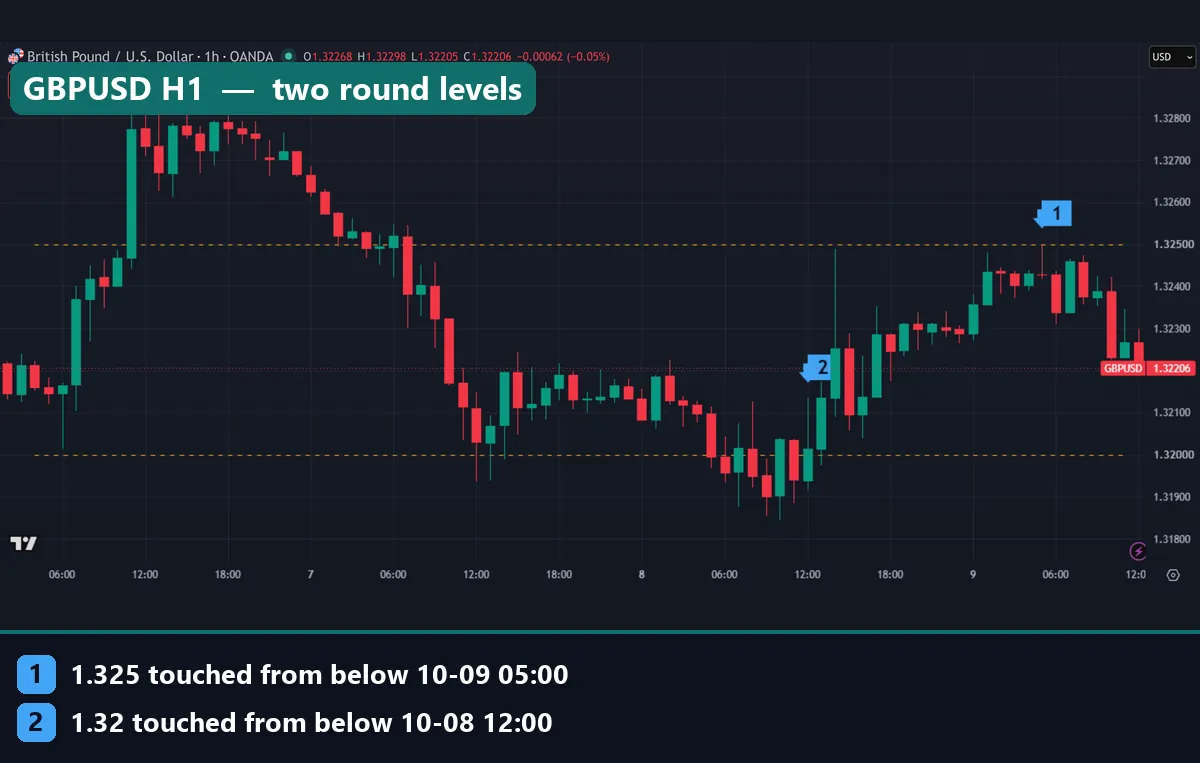
The GBPUSD chart shows two touches from below. Marker 2 is the 1.3200 test at 12:00 UTC on 8 October, after price had dipped under the line that morning. Marker 1 is the 1.3250 test at 05:00 UTC on 9 October. There a wick reached the line and price fell back. So one level got crossed both ways, and the other one capped the move for now.
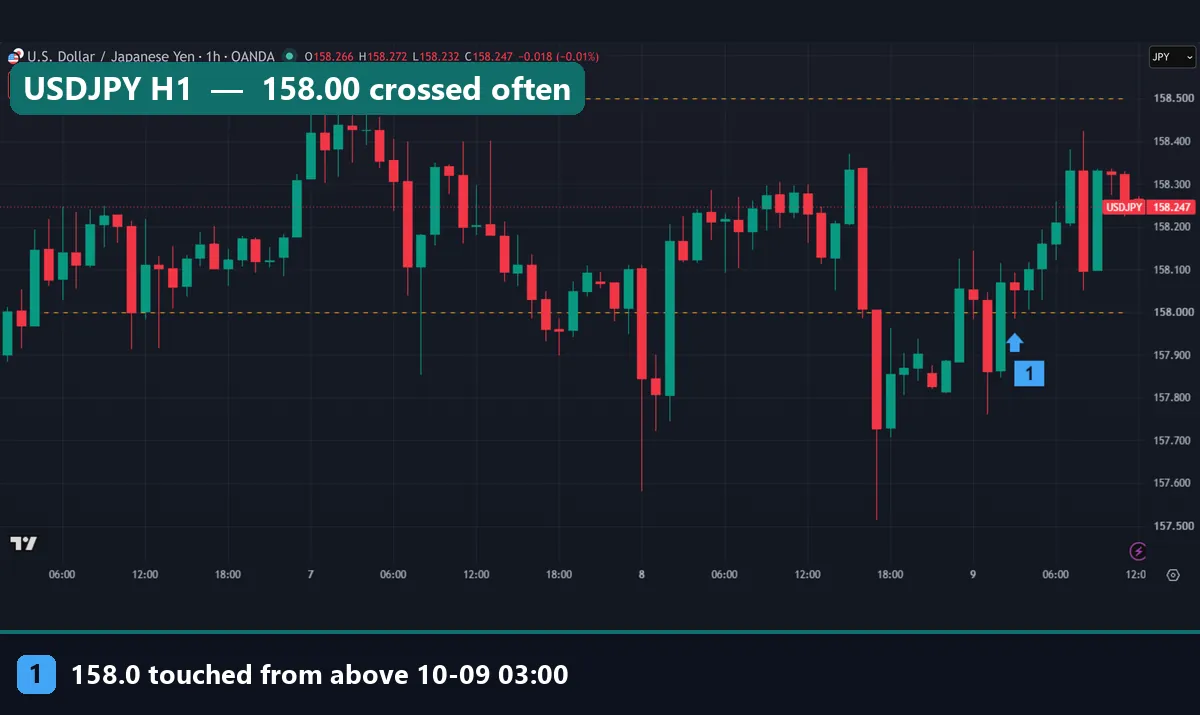
USDJPY tells a messier story. Price crossed 158.00 again and again across the window, and marker 1 shows one more test from above at 03:00 UTC on 9 October. Meanwhile 158.50 was reached only once, by a wick on 7 October that topped out at 158.51, and price turned lower from there. In short, the busy line did little work as a barrier, while the quiet line looked more important.
Worked example: does a key level at 00 or 50 hold better?
Each line shows the round grid first, then the average of the four shifted grids.
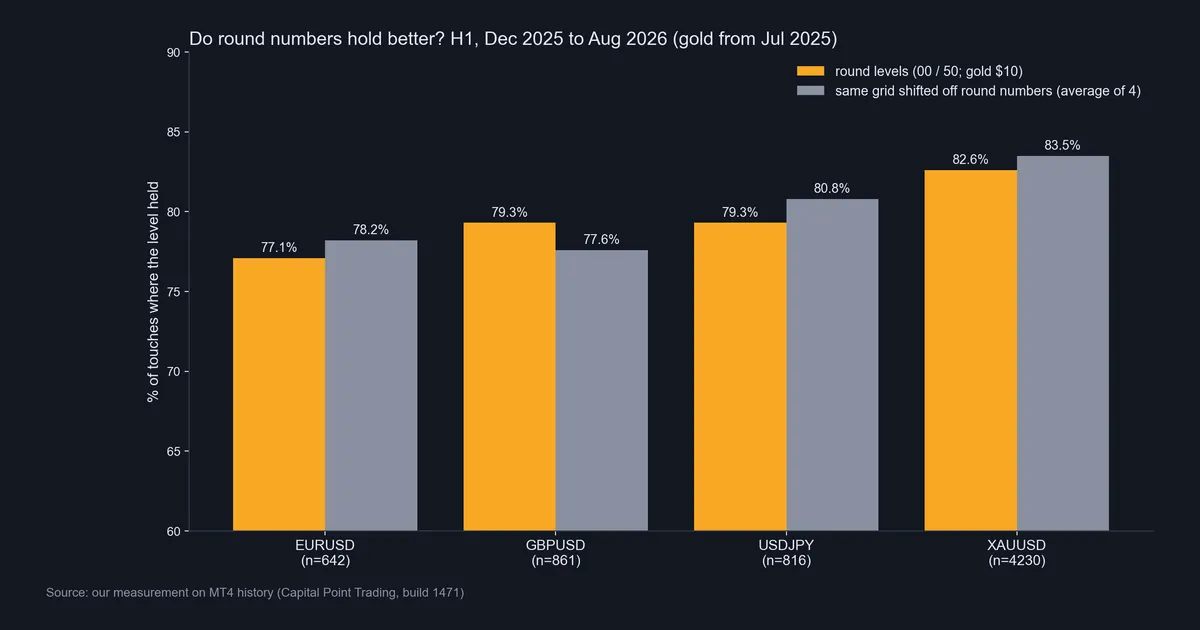
- EURUSD: 642 touches of round levels, 77.1% held. Shifted grids averaged 78.2%.
- GBPUSD: 861 touches, 79.3% held. Shifted grids averaged 77.6%.
- USDJPY: 816 touches, 79.3% held. Shifted grids averaged 80.8%.
- XAUUSD: 4,230 touches, 82.6% held. Shifted grids averaged 83.5%.
So round numbers did slightly worse than shifted lines on EURUSD, USDJPY and gold. Only GBPUSD came out slightly better. Also, one EURUSD control grid, shifted 20 pips, held 81.8% of the time, which beats every round result on the pairs.
Almost every line, round or not, “held” about four times in five. That is the real lesson. A bounce only needs a wick to reach 0.5 ATR, while a break needs a close, so the rule favours holding. Under that test, a line drawn anywhere looks like a key level.
Gold: a key level every $10
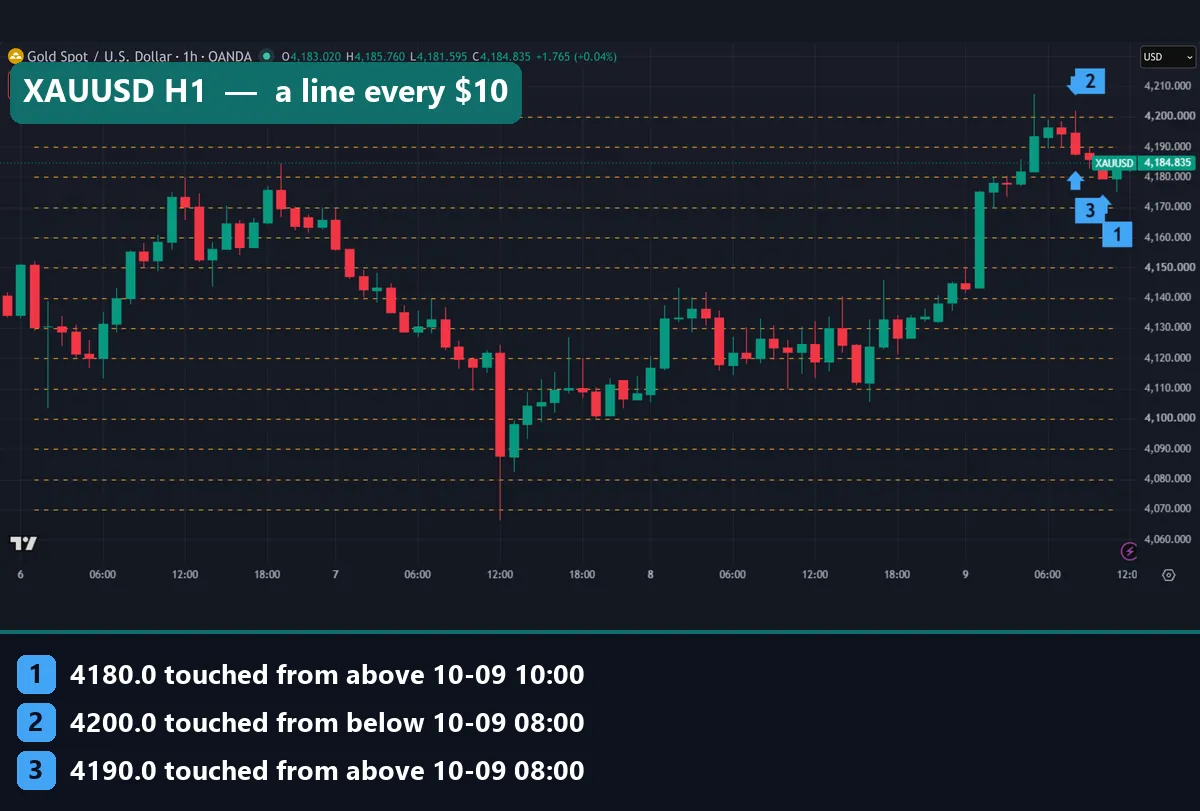
Gold shows it on a chart. With a $10 grid, there is a line almost everywhere. On 9 October, marker 2 shows 4200 touched from below at 08:00 UTC, marker 3 shows 4190 touched from above in the same hour, and marker 1 shows 4180 touched from above at 10:00 UTC. Three levels in three hours means none told you much alone.
Download the complete indicator database
Put these concepts on your charts. One email unlocks the full library of 1,380+ indicators with compiled MT4 and MT5 files, plus my TradingView scripts. No paywall, no spam, unsubscribe any time.
Get free access to my indicator database
One email unlocks 1,380+ free MT4, MT5 and TradingView indicators — the complete library. No single-tool download; you get the whole database.
Where it fails
Key levels fail in a few plain ways, and our test shows most of them.
First, round numbers had no measurable edge. Across four markets, the 00 and 50 lines held about as often as lines shifted 10 to 40 pips away. If you trade a bounce at 1.3200 because it is round, our data says the roundness adds nothing you can count on.
Second, the “hold” figure flatters every line. Most touches are followed by some move away, simply because price wiggles. That makes an 80% hold rate look strong when it is close to what a random line gets.
Third, a level can only be judged after the fact. On the chart you see where price turned. But in real time, the same line might get crossed five times before the turn, as it did on EURUSD and USDJPY in our window.
Fourth, the test ignores costs. Spread and swap are not included, so a small bounce that clears 0.5 ATR on the chart can shrink a lot in a live account. Finally, our sample covers one broker feed and a limited window. Other periods may differ.
Why a key level looks stronger than it is
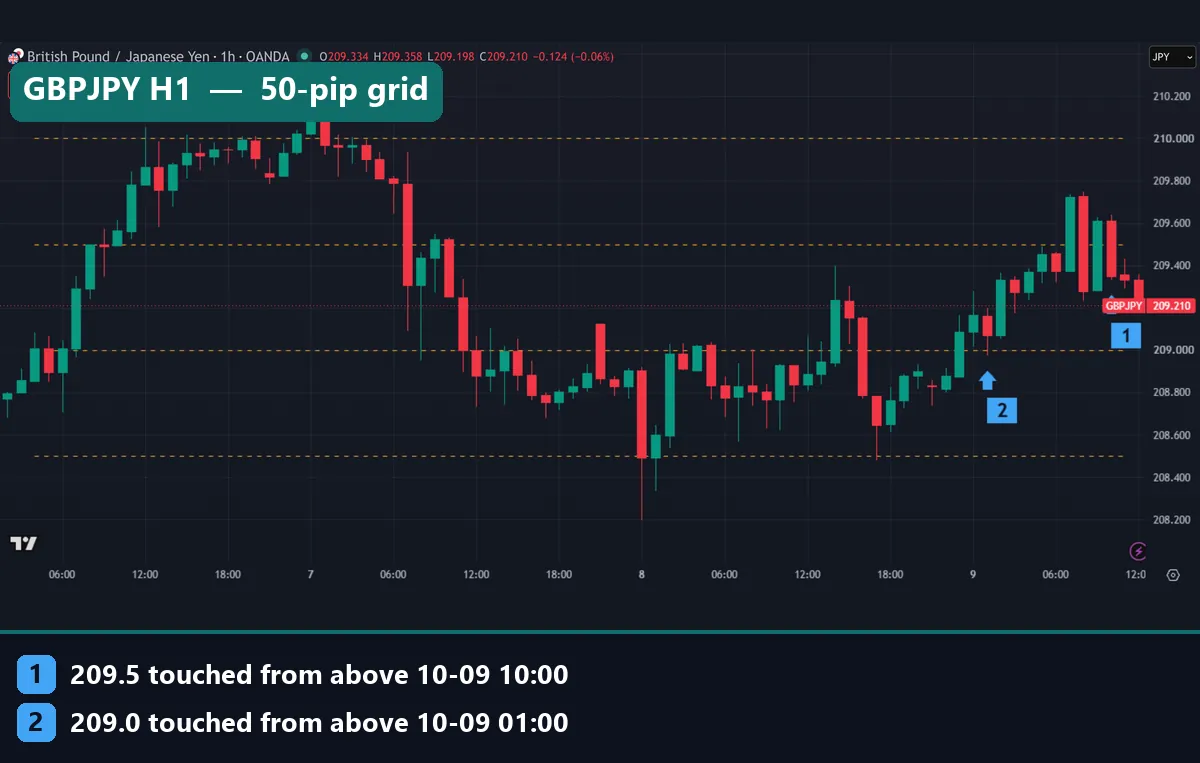
The next two charts show how a level can fool the eye. On GBPJPY the grid lines are 50 pips apart, at 208.50, 209.00, 209.50 and 210.00. Marker 2 shows 209.00 touched from above at 01:00 UTC on 9 October. Marker 1 shows 209.50 touched from above at 10:00 UTC. Between those two hours, the touch log shows 209.50 tested from both sides.
AUDUSD is the clearest case. Our touch log has six touches of 0.6950 on 8 October, between 05:00 and 16:00 UTC. They alternate from above and below. Marker 1 is the last one, from below at 16:00. Then price drifted higher and reached the 0.6980 area on 9 October. Looking back, 0.6950 seems like the floor that launched a rally. However, during the day it was a line that price kept crossing.
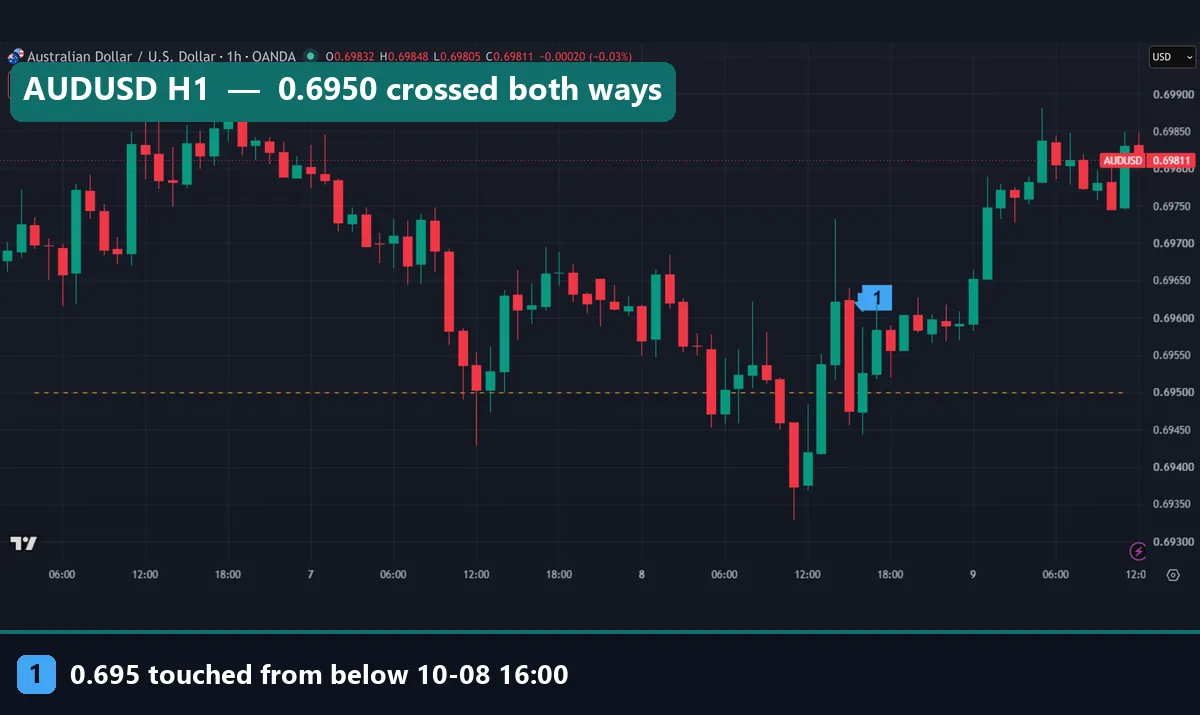
This is hindsight at work. Also, the brain looks for neat stories, a habit our guide on confirmation bias in trading covers in detail.
Common mistakes with a key level
- Drawing too many lines. If every 20 pips has a line, price will always be “at a key level”. Keep two or three per chart, and pick the ones price has actually reacted to.
- Treating a round number as special. Our test found no edge for 00 and 50 lines over shifted lines. Use them as reference points, not as reasons to trade.
- Putting the stop right at the line. Stops cluster just beyond obvious levels, and that is where stop hunting talk comes from. Size the distance from volatility instead, as our guide on ATR stop-loss distance shows.
- Trading the first touch blind. A touch is not a signal. Wait for price to show a reaction, then decide. The break and retest strategy is one way to add that step.
How to use a key level without fooling yourself
Use a key level to plan, not to predict. For example, mark the prior day high and low, the daily open and the nearest round number. Then ask what you will do if price rejects the level, and what you will do if it closes through.
Next, pair the level with something that can be checked. Candlestick reactions are one option, and our page on candlestick patterns at support and resistance covers the common ones. Trend direction is another, since a level against the trend tends to give way.
Also, test your own levels before trusting them. Pick a rule, then compare your lines against lines drawn somewhere else. If your levels do no better, they are not adding anything. Finally, set risk first, using our guide on how to use a stop loss.
Where to go next
If you want to go further, these pages build on this one:
- How to use pivot points for formula-based levels.
- How to use trend lines when levels slope.
- Market structure in forex for picking which swing highs count.
- Our support and resistance line indicator for MT4 and MT5 (compiled files only).
For outside reading, the support and resistance lesson at StockCharts ChartSchool is a clear primer. Osler’s New York Fed paper, linked above, is the best source on why orders gather near levels.
FAQ: key level questions
What is a key level in trading?
It is a horizontal price that traders watch. Price reacted there before, or it is easy to agree on, such as a round number, a prior high or low, or the daily open.
Are round numbers key levels?
Traders treat them that way. But in our H1 test, the 00 and 50 levels held about as often as the same grid shifted off the round numbers. On EURUSD, USDJPY and gold they held slightly less often.
How many key levels should I draw?
Keep it to two or three per chart. With too many lines, price is always near one, so none of them tells you anything.
What timeframe is best for key levels?
More traders watch levels from the daily and H4 charts, so many people mark them there and trade on H1 or lower. Still, we only measured H1 in this guide.
Does a key level work on gold?
On XAUUSD our $10 grid had 4,230 touches and held 82.6% of the time. The shifted grids averaged 83.5%, so round gold prices showed no extra edge.
What does it mean when a level breaks?
A clear close through the level suggests the market absorbed the orders there. The old level may then act from the other side, but that flip still needs a retest.
Is volume useful for judging a key level?
Forex has no central volume. MT4 and TradingView OANDA show tick volume, which counts price changes rather than traded size. We did not use it in this test.
Can I trade a key level bounce on its own?
Our data does not support that, because most lines show a bounce under a loose rule. Treat the level as a place to watch for a reaction; results are not guaranteed; past performance is not indicative of future results.
Last updated: 9 October 2026.

About the author
Written by Dominic Walsh, a Forex trader and MT4/MT5 indicator, Expert Advisor and script developer. Every tool on forexmt4systems.com is tested on live charts before release and ships with ready-to-use compiled MT4 (.ex4) and MT5 (.ex5) files. Learn more about the trader and developer behind this site.
How we build, test and correct every tool: Editorial & Testing Policy. Trading carries risk; see the disclaimer.