
The know sure thing indicator (KST) blends four rate-of-change readings into one slow momentum line, then adds a signal line for crossovers. This guide settles three things. First, how the line is built and what each of the nine default inputs does. Next, what its signal-line crosses did on 23 FX pairs over eight years of daily data. Finally, where the tool lets you down, with real charts from October 2026.
What the know sure thing indicator is
KST is a momentum oscillator. Martin Pring designed it and introduced it in 1992 in Stocks & Commodities magazine, as TradingView’s Know Sure Thing help page notes. Pring first called it the Summed Rate of Change, and that old name describes it better than the new one.
A single rate of change looks at one price cycle only. So Pring took four of them, smoothed each one, and added them together, with heavier weights on the longer cycles. As a result, the line moves slowly and tracks the main swing.
KST has no fixed range. Unlike RSI, it does not sit between 0 and 100. Its values depend on how far price moved. So a gold reading near -40 and a EURUSD reading near -20, both from our October charts, cannot be compared directly. In practice you read it in three ways: the side of the zero line, the slope, and crosses with its own signal line. Pring’s own site, Pring.com, hosts his educational material for traders.
If oscillators are new to you, our page on leading vs lagging indicators explains why a smoothed momentum line always trails price.
How the KST is calculated
Everything starts with the rate of change (ROC). ROC compares today’s close with the close n bars ago, as a percentage:
ROC(n) = (close - close[n]) / close[n] x 100
Then the indicator smooths four ROC lines with simple moving averages. With the TradingView defaults, the steps look like this:
RCMA1 = SMA(ROC(10), 10)RCMA2 = SMA(ROC(15), 10)RCMA3 = SMA(ROC(20), 10)RCMA4 = SMA(ROC(30), 15)
Next comes the weighted sum: KST = RCMA1 x 1 + RCMA2 x 2 + RCMA3 x 3 + RCMA4 x 4. Finally, the signal line is a 9-bar SMA of KST.
Look at the weights for a moment. They add up to 10, so the slowest component carries 40% of the line and the fastest only 10%. That is why KST turns late. The 30-bar ROC with its 15-bar average reaches back 44 bars, so the line needs a long warmup. In addition, the signal line needs nine KST values of its own, so it first appears after roughly 50 bars.
Because the parts are simple moving averages, the moving averages explained guide covers the same lag trade-off in more depth. Also, the structure resembles MACD: a fast-minus-slow momentum idea plus a signal average. Our MACD explained page is a useful comparison.
How we tested the KST
We ran two kinds of tests. Both follow our editorial testing policy.
Measurement. We computed KST with the TradingView defaults on MetaTrader 4 history from Capital Point Trading, build 1471. The sample covers 23 FX pairs on the daily chart, from 12 June 2018 to 24 August 2026. That is 37,748 daily candles. Our rule was plain: a bullish event is KST crossing above its signal line, a bearish event is KST crossing below it. Then we checked the close 10 bars later. Did price end higher after a bullish cross, or lower after a bearish one? We compared each answer with the same 10-bar question asked on every bar.
Charts. We added the built-in “Know Sure Thing” study, untouched, to TradingView web charts on 5 October 2026, using OANDA data. The charts show EURUSD, GBPUSD, XAUUSD, USDJPY and AUDUSD on the daily timeframe, June to early October 2026. Each numbered marker sits on a cross bar that we confirmed in the data.
One limit applies to every number below. This terminal’s history does not store usable spreads. So every result is before spread, swap and commission. Gold was a chart example only, since the measured sample covers FX pairs.
KST settings and parameters
TradingView exposes nine inputs. The table lists each one with its default and what it changes. The defaults match the daily set Pring suggested.
| Input | Default | What it controls |
|---|---|---|
| ROCLen1 | 10 | Fastest rate-of-change lookback (weight 1) |
| ROCLen2 | 15 | Second lookback (weight 2) |
| ROCLen3 | 20 | Third lookback (weight 3) |
| ROCLen4 | 30 | Slowest lookback (weight 4, 40% of the line) |
| SMALen1 | 10 | Smoothing on ROC 1 |
| SMALen2 | 10 | Smoothing on ROC 2 |
| SMALen3 | 10 | Smoothing on ROC 3 |
| SMALen4 | 15 | Smoothing on ROC 4 |
| SigLen | 9 | SMA length of the signal line |
The weights do not appear as inputs in the built-in version. They stay fixed at 1, 2, 3 and 4. TradingView’s help page also lists Pring’s alternative sets for weekly and monthly charts. For example, the weekly set lengthens the smoothing to 10, 13, 15 and 20.
Shorter settings make the line faster but add crosses. Before tuning, read our note on curve fitting in trading. Nine inputs give you plenty of ways to fit the past.
Reading the KST on a chart
The study draws two lines in a lower pane. In our shots the green line is KST and the red line is its signal. A dashed zero line runs through the middle.
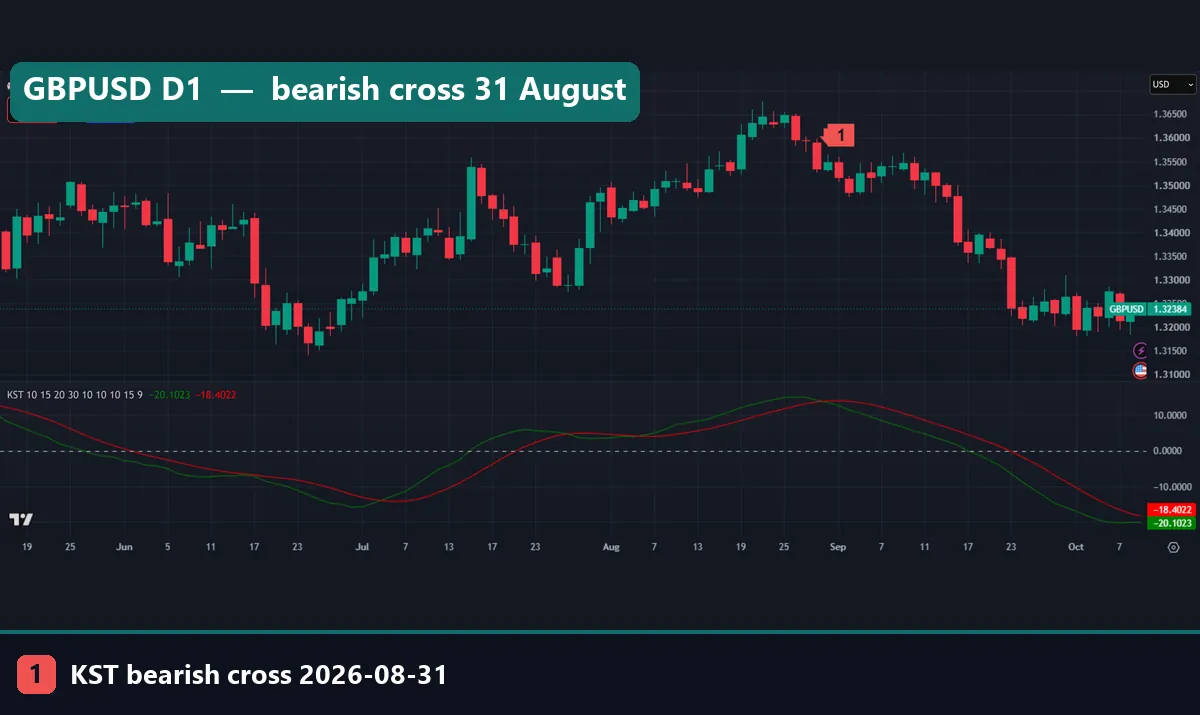
Take GBPUSD first. KST rose through July and August and peaked in late August. Then it rolled over and crossed below the signal line on 31 August 2026, at marker 1. That bar closed at 1.35489. By the chart’s last bar on 5 October, GBPUSD sat at 1.32230, and both lines were below zero. KST read -19.3921 against a signal of -13.7555.
Notice where the cross printed, though. The price high came about a week earlier. So the cross confirmed a turn already under way. That is normal for KST: it describes the swing, it does not call the top.
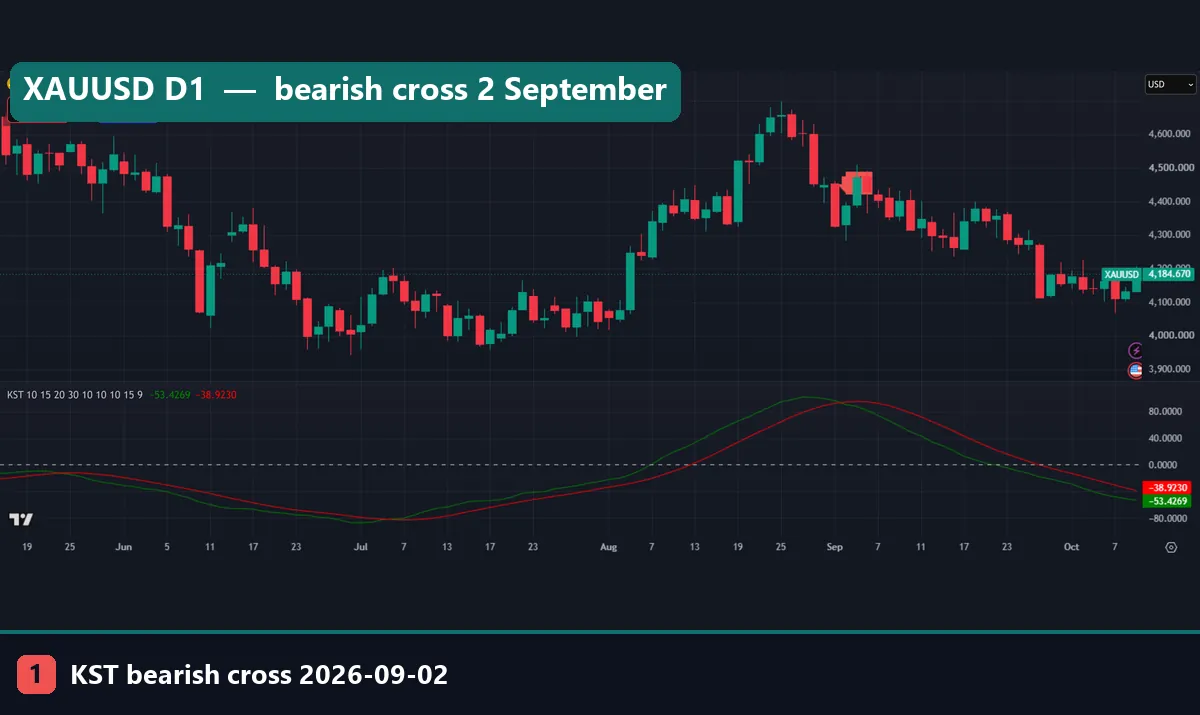
Gold shows the same habit on a larger scale. The bearish cross came on 2 September 2026, and that bar closed at 4,388.22 dollars. By then price had already fallen from its late-August peak above 4,600. Still, the line kept falling with price into October. At the last bar gold closed at 4,158.495, and KST stood at -40.0189 against a signal of -21.8983.
Also note the scale. Gold’s KST swings past 80, while the FX pairs stay within about 20 either side of zero. So never copy a “high” or “low” KST level from one market to another.
Worked example: EURUSD daily, July to October 2026
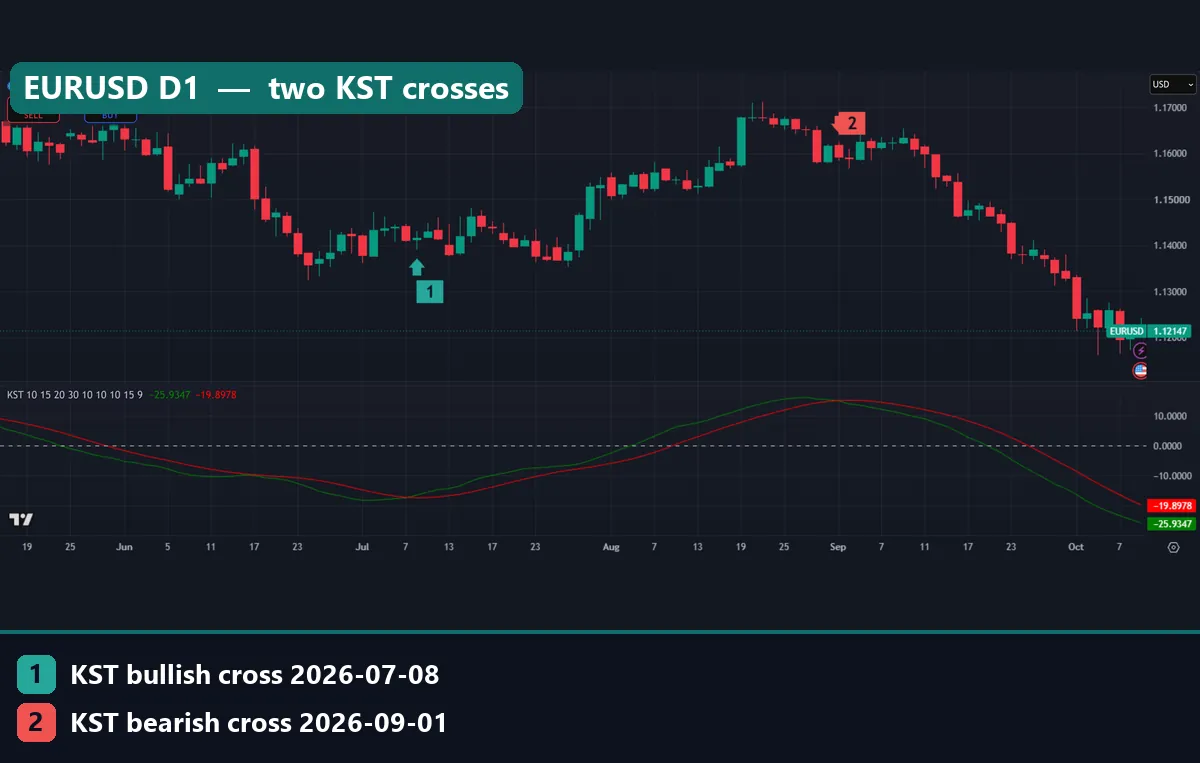
Go back to the EURUSD chart at the top. It holds two crosses, and both come from our TradingView data.
First, marker 1. On 8 July 2026, KST crossed above its signal line, deep below zero. That bar closed at 1.14162. Price drifted sideways for two weeks. From late July it climbed to the 1.17000 area by 20 August. In this case the cross came near the low, and the move that followed was large.
Next, marker 2. On 1 September 2026, KST crossed below its signal line, close to its peak above 10. That bar closed at 1.15923, roughly a hundred pips under the 1.17000 area of late August. So the bearish cross gave back part of the top before it appeared. After it, EURUSD slid to 1.12029 by 5 October. That is 389 pips below the cross bar’s close.
Here is the honest reading. Both crosses look good because the swings were long and clean. However, two crosses prove nothing. The hourly EURUSD chart produced five crosses between 27 September and 5 October alone. That is why we measured thousands of daily crosses.
What 2,048 daily crosses showed
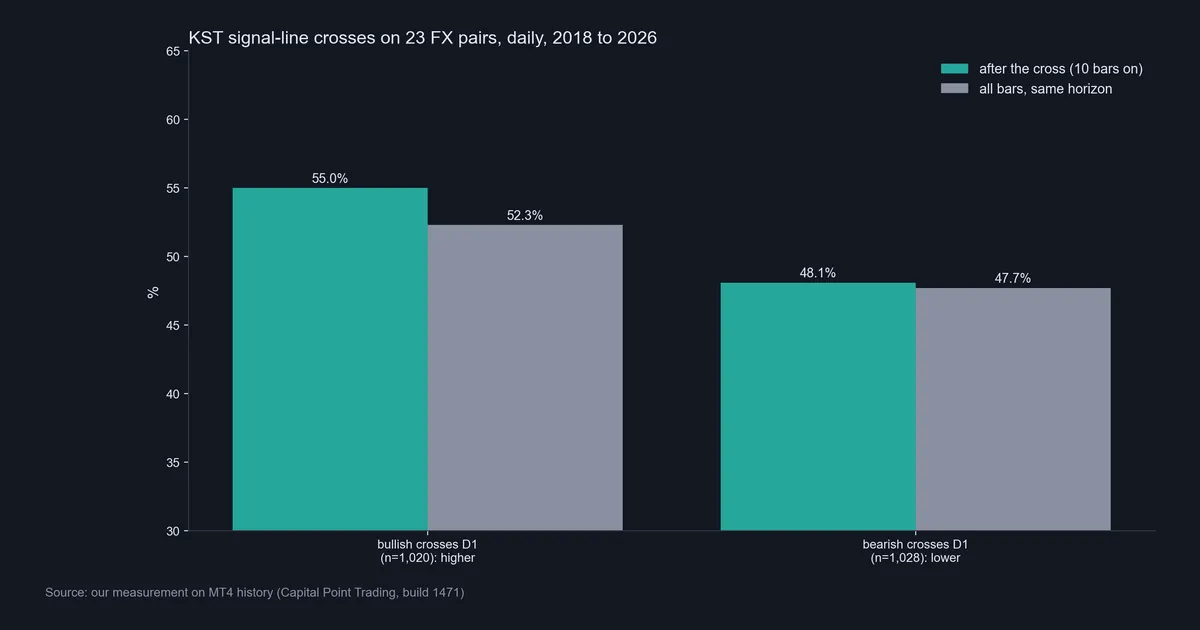
Across the 23 pairs we found 1,020 bullish crosses and 1,028 bearish crosses. That works out to about 1.18 crosses per pair per month. So on a daily chart you see a new cross roughly every three to four weeks per pair.
After a bullish cross, price closed higher 10 bars later 55.0% of the time. On all bars, the same 10-bar test came out higher 52.3% of the time. That gap is 2.7 percentage points. It is modest, and we have not tested it out of sample.
After a bearish cross, price closed lower 10 bars later 48.1% of the time. The all-bars figure for “lower” was 47.7%. In short, the bearish cross added almost nothing over chance in this sample.
Keep two cautions in mind. First, these figures are before spread, swap and commission. Second, the 23 pairs share currencies, so many crosses fire on the same days for the same reason. As a result, the real number of independent events is smaller than 2,048. Our guide to backtest sample size explains why that matters.
A recent bullish cross on USDJPY
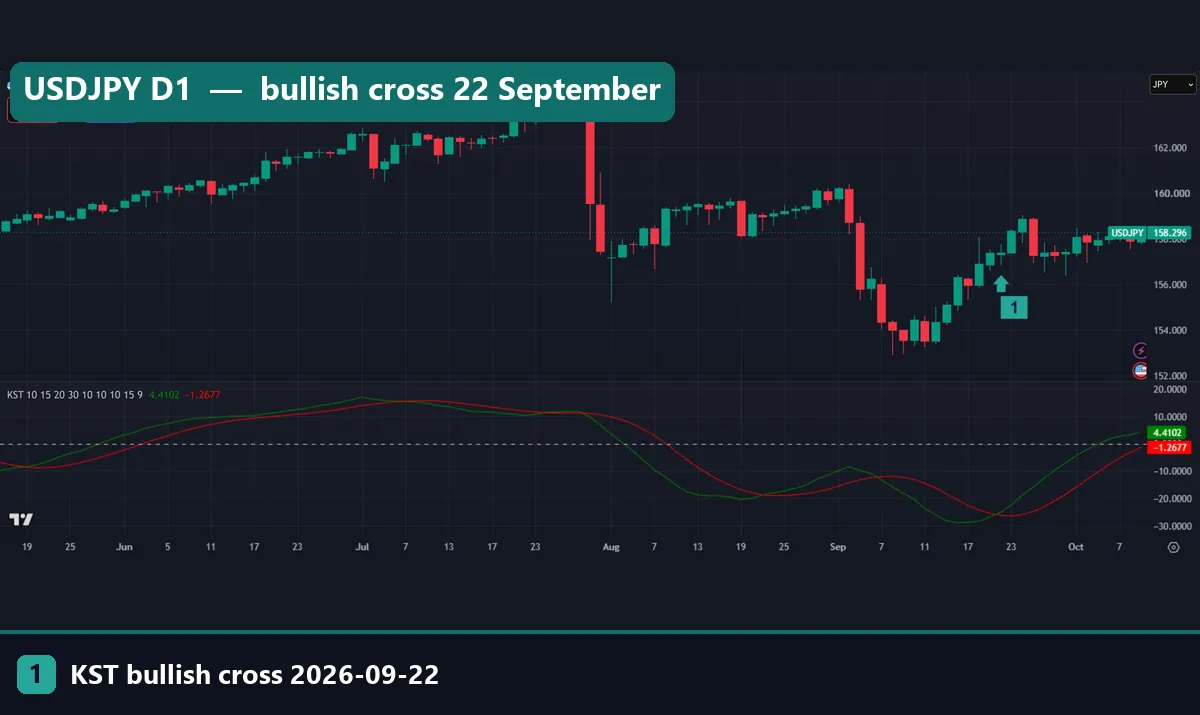
USDJPY gives a fresh case. KST crossed above the signal on 22 September 2026, and that bar closed at 157.393. By 5 October USDJPY closed at 158.199, and KST had climbed back to -0.0987, just under zero. One example, though, settles nothing.
Download the complete indicator database
Put these concepts on your charts. One email unlocks the full library of 1,380+ indicators with compiled MT4 and MT5 files, plus my TradingView scripts. No paywall, no spam, unsubscribe any time.
Get free access to my indicator database
One email unlocks 1,380+ free MT4, MT5 and TradingView indicators — the complete library. No single-tool download; you get the whole database.
Where it fails
KST fails in three plain ways, and each showed up in our data.
It is late on sharp moves. On 30 July 2026, USDJPY opened at 163.406 and traded down to 157.953 in one day. The bearish cross printed on that same bar, which closed at 159.547. So the signal arrived after most of the drop. Worse, a bullish cross had fired on 24 July at 163.85, six days earlier.
It whipsaws in ranges. When price goes sideways, KST flattens near its signal line and the two lines cross back and forth. GBPUSD crossed bearish on 28 July 2026 at 1.32894. Then it crossed bullish on 6 August at 1.34540. Anyone flipping on each cross sold low and bought back about 165 pips higher. AUDUSD did worse in May 2026: bearish on 11 May, bullish on 13 May, bearish again on 15 May.
Its bearish crosses showed no edge. In our sample, 48.1% against a 47.7% baseline is noise. Also, the bullish lean of 2.7 points may not survive costs. We cannot measure that here, because the history holds no usable spreads. Read backtesting transaction costs before you treat a small lean as tradable.
Lower timeframes make all three worse. Our hourly charts produced crosses every day or two.
Default settings and a chart that shows the lag
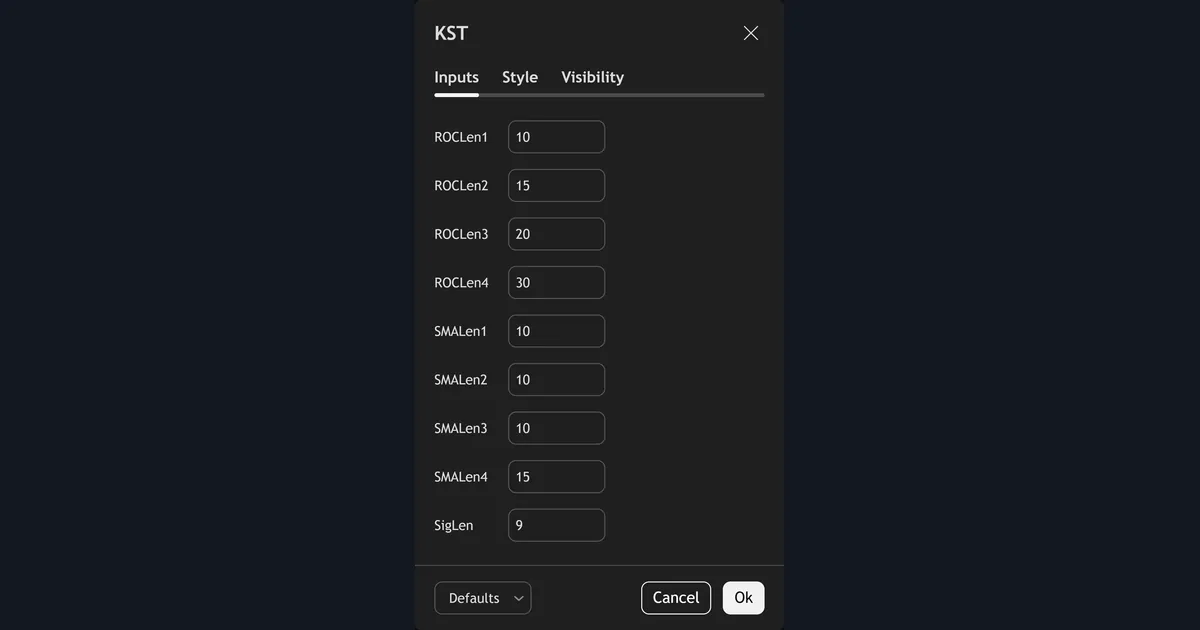
This is the TradingView settings dialog for the study. The Inputs tab shows all nine defaults from the table above. The Style and Visibility tabs change looks only, and the “Defaults” button restores the original values.
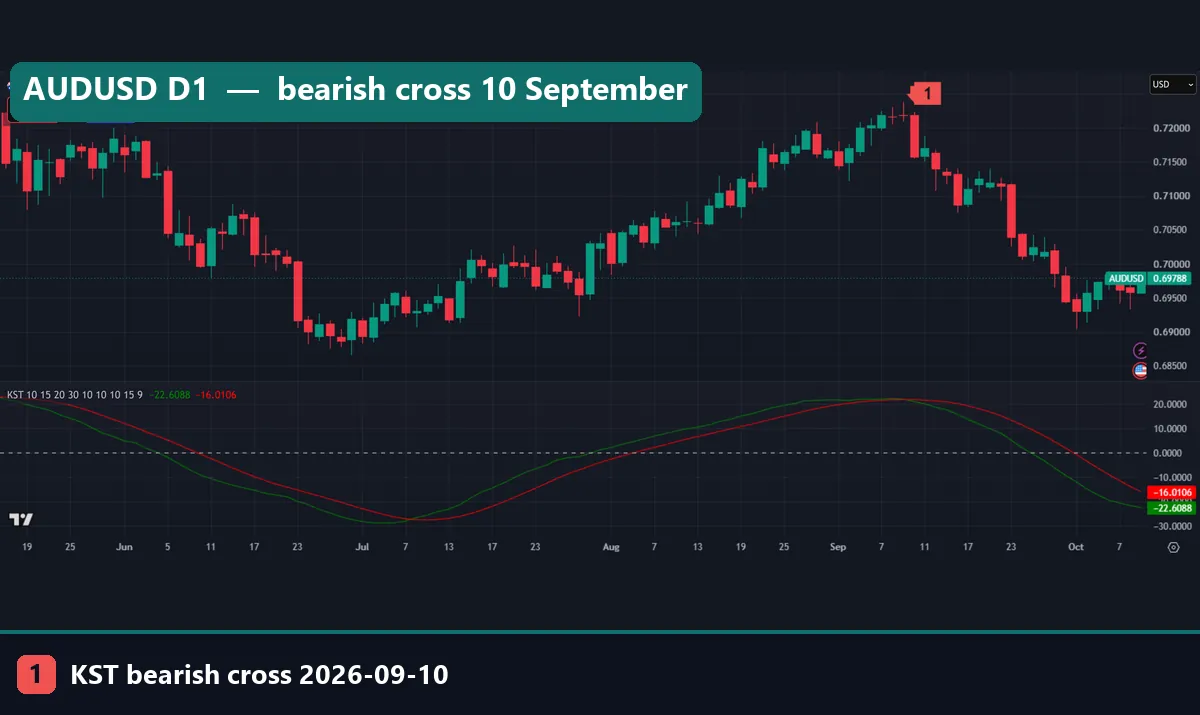
AUDUSD shows the lag in its plainest form. The pair topped in early September near 0.72000. KST crossed below its signal on 10 September 2026, and that bar closed at 0.71570. Price then fell to 0.69612 by 5 October. Meanwhile, KST reached -17.4581 against a signal of -6.2847.
Look at how flat both lines run near the top, from late August into September. The two lines almost touch for days before the cross. That flat stretch is where whipsaws happen when the trend fails to resume.
Four common mistakes with the KST
- Treating every cross as a trade. A cross means momentum changed pace. It does not tell you where to enter, where to stop, or how far price will go.
- Using daily settings on a 5-minute chart. Pring’s set suits daily bars. On fast charts the same nine numbers give constant crosses, and our daily statistics no longer apply.
- Reading fixed overbought levels. KST is unbounded. A reading of 20 is high for EURUSD and modest for gold, so copy no thresholds across markets.
- Ignoring the baseline. A bullish cross “working” 55.0% of the time sounds good until you see that any random day worked 52.3% of the time. Always ask what the bar would have done without the signal.
The same base-rate trap appears with other oscillators. Our page on RSI false signals walks through it with RSI.
Using KST alongside other tools
KST works best as context, not as a trigger. For example, its zero-line side shows whether the longer cycles lean up or down.
Divergence is the other common use. If price makes a higher high but KST makes a lower one, momentum is fading. Still, divergence can last for weeks before price turns. Our guide on what divergence in trading means covers the patterns and their failure rate.
Avoid stacking KST with MACD or a stochastic and calling the agreement confirmation. They all come from the same closes. Instead, pair it with something that measures a different thing, such as trend strength. Our ADX indicator guide and the how to combine indicators page both explain that approach.
Where to go next
If you want to test KST yourself, start with a plan you write before you look at results. Our walk-forward analysis guide shows how to keep a test honest. For a related signal-line oscillator, see our best MACD settings tests.
For outside reading, StockCharts covers the formula and Pring’s chart examples in Pring’s Know Sure Thing at StockCharts ChartSchool. The KST oscillator article on Wikipedia lists Pring’s suggested parameter sets with the book reference.
FAQ about the know sure thing indicator
Who created the know sure thing indicator?
Martin Pring created it and introduced it in 1992 in Stocks & Commodities magazine. He first called it the Summed Rate of Change.
What are the default KST settings on TradingView?
ROCLen1 to ROCLen4 are 10, 15, 20 and 30, SMALen1 to SMALen4 are 10, 10, 10 and 15, and SigLen is 9. The weights stay fixed at 1, 2, 3 and 4.
Is KST a leading or a lagging indicator?
It lags. The slowest component carries 40% of the weight and reaches back 44 bars, so crosses usually print after the turn has started.
What does a KST signal-line cross mean?
It means the blended momentum changed pace. In our daily test on 23 FX pairs, price closed higher 10 bars after a bullish cross 55.0% of the time, against 52.3% on all bars.
Did bearish KST crosses help in your test?
Barely. Price closed lower 10 bars after a bearish cross 48.1% of the time, against 47.7% on all bars, across 1,028 crosses.
How often does KST cross on a daily chart?
In our sample it crossed about 1.18 times per pair per month, so roughly once every three to four weeks on each pair.
Can I use KST on 5-minute or 15-minute charts?
You can, but the daily defaults will cross very often there, and our measured figures cover daily bars only. Any intraday use needs its own test.
Should I trade KST crosses on their own?
Our data does not support that. The bullish lean was small, untested out of sample and measured before costs; results are not guaranteed; past performance is not indicative of future results.
Last updated: 5 October 2026.

About the author
Written by Dominic Walsh, a Forex trader and MT4/MT5 indicator, Expert Advisor and script developer. Every tool on forexmt4systems.com is tested on live charts before release and ships with ready-to-use compiled MT4 (.ex4) and MT5 (.ex5) files. Learn more about the trader and developer behind this site.
How we build, test and correct every tool: Editorial & Testing Policy. Trading carries risk; see the disclaimer.