
A propulsion block ICT setup is an order block that forms inside an earlier order block and then launches price away. This guide settles three things: what the pattern looks like, how to mark it without guessing, and how it did in our test. The short answer on that last point may surprise you. Across 23 daily FX pairs we found only 35 propulsion blocks, and they held less often than plain order blocks.
What a propulsion block is
Start with the parent idea. An order block is the last opposite-colour candle before a strong move. In a rally, that is the last down candle before the push higher. In a sell-off, it is the last up candle before the drop. Our ICT terms glossary covers the wider vocabulary if any of this is new.
A propulsion block adds one condition. The new order block candle must trade into an older order block that points the same way. So you get two stacked zones. The older one acts as the first floor or ceiling. Then the newer candle dips into it, finds orders there, and becomes the spring for the next leg.
ICT teaching treats the newer candle as the stronger zone, because it confirmed the older one. We tested whether that holds up.
The idea sits close to other ICT zones. For example, a mitigation block forms after a failed swing, and a breaker block is an order block that price broke through. A propulsion block is different. Nothing broke, and the older zone simply received a retest.
How a propulsion block ICT setup forms
The pattern needs four pieces in order. First, a displacement candle prints. Next, you mark the last opposite candle before it as order block A. Then price comes back, and a fresh opposite candle trades into zone A. Finally, a second displacement leaves from there, and that fresh candle becomes the propulsion block.
The word “displacement” needs a number, or two people will mark two different charts. So we used the average true range. A candle counts as displacement when its body is at least 1.5 times ATR. You can read how ATR works in StockCharts ChartSchool’s ATR article, or in our own guide to ATR in trading.
In plain terms, the test for each candle is short:
displacement = abs(close - open) >= 1.5 * ATR
order block  = last opposite candle within 5 bars before displacement
propulsion   = order block whose range overlaps an earlier same-direction
               order block formed within the previous 20 bars
A bullish propulsion block sits inside a bullish order block. Likewise, a bearish one sits inside a bearish order block. If the newer candle points the other way, it is not this pattern. Our page on displacement in trading shows more examples of the trigger candle.
How we tested
We ran the rules on MT4 terminal history from Capital Point Trading, MetaTrader 4, build 1471. The sample covered 23 FX pairs on the daily chart, from 12 June 2018 to 24 August 2026. A script marked every order block and every propulsion block with the rules above. Then it followed each block forward.
Two outcomes mattered. First, did price come back to the near edge of the block within 60 bars? Second, if it came back, did the block hold? We called a block held when price then moved 1 ATR away from it before any close beyond the far edge. A close beyond the far edge first counted as a failure.
The chart pictures in this guide come from the TradingView web chart with OANDA data, captured on 7 and 8 October 2026. They show EURUSD, AUDUSD, USDJPY, USDCHF and GBPUSD on H1 and D1. We drew the boxes ourselves from the same rules. All results here are before spread, swap and commission. You can read our full method in the editorial testing policy.
The settings we used
Every number below shapes the result. Change one, and you get a different set of blocks. So treat this as our recipe, not the only correct one.
| Parameter | Our value | What it controls |
|---|---|---|
| Displacement body | 1.5 x ATR or more | How strong the move away must be |
| Order block lookback | 5 bars | How far back to look for the last opposite candle |
| Earlier block window | 20 bars | How old the parent order block may be |
| Return window | 60 bars | How long we wait for price to come back |
| Hold distance | 1 x ATR | How far price must move away after the retest |
| Failure | Close beyond far edge | What ends the block |
| Timeframe | D1 (test), H1 and D1 (pictures) | Bar size |
We kept these values fixed for the whole run and did not tune them after seeing the results.
Reading a propulsion block on a chart
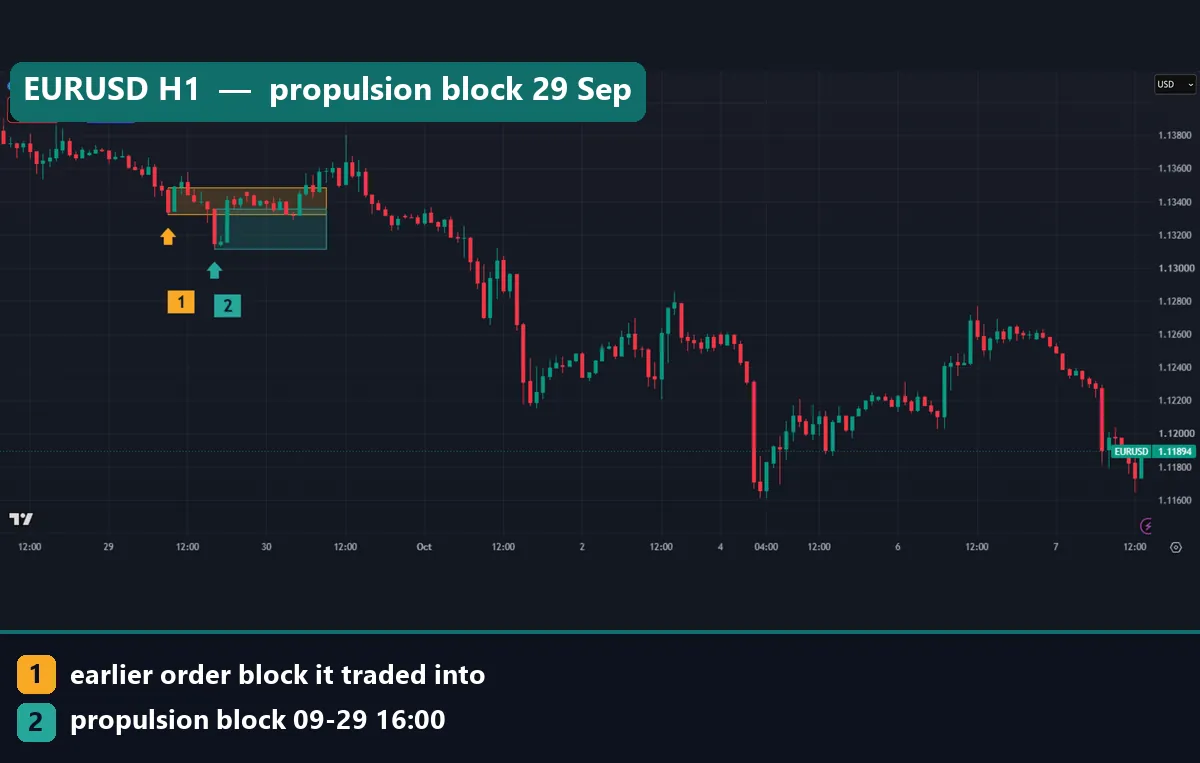
In our pictures the yellow box is the earlier order block. The coloured box is the propulsion block that traded into it. Marker 1 points at the earlier block, and marker 2 points at the propulsion candle.
The first picture shows EURUSD on H1. Order block A formed at 09:00 UTC on 29 September 2026, between 1.13324 and 1.13484. Then a down candle at 16:00 UTC dipped into it. That candle, from 1.13118 to 1.1336, became the bullish propulsion block once an up move left from it.
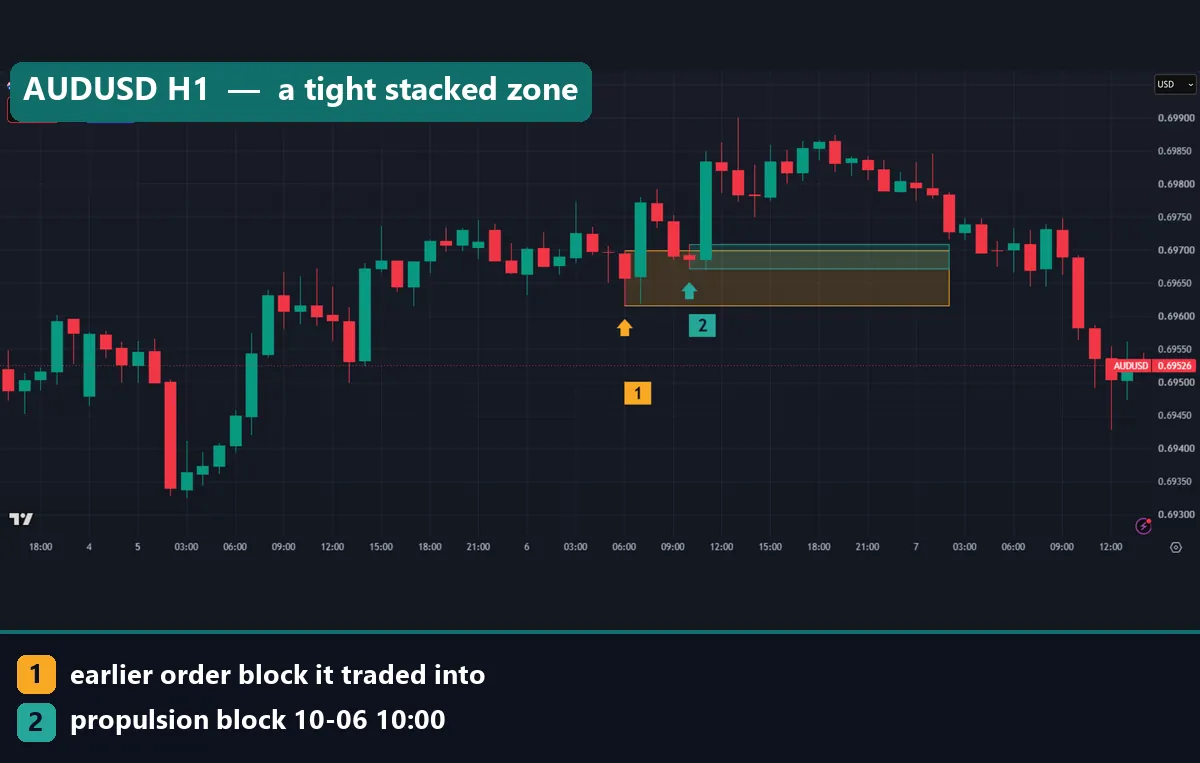
The AUDUSD H1 chart above is a tighter case. The earlier block formed at 06:00 UTC on 6 October, from 0.69616 to 0.69699. The propulsion candle came at 10:00 UTC, from 0.69672 to 0.69709. So the two boxes overlap almost fully.
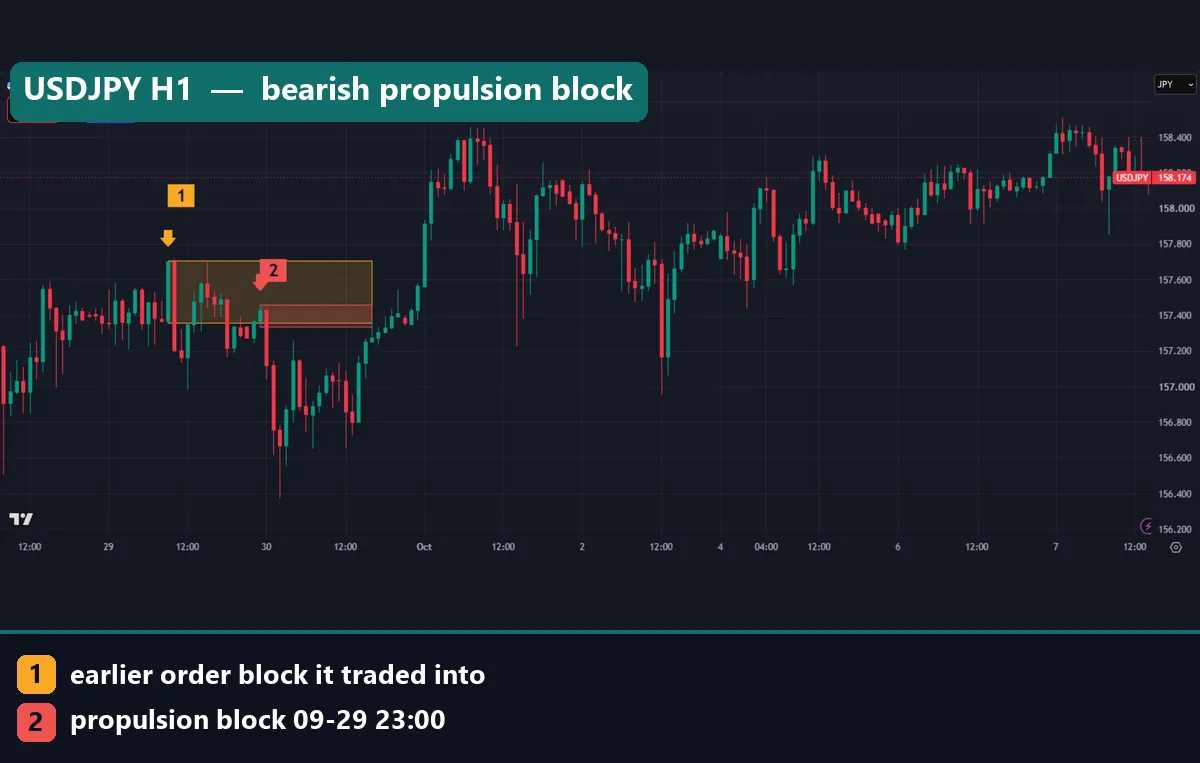
The USDJPY H1 chart shows the bearish version. Here the earlier block ran from 157.36 to 157.706 at 09:00 UTC on 29 September. Then an up candle at 23:00 UTC, from 157.338 to 157.46, poked into it. After that, the chart shows a sharp drop toward 156.40 on 30 September. Still, by early 1 October price had climbed back above both boxes.
Read the boxes from left to right. Find the older block first, then check that the newer candle entered it.
Worked example: EURUSD daily, June 2026
Here is one case with every level written out. On the EURUSD daily chart, a bearish order block formed on 4 June 2026. It ran from 1.15946 to 1.16455, so it was 50.9 pips tall.
Next, price bounced back up into that zone. The up candle of 16 June 2026 printed a high of 1.16198 and a low of 1.15748. Its top reached 25.2 pips into the older block, because 1.16198 minus 1.15946 is 0.00252. On 17 June a large down candle left from there. That made the 16 June candle a bearish propulsion block, 45.0 pips tall.
Now apply the reading. The block runs from 1.15748 to 1.16198. Its near edge, for a bearish block, is the bottom at 1.15748. Its far edge is the top at 1.16198. A daily close above 1.16198 would end it. Meanwhile, a retest that then moved 1 ATR lower would count as a hold.
The chart below shows what came next. Price fell from the block and traded below 1.14000 in late June. Then it spent July in a range under the boxes. However, one clean case is not evidence. The next section shows why.
Our results: 35 propulsion blocks against 718 order blocks
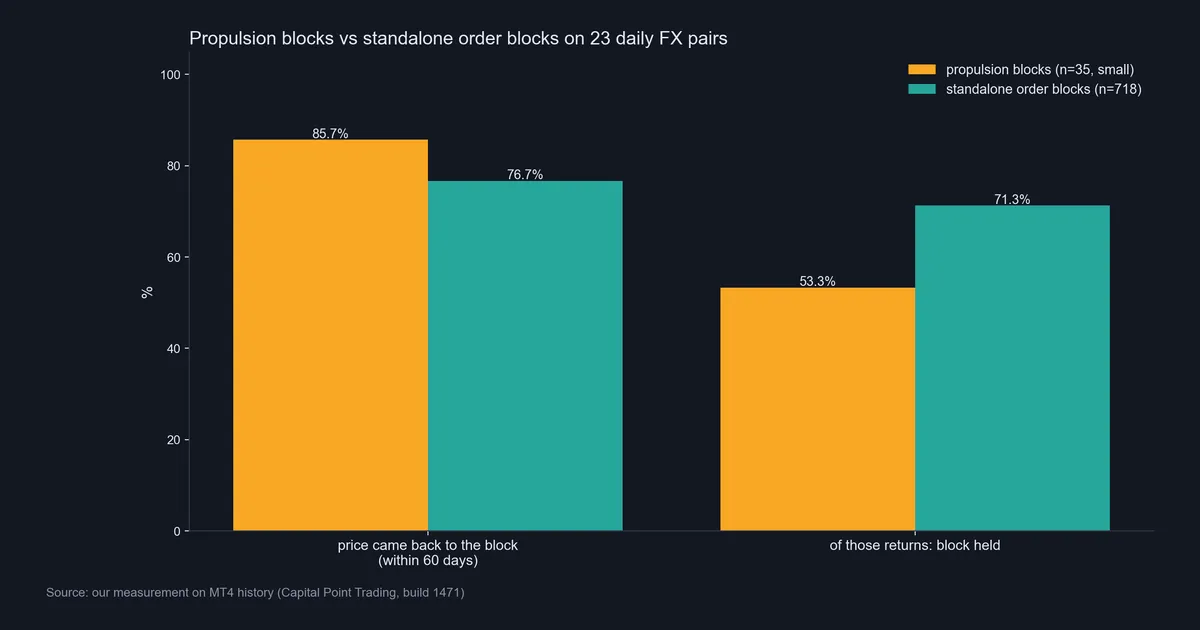
The bar chart above is our measurement. Over eight years of daily data on 23 pairs, the rules found 718 standalone order blocks. They found only 35 propulsion blocks. That is a small sample, and one or two cases can move the percentages a lot.
Price came back to 85.7% of propulsion blocks within 60 bars, so 30 of the 35. For standalone order blocks the figure was 76.7%. So stacked zones did get retested a bit more often.
The second pair of bars tells the more useful story. Of the propulsion blocks that price revisited, 53.3% held, which is 16 of 30. In contrast, standalone order blocks held on 71.3% of their returns. In our test the propulsion label did not mark a stronger zone. If anything, it marked a weaker one.
Why? One reading is that a stacked zone has already taken one test, and each touch uses up resting orders. That is our guess, and the data cannot prove it.
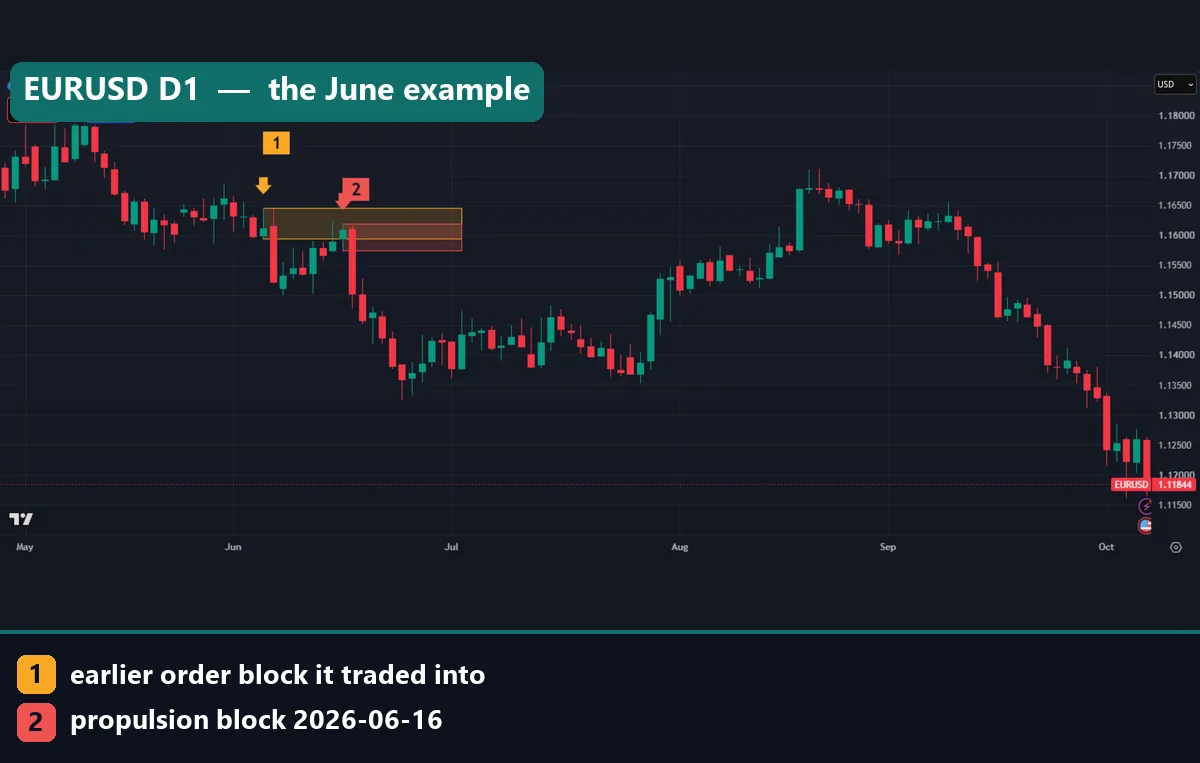
The EURUSD daily chart above shows the June case with both boxes. We chose it for the picture because the overlap is easy to see. It is an illustration, not proof, and it comes from OANDA data rather than our MT4 sample.
Download the complete indicator database
Put these concepts on your charts. One email unlocks the full library of 1,380+ indicators with compiled MT4 and MT5 files, plus my TradingView scripts. No paywall, no spam, unsubscribe any time.
Get free access to my indicator database
One email unlocks 1,380+ free MT4, MT5 and TradingView indicators — the complete library. No single-tool download; you get the whole database.
Where it fails
First, the pattern is rare. On daily FX we found 35 cases in about eight years across 23 pairs. So anyone who sees propulsion blocks on every chart is loosening the rules.
Second, it held less often than a plain order block once price came back. A trader who prefers propulsion blocks on purpose would, on our data, pick the weaker zone.
Third, the definition is loose in most teaching. “Traded into” can mean a wick, a body or a close. Each choice changes the count. We used any overlap of the candle range, which is the widest choice.
Fourth, you only learn that a candle is a propulsion block after the next displacement prints. By then price may sit far from the box.
Finally, our test uses daily candles. Intraday blocks behave differently, and our H1 pictures show two blocks that broke within a day. Also, spot FX has no central exchange, as the BIS Triennial FX Survey makes clear. So nobody can see the “orders” the name promises.
A failed propulsion block and a plain order block
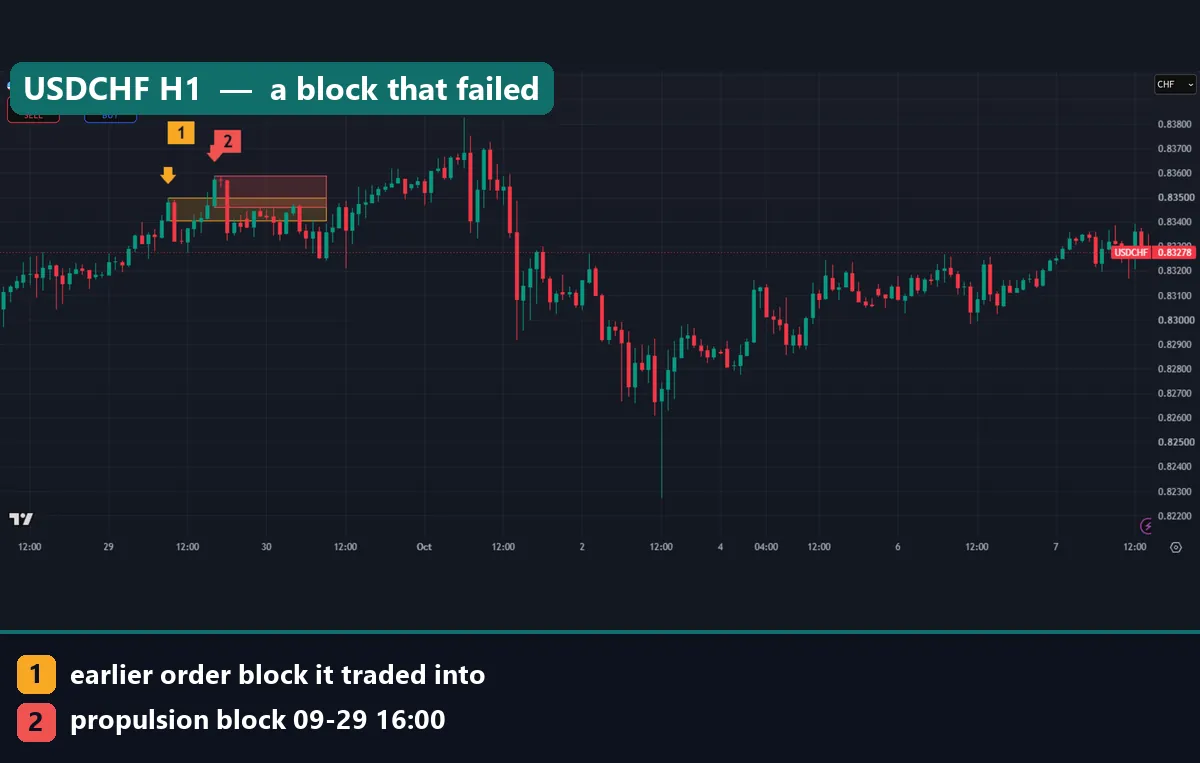
The USDCHF H1 chart above shows a failure. The earlier bearish block formed at 09:00 UTC on 29 September, from 0.83404 to 0.83498. Then the 16:00 UTC up candle, from 0.83461 to 0.83588, traded into it. Price stalled under the boxes for a while. Yet by 1 October it had pushed up toward 0.83800, well above the far edge. By our rule, that close ended the block.
The EURUSD H1 block from the first picture went the same way. After a lift toward 1.137 on 30 September, price fell through 1.13118 on 1 October and kept going. And the AUDUSD block broke on 7 October.
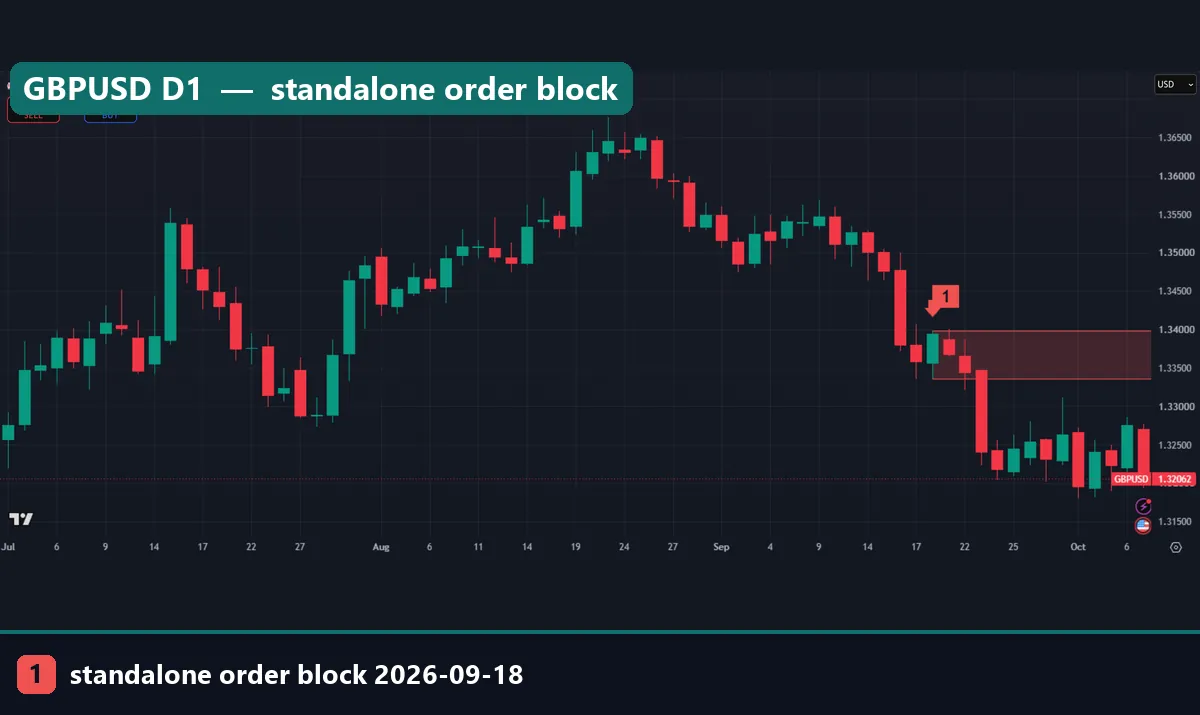
For contrast, the GBPUSD daily chart shows a standalone bearish order block from 18 September 2026. It runs from 1.33356 to 1.33982. Nothing older sits inside it. After the displacement on 23 September, price dropped toward 1.32000. As of the capture, price had not come back to the box at all. That is the third outcome, and the test simply leaves such blocks out of the hold count.
Propulsion blocks compared with other ICT zones
An order block is the base unit. A single candle order block is the same idea on one bar.
The propulsion block is the only one of these built from two order blocks in a row. That makes it more specific. But specific does not mean better, as our numbers show. ICT also uses gaps as launch zones. Our guide to the breakaway gap in ICT covers that idea, and the page on fair value gaps versus order blocks compares the two zone types.
For a neutral outside definition of the parent pattern, see the order block entry at BabyPips. It does not set a size rule.
Common mistakes
- Calling any two nearby boxes a propulsion block. The newer candle must enter the older block, and both must point the same way. Otherwise you have two separate order blocks.
- Skipping the size rule. Without a number for displacement, every small move creates a block.
- Assuming the newer zone is stronger. Our test found the opposite. Propulsion blocks held on 53.3% of returns, while standalone order blocks held on 71.3%.
- Ignoring the far edge. Decide in advance which close ends the block. Our guide on using ATR as a stop loss shows one way to size that buffer.
Where to go next
If you want order blocks drawn for you, start with our order block indicator. Also, the unmitigated order block indicator keeps only zones that price has not yet revisited. And the non-repaint order block indicator fixes each box once its candle closes. None of them labels propulsion blocks by name. The downloads are compiled files only.
For background, read our pages on market structure shifts and ICT PD arrays. Outside the site, the market microstructure article on Wikipedia explains how real order flow works, which is a useful check on the story behind any block.
FAQ about the propulsion block
What is a propulsion block in ICT?
It is an order block candle that trades into an earlier order block of the same direction, and then a strong move leaves from it.
How is it different from a normal order block?
A normal order block stands alone. A propulsion block needs an older same-direction block behind it, and the newer candle must overlap that older zone.
Do propulsion blocks hold better than order blocks?
Not in our test. On 23 daily FX pairs, propulsion blocks held on 53.3% of returns. By comparison, standalone order blocks held on 71.3%.
How many propulsion blocks did you find?
We found 35 on daily data from June 2018 to August 2026, against 718 standalone order blocks. That is a small sample, so read the percentages with care.
Which timeframe works best for propulsion blocks?
We only measured the daily chart. Our H1 pictures show the pattern on intraday charts too, but we did not test H1 blocks as a group, so we cannot rank timeframes.
What counts as displacement?
We used a candle body of at least 1.5 times ATR. Other traders use other values, and each one changes which blocks appear.
When does a propulsion block fail?
In our rules, a close beyond the far edge ends it. For a bullish block that means a close below its low. For a bearish block, it means a close above its high.
Can I trade propulsion blocks on their own?
Our data does not support that. They are rare and held less often than plain order blocks, so treat them as one input among several. Also, results are not guaranteed; past performance is not indicative of future results.
Last updated: 8 October 2026.

About the author
Written by Dominic Walsh, a Forex trader and MT4/MT5 indicator, Expert Advisor and script developer. Every tool on forexmt4systems.com is tested on live charts before release and ships with ready-to-use compiled MT4 (.ex4) and MT5 (.ex5) files. Learn more about the trader and developer behind this site.
How we build, test and correct every tool: Editorial & Testing Policy. Trading carries risk; see the disclaimer.