
Quantitative trading means trading from exact rules that a computer can test on past data before any money goes in. This guide covers what that takes: rules, data, testing and risk. Then it runs the check that most home-made quant work skips. We tuned three classic rules on 23 currency pairs from 2018 to 2022. Next, we froze the best settings and ran them on 2023 to 2026. The winners mostly lost, and one rule family did the opposite.
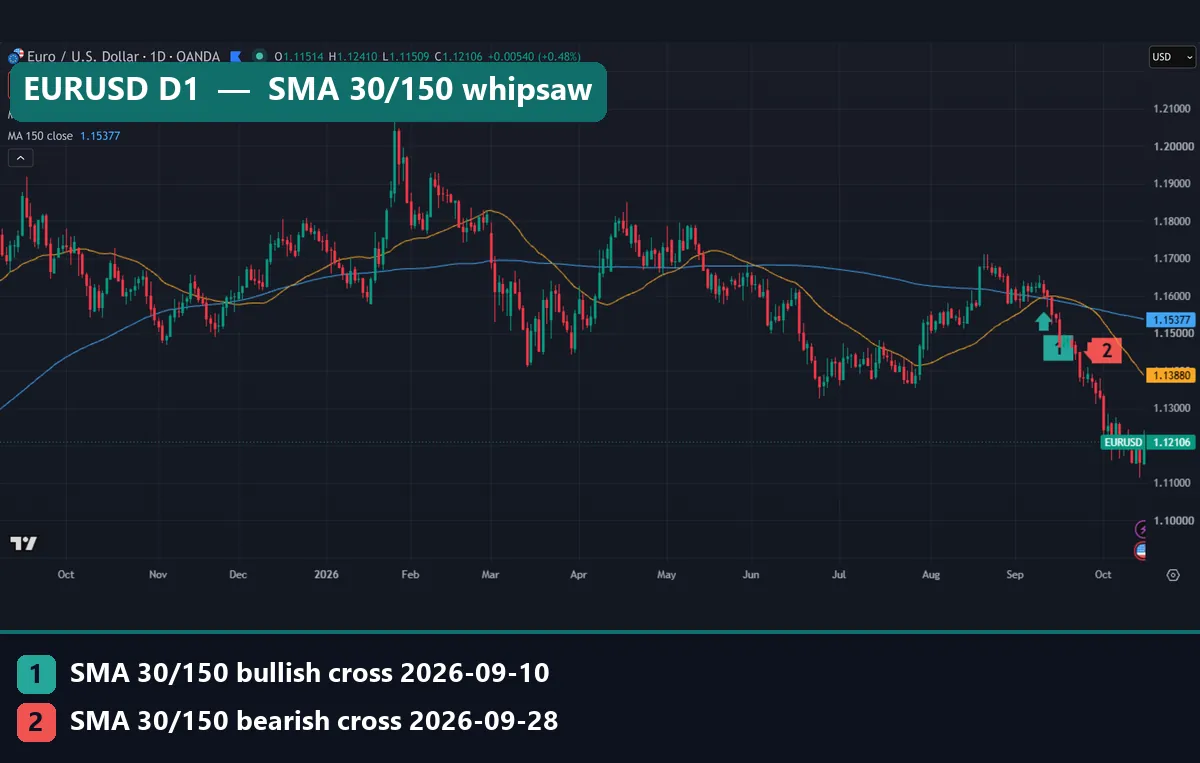
Above is the setting that topped our 2018-2022 tuning: a 30-day SMA (gold) and a 150-day SMA (blue) on EURUSD. In September 2026 it turned long on the 10th (marker 1), then short again on the 28th (marker 2). That whipsaw is the out-of-sample problem in one picture.
What is quantitative trading?
Quantitative trading, or quant trading, makes trade decisions from data and fixed rules instead of judgment in the moment. A quant rule states exactly when to enter, when to exit and how much to risk. Because the rule is exact, you can run it over years of history and count what it would have done. The systematic trading article on Wikipedia covers the wider family, from slow trend systems to high-frequency firms.
Quant trading is not the same thing as automated trading. You can follow a quant rule by hand, and a robot can run a rule that nobody ever tested. Our guide to algorithmic trading in forex covers the automation side. This guide is about testing, because that is where most retail quant work goes wrong.
How quant trading works: rules, data, testing, risk
Every quant process has four parts, and each one can break the result on its own.
- Rules: exact entry, exit and sizing logic, with no room for “the trend looks strong”.
- Data: clean history for every market, long enough to hold hundreds of trades.
- Testing: a run on past data, then a second run on data the tuning never touched.
- Risk: how much each trade can lose, as our guide to position sizing explains.
To compare 23 pairs, we needed one unit for every trade. Pips fail, because GBPJPY moves far more pips in a day than EURGBP. So we scored each trade against the 14-day average true range (ATR) at entry:
result = (exit price - entry price) x direction / ATR(14) at entry
Direction is +1 for a long and -1 for a short. ATR is roughly the size of a normal daily bar. So +0.44 means a trade gained a bit under half a normal day, and -0.87 means it lost most of one.
The simplest honest test is a split test, also called in-sample and out-of-sample. You tune settings on the first part of the history, freeze them, and run them once on the rest. If the setting still works, you have weak evidence. If it fails, the first result was probably noise.
How we tested quantitative trading rules
We used daily history from MetaTrader 4, build 1471, on the Capital Point Trading server. The method follows our editorial testing policy.
- Markets: 23 currency pairs, from majors such as EURUSD and USDJPY to crosses such as GBPJPY and AUDNZD.
- Timeframe: D1, one bar per trading day.
- In-sample: June 2018 to December 2022, where we tuned every setting.
- Out-of-sample: January 2023 to August 2026. Each trade counts in the window of its entry date.
- Minimum sample: 100 in-sample and 50 out-of-sample trades per setting.
- Costs: none. Every result is before spread, swap and commission.
- Charts: TradingView web chart, OANDA data, D1, captured on 15 October 2026.
The charts use a different feed, so their prices differ slightly from the MT4 history. Every test figure comes from MT4. Also, many pairs share a currency, so one dollar move hits several of them at once. Our note on backtest sample size explains why that shrinks the real sample.
The rules and settings we tested
We chose three classic families: a crossover, a breakout and a reversal rule. We ran every setting in each grid and kept those with enough trades.
| Rule | Logic | Settings grid | Kept | Best in 2018-2022 |
|---|---|---|---|---|
| SMA cross | Always in: long while the fast SMA is above the slow one, short below it; reverse on the next cross | Fast 5, 10, 20, 30, 50; slow 20, 50, 100, 150, 200 | 20 | 30/150: +0.44 ATR, 131 trades |
| Donchian breakout | Enter on a break of the N-day high or low; exit on a break of the X-day opposite channel | Entry 10, 20, 40, 55, 100; exit 5, 10, 20, 50 (shorter than entry) | 14 | 55/5: +0.07 ATR, 563 trades |
| RSI reversal | Wilder RSI crosses back up through L (long) or down through 100 minus L (short); hold a fixed number of days | RSI 7, 14, 21; L 20, 25, 30, 35; hold 5, 10, 20 | 27 | RSI(7), 30/70, 20 days: +0.15 ATR, 596 trades |
Our guide to moving averages covers the first rule’s lines. The Donchian channel indicator draws the second rule’s levels in MT4 and MT5. The 55-day breakout is also the System 2 entry in our Turtle trading strategy guide. That pairing, 55 days in and 20 out, made -0.084 ATR in-sample and -0.631 after.
Reading a Donchian breakout on a chart
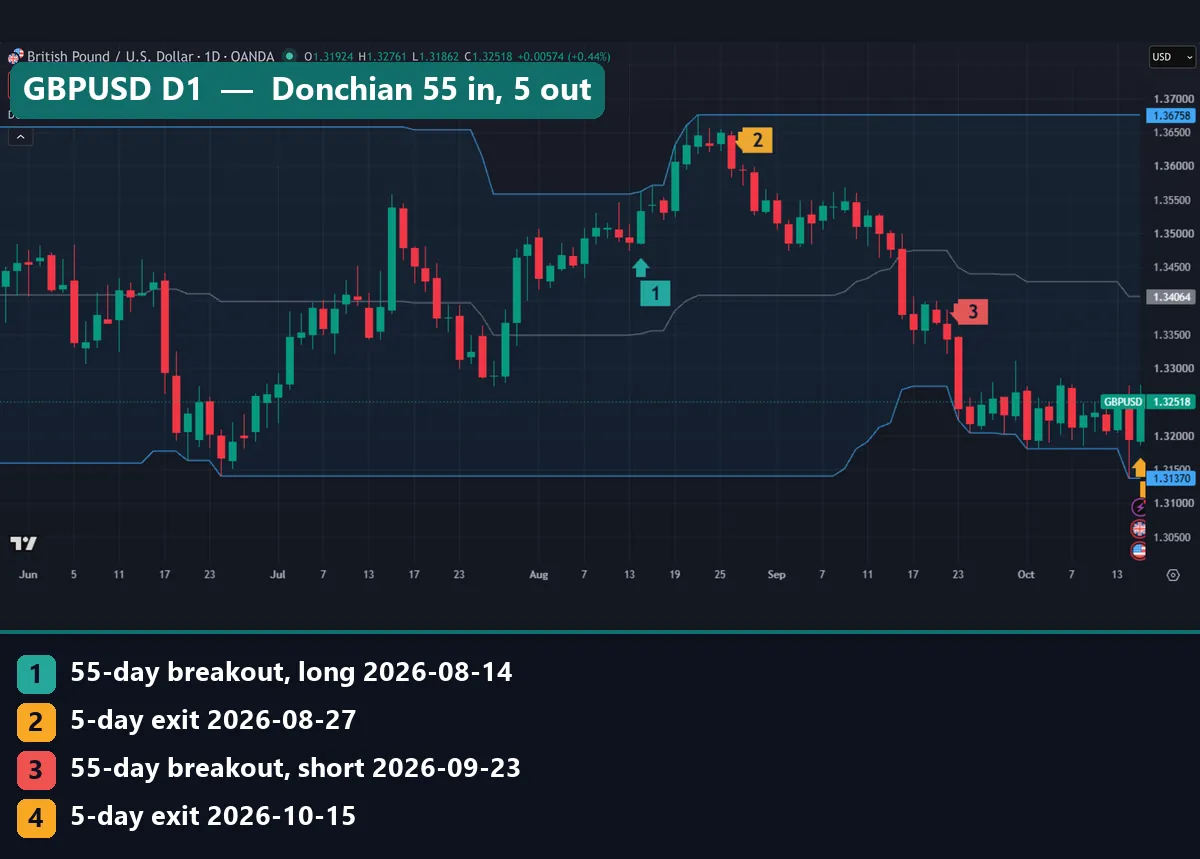
On GBPUSD, the blue lines are the 55-day Donchian channel, and the grey line sits halfway between them. Marker 1 is a long on 14 August 2026, when price broke the 55-day high at 1.35582. Price then ran to 1.36758 on 21 August, the high that still caps the channel. But the exit watches the 5-day low. Price broke it on 27 August (marker 2) and closed the trade at 1.35831, just 24.9 pips up.
Marker 3 is a short on 23 September at 1.32735. Marker 4, cut off at the right edge, is its 5-day exit at 1.32753 on 15 October. That was our capture day, so the bar was still forming. The short lost 1.8 pips before costs. TradingView’s Donchian Channels help page describes the built-in study we used.
Reading an RSI reversal on a chart
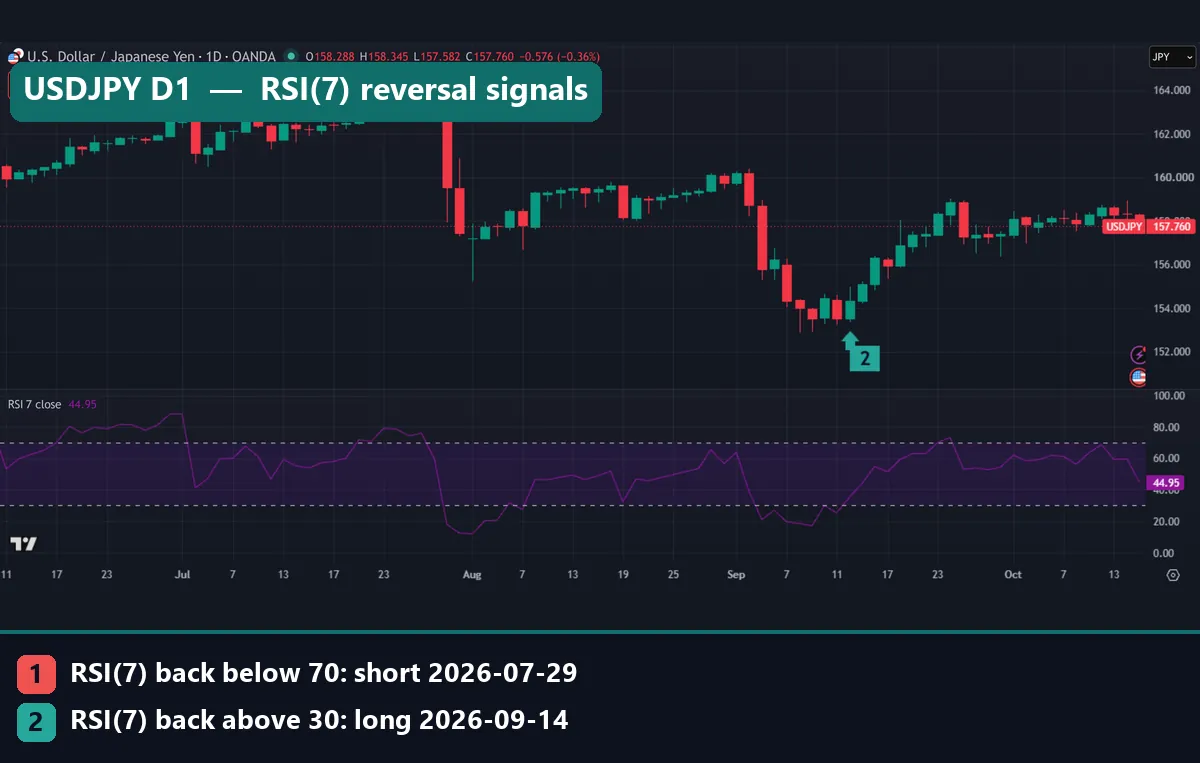
On USDJPY, RSI(7) sits in the lower pane with dashed lines at 70 and 30. The rule acts when RSI comes back inside the band. On 29 July 2026 (marker 1), RSI(7) fell back below 70, so the rule sold at the 163.438 close. It held for 20 trading days and closed on 26 August at 159.316, a 412.2-pip gain. On 14 September (marker 2) it bought at 154.344, then closed on 12 October at 158.642, up 429.8 pips.
Two clean wins look convincing. Yet the two shorts just before them, from 30 April and 11 June, lost 262.2 and 242.6 pips. Four trades say almost nothing, which is why the test pools hundreds. Our RSI indicator page covers the oscillator itself.
Worked example: tuning the SMA cross, then testing it
- Tune. We ran 20 SMA settings on 2018-2022. Only 6 made money per trade, and the median returned -0.129 ATR.
- Pick. The winner was 30/150 at +0.443 ATR over 131 trades. Next came 50/150 at +0.442 and 30/200 at +0.354.
- Test. On 2023-2026, the frozen 30/150 made 146 trades averaging -0.874 ATR. The runners-up made -1.332 and -1.155.
- Rank. Out of sample, 0 of 20 settings made money and the median fell to -0.762. Our winner ranked 14th.
So the tuning picked three slow settings that had ridden the 2018-2022 trends. All three then finished below their family’s median. The best result after 2022 came from 5/20, at -0.178, which had ranked fifth before. Even that lost money before costs.
The EURUSD chart at the top shows the 2026 version. The rule went long on 7 May at 1.17237 and flipped short on 3 June at 1.15986, losing 125.1 pips. That short lost 11.4 pips when the rule went long at 1.161 on 10 September. Then the long lost 238.6 pips by the 28 September cross at 1.13714. At capture, price stood at 1.12106, so the open short was 160.8 pips ahead. A trend rule needs runs like that to pay for its losers. After 2022, too few came.
What every setting did out of sample
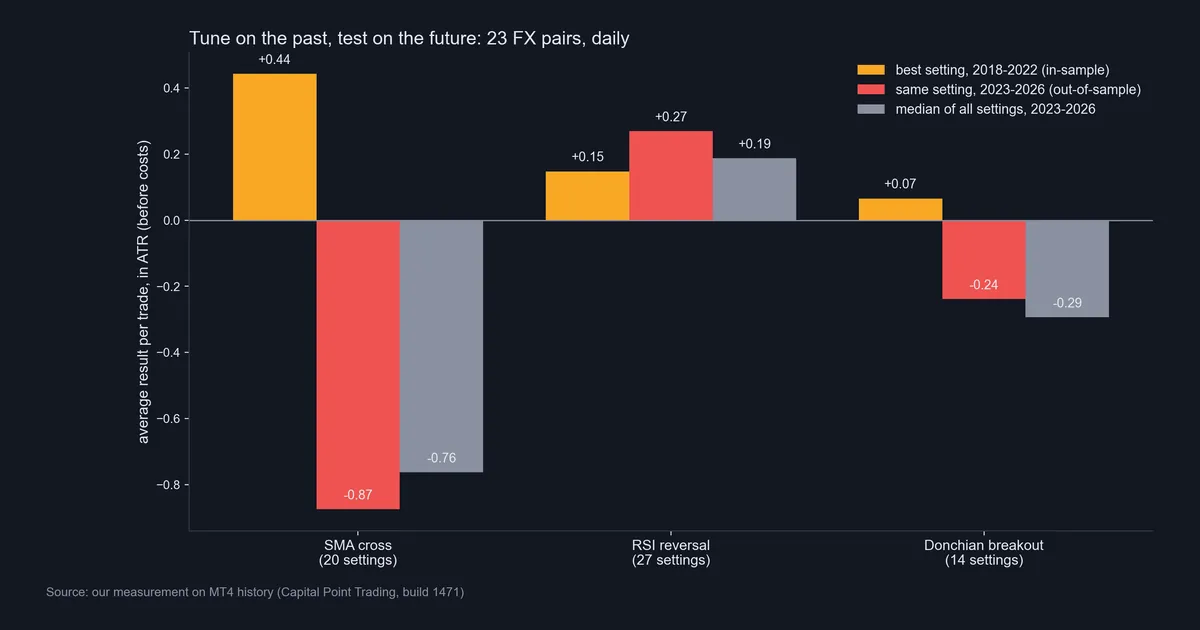
In the bar chart, orange is each family’s best 2018-2022 setting, red is the same setting in 2023-2026, and grey is the 2023-2026 median. The Donchian 55/5 fell from +0.07 to -0.24 over 651 trades. Six of 14 Donchian settings made money in-sample, but none did after, and the winner ranked 5th. The RSI rule went the other way, as its best setting rose from +0.15 to +0.27. Only 8 of 27 RSI settings made money in-sample, yet 26 of 27 did after.
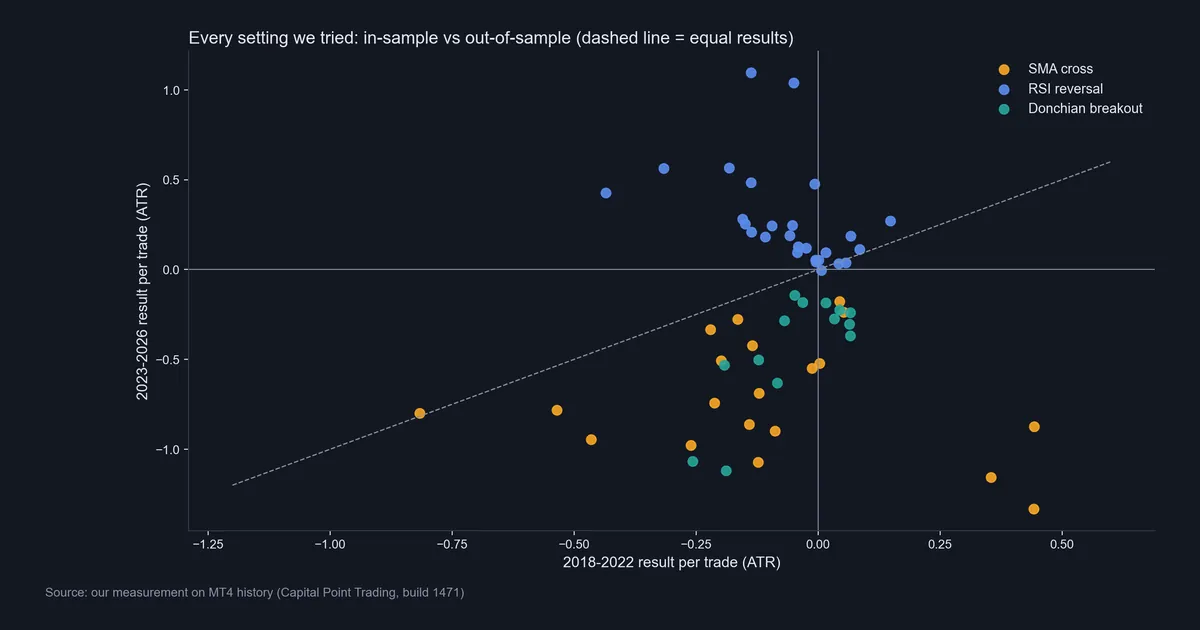
In the scatter, each dot is one setting: across is the 2018-2022 result, and up is the 2023-2026 result. If tuning found something lasting, the dots would hug the dashed line. Instead, SMA and Donchian dots sit below zero and almost all RSI dots sit above it. The two highest dots, RSI(14) at 25/75 and RSI(21) at 30/70, both lost money in-sample. Picking them now would just be tuning again.
Why the in-sample winners failed
First, the regime changed. When a whole family moves together, the market changed, not the setting. The median SMA setting went from -0.129 to -0.762 ATR, and the median Donchian from -0.04 to -0.294. Meanwhile the median RSI setting rose from -0.043 to +0.188. Another test of ours on the same data fits this, since 18 of the 23 pairs showed mild negative day-to-day autocorrelation.
Second, tuning picks noise. The gap between +0.443 and +0.442 is nothing, yet a tuner must pick one. With 106 to 131 trades behind each of the top three, chance can push any of them up. Bailey, Borwein, López de Prado and Zhu’s paper in the Notices of the American Mathematical Society shows the trap. The more variations you try, the easier it gets to find a backtest that looks good by luck. Our page on curve fitting in trading covers the same problem.
Third, a split test is the minimum check. The RSI rule passed once, and that could still be luck or regime. A walk-forward analysis repeats the split many times. Then our comparison of backtesting vs forward testing covers the last step on a demo account.
Download the complete indicator database
Put these concepts on your charts. One email unlocks the full library of 1,380+ indicators with compiled MT4 and MT5 files, plus my TradingView scripts. No paywall, no spam, unsubscribe any time.
Get free access to my indicator database
One email unlocks 1,380+ free MT4, MT5 and TradingView indicators — the complete library. No single-tool download; you get the whole database.
Where it fails
Costs. Every figure here is before spread, swap and commission. Fast settings trade the most: SMA 5/20 made 1,255 trades after 2022 and Donchian 10/5 made 1,608. The best RSI setting holds for 20 days, so swap applies every night. Our guide to backtesting transaction costs shows how to add them.
One split is one draw. We cut the data at 1 January 2023. Another cut date could reorder the ranking, and the next few years could flip it again.
Blind spots. A rule only knows its data. News shocks show up as one big bar after the fact. Our Donchian test assumes fills at the channel or the open, but a real stop can slip. Brokers also close daily bars at different hours, so two feeds can give different trades.
Rules do not adapt. A fixed rule keeps trading the old regime until you change it. Yet a change after a losing run is just more tuning, on less data. That loop is how many traders end up with a system fitted to last year.
Two more trend trades that lost in 2026
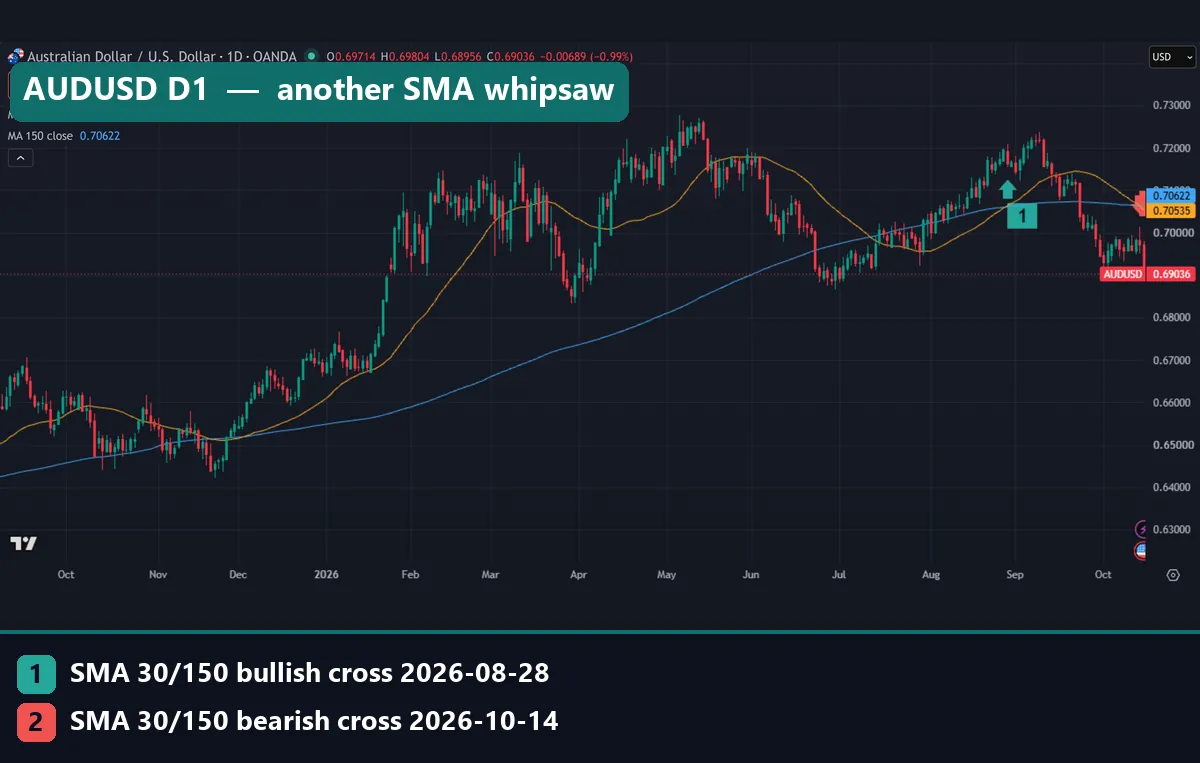
On AUDUSD, the SMA 30/150 rule went long on 28 August 2026 at 0.71622 (marker 1). It flipped short on 14 October at 0.69725 and lost 189.7 pips. That cross is marker 2, mostly hidden at the right edge. The short before it, from 13 July at 0.69176, had lost 244.6 pips. The averages now sit 8.7 pips apart, at 0.70535 and 0.70622, a tangle that breeds whipsaws.
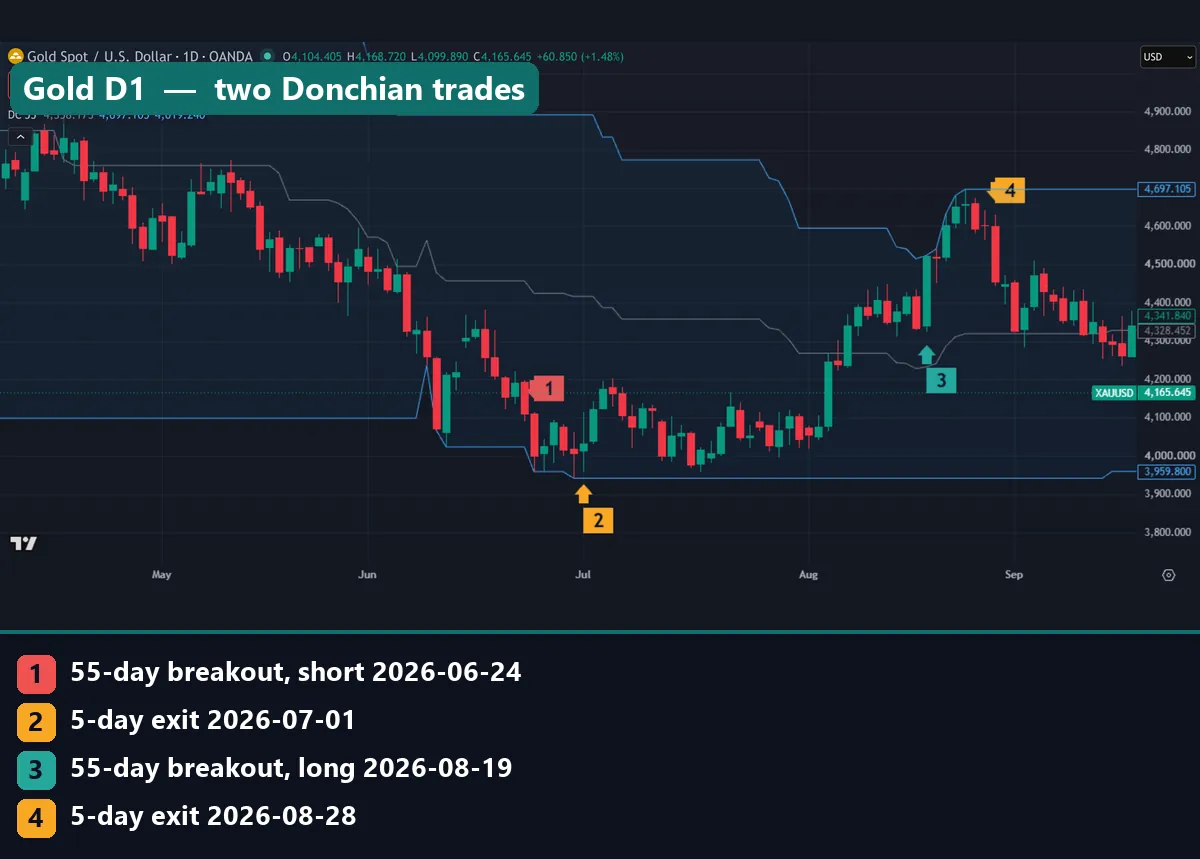
On gold, priced in dollars, the Donchian 55/5 short from 24 June at $4,023.87 (marker 1) exited on 1 July at $4,115.235 (marker 2), a $91.37 loss. The long from 19 August at $4,515.515 (marker 3) reached $4,697.105 on 25 August. Then the 5-day exit on 28 August (marker 4) closed it at $4,508.995, $6.52 below entry. That fast exit gave back a $181.59 gain from the high.
Common mistakes in quantitative trading
Each of these four showed up somewhere in our own test.
- Trading the best backtest. The top in-sample setting is the one most likely to be lucky. Our SMA winner ranked 14th of 20 on new data.
- Peeking at the test window. If you look at it while you choose settings, it stops being out-of-sample.
- Ignoring costs and correlation. A small average before costs can turn negative after them, and pairs that share the dollar are not separate tests.
- Judging a rule by a few trades. On USDJPY, two losing RSI trades came just before two winners.
Where to go next
To build your own rules, start with how to backtest a trading strategy, and set a test window aside before you tune anything. The MetaTrader 5 help page on strategy testing explains its forward option, which splits your dates into a tuning part and a check part. When a rule survives all of that, run it on a demo account before any real money goes in.
FAQ about quantitative trading
What is quantitative trading in simple terms?
It is trading from exact rules that you can test on past data. Two people who run the same rule get the same trades.
Is quantitative trading the same as algorithmic trading?
No. Quant trading is about rules built and tested on data, while algorithmic trading is about a computer placing the orders. You can trade a quant rule by hand.
What is out-of-sample testing?
It means running frozen settings on data you did not use to pick them. We tuned on June 2018 to December 2022 and checked on January 2023 to August 2026.
Why did the best backtest fail?
The market changed after 2022, which hurt every trend setting, and the top setting won partly by chance. SMA 30/150 went from +0.44 to -0.87 ATR per trade.
Which rule did best out of sample?
The RSI reversal: 26 of 27 settings were positive in 2023-2026, before costs. Still, its best in-sample setting ranked only 9th of 27.
Do I need to code to do quantitative trading?
Not for simple rules. MetaTrader and TradingView both have testers, and an SMA cross needs very little code. You do need clean data and exact rules.
How many trades do I need before I trust a backtest?
A few dozen is far too few. We required 100 in-sample and 50 out-of-sample trades per setting, and chance still shaped the ranking.
Can quantitative trading work for retail traders?
It can, but regime change, noise and costs hit small traders hard. Test every rule out of sample and keep risk small; results are not guaranteed; past performance is not indicative of future results.
Last updated: 15 October 2026.

About the author
Written by Dominic Walsh, a Forex trader and MT4/MT5 indicator, Expert Advisor and script developer. Every tool on forexmt4systems.com is tested on live charts before release and ships with ready-to-use compiled MT4 (.ex4) and MT5 (.ex5) files. Learn more about the trader and developer behind this site.
How we build, test and correct every tool: Editorial & Testing Policy. Trading carries risk; see the disclaimer.