
The Spanish currency before euro notes and coins arrived was the peseta. This guide settles three questions with our own data. How much did the peseta lose against the US dollar and the Deutsche mark? Which single days did the most damage? And why does a chart still print a peseta rate in 2026, long after the coins left Spanish tills? We used 6,520 daily closes from 1973 to 1998, plus the euro years that followed.
The Spanish currency before euro cash: what the peseta was
The peseta served Spain for well over a century. The Banco de España’s history of peseta coins and notes dates its birth to a Government Decree of 19 October 1868. That decree made it the basic unit of the Spanish monetary system. By the years in our data it was a fiat currency, so no metal stood behind a note.
Its end came in two steps. First, its rate to the euro became fixed on 1 January 1999. The ECB press release “Determination of the euro conversion rates”, dated 31 December 1998, gives the number: 166.386 pesetas per euro. The EU Council adopted these rates as irrevocable, in force from 0.00 hours local time on 1 January 1999. Then euro cash came in 2002. The Banco de España says the two moneys coexisted until 28 February 2002.
Before that, Spain spent nine and a half years in the European exchange rate mechanism, or ERM. The Spanish peseta article on Wikipedia gives the entry date as 19 June 1989. Inside the ERM the peseta had a central rate against its partners. A cut to that rate meant a devaluation, and several of the biggest days below fall on those cuts.
How a peseta quote works
A peseta chart shows USD/ESP: the number of pesetas that one US dollar buys. So the line moves against the peseta. A rising line means a weaker peseta, and a falling line means a stronger one.
Four short formulas cover every figure in this guide:
US cents per peseta    = 100 / USDESP
pesetas per mark       = USDESP / USDDEM
change in peseta value = (old rate / new rate) - 1
peseta rate after 1998 = 166.386 / EURUSD
The third line keeps the sign honest. For example, pesetas per mark rose 24.9% on 12 July 1977. In peseta terms that is 30.444 / 38.032 – 1, a fall of 20.0%. We quote the peseta’s side unless we say otherwise.
The last line explains every print since 1999. The same ECB release set the mark at 1.95583 per euro. So the lock also froze pesetas per mark at 166.386 / 1.95583 = 85.07. After that date no peseta price existed, only a conversion of EUR/USD. Our guide on whether the euro is stronger than the dollar covers that pair in its own right.
How we tested
Our source is the TradingView web chart, symbol FX_IDC:USDESP, whose header names ICE as the feed. We downloaded the daily closes on 16 November 2026. Bars dated 16 November were still forming, so we left them out. That makes Friday 13 November 2026 our last settled day. Also, FX_IDC stamps each daily bar at 22:00 UTC on the evening before, so we moved every date forward to its trading day.
The traded window runs from 2 January 1973 to 31 December 1998, or 6,520 daily closes. For the mark cross we divided USD/ESP by FX_IDC:USDDEM on the same date. Then we ranked the cross by its ten largest one-day rises. We found no bad prints to drop.
For the years after 1998 we ran one more check. On 752 days to the end of 2001, we compared the feed with 166.386 divided by EUR/USD. The median gap came to 0.065%, and the largest to 0.71%. So the modern line is a conversion with some feed noise, not a market. We placed no trades, so nothing here includes spread or fees. Our editorial testing policy sets out how we handle reference data like this.
The peseta’s key figures
| Item | Figure | Source |
|---|---|---|
| Created by decree | 19 October 1868 | Banco de España |
| ERM entry | 19 June 1989 | Wikipedia |
| Fixed euro rate | 166.386 pesetas per euro, from 1 January 1999 | ECB release |
| Coexisted with euro cash until | 28 February 2002 | Banco de España |
| Exchange deadline | 30 June 2021 | Banco de España |
| First close in our data | 63.49 per dollar (2 January 1973) | Our bars |
| Strongest peseta | 55.54 per dollar (4 March 1975) | Our bars |
| Weakest peseta | 191.57 per dollar (26 February 1985) | Our bars |
| Last traded close | 142.49 per dollar (31 December 1998) | Our bars |
| Loss against the dollar, 1973 to 1998 | 55.4% | Our bars |
| Pesetas per mark | 19.809 (2 January 1973) to 85.559 (31 December 1998) | Our bars |
| Loss against the mark | 76.8% | Our bars |
| Feed print, 13 November 2026 | 150.97, a converted euro rate | Our bars |
Two rows stand out. First, the best and worst dollar closes sit far apart. At 55.54 a peseta bought 1.80 US cents, but at 191.57 it bought only 0.52 cents. Second, the peseta lost far more against the mark than against the dollar. The mark itself rose against the dollar over these years, so the dollar line flatters the peseta.
Reading the chart: the July 1977 devaluation
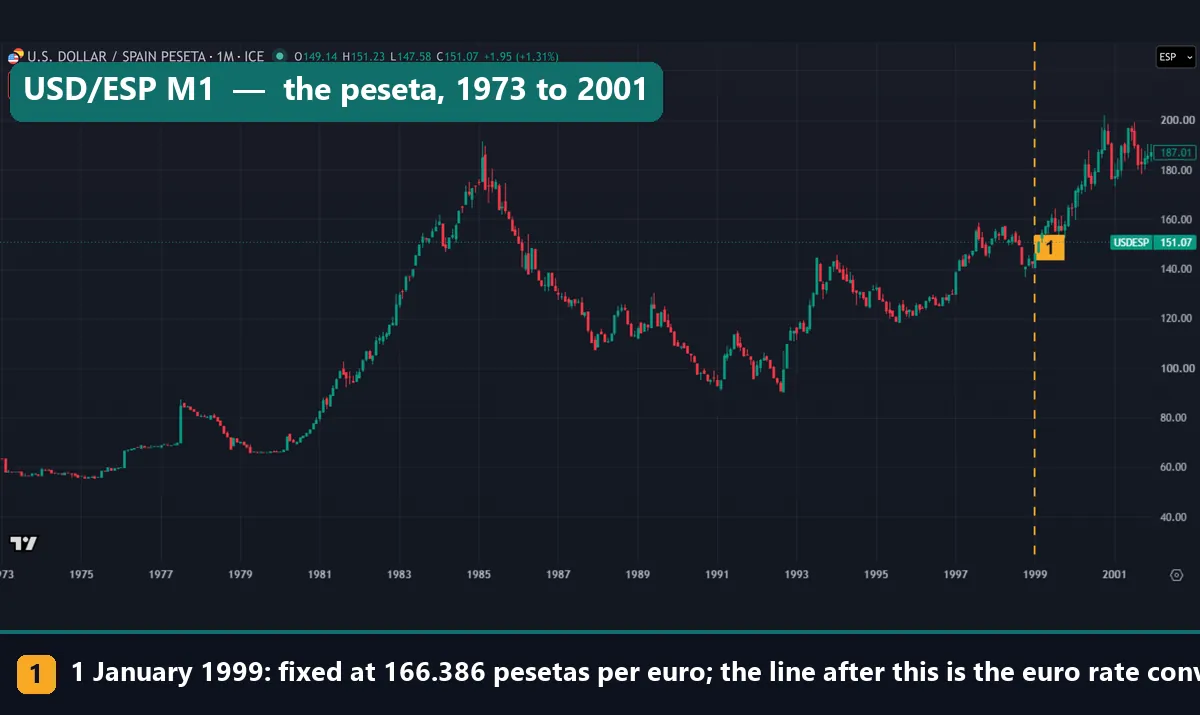
Start with the long view at the top of this page. The monthly candles climb from below 60 in the mid-1970s to a peak in early 1985, at 191.57 on 26 February. Then they fall to near 90 in 1992 and climb again. The dashed line marks 1 January 1999. Left of it the peseta traded, while right of it the line only tracks the euro.
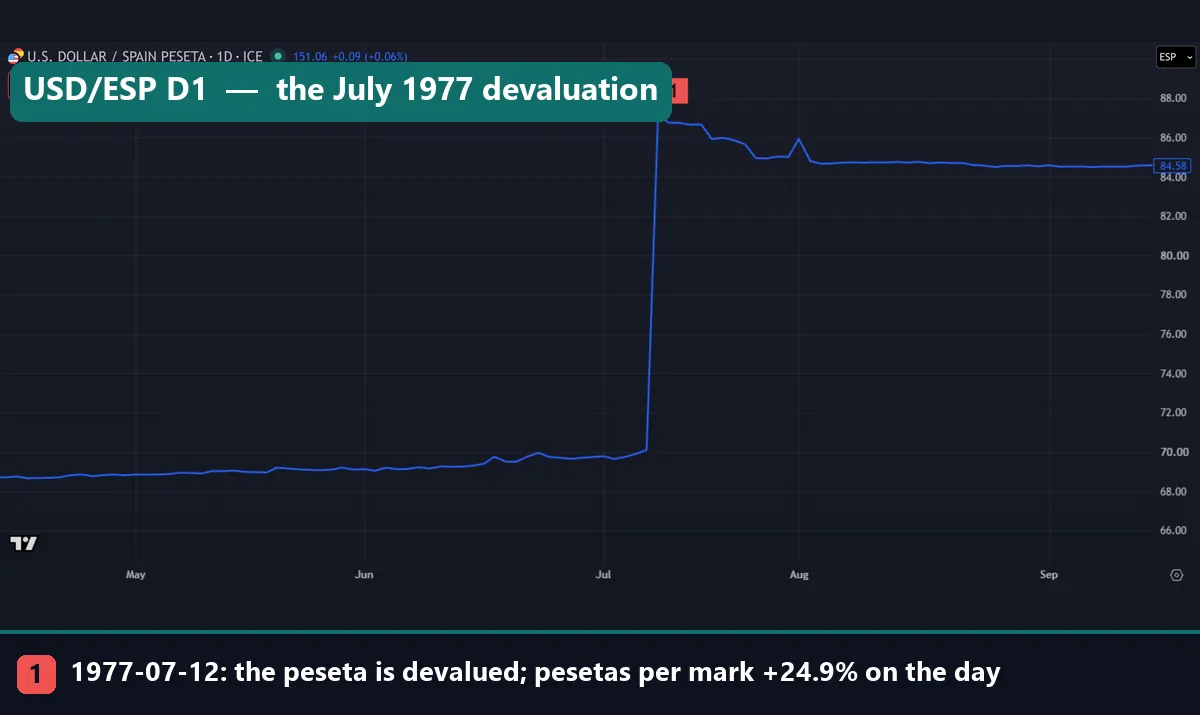
This daily line covers mid-April to mid-September 1977. For weeks it drifts just under 70 pesetas per dollar. Then marker 1 sits on 12 July, when the line jumps to about 87. On our cross the same day took pesetas per mark from 30.444 to 38.032, or +24.9%. That is the largest one-day move in all 26 years of our data.
The peak did not hold in full. The line eases through late July, spikes again at the start of August, and ends the window at 84.58. Even so, the new level stuck. Over 1977 the peseta lost 15.6% against the dollar and 25.0% against the mark, its worst year on that cross.
Reading the chart: the ERM devaluations of 1992 and 1993
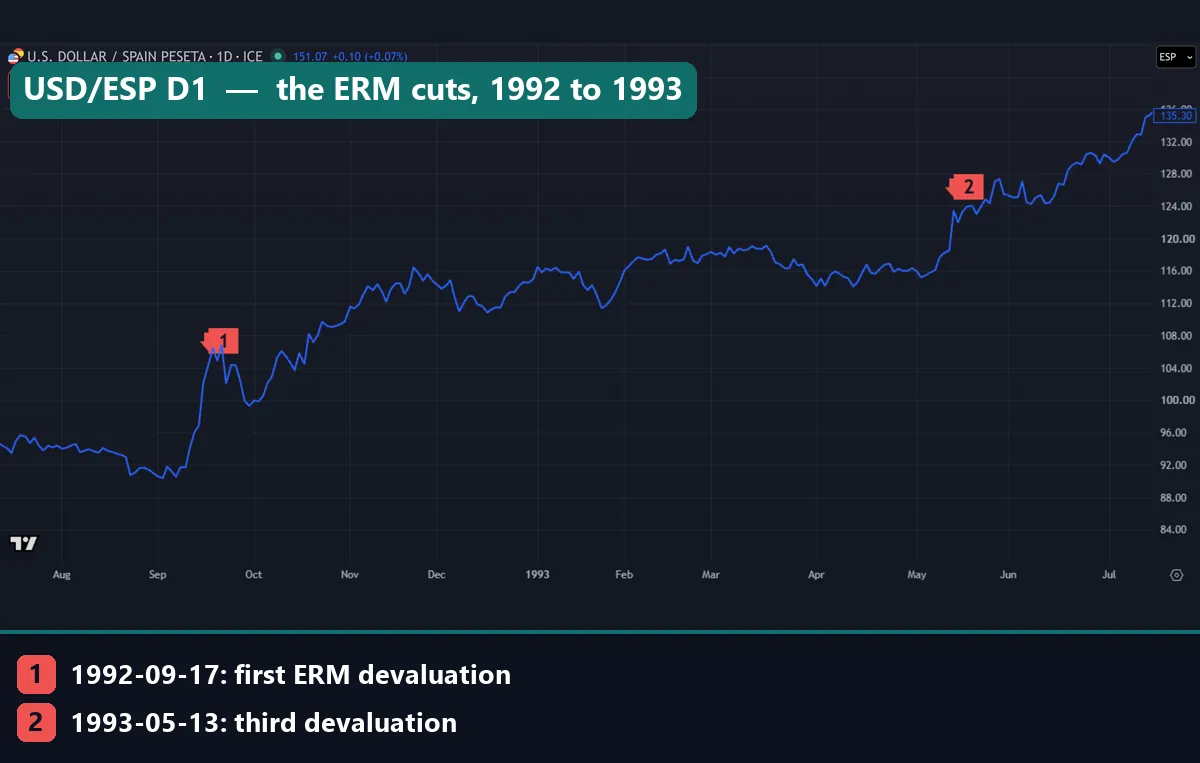
This line runs from late July 1992 to mid-July 1993. Through August it sits between about 91 and 96 pesetas per dollar. Then it climbs fast in September to marker 1, near 106. That marker is 17 September 1992, the day after sterling left the ERM, as our Black Wednesday guide explains.
A UK Parliament written answer of 6 May 1993, in Hansard, lists the moves. It records a 5 per cent devaluation of the peseta on 16 September 1992. It also records a 6 per cent cut on 23 November 1992, shared with the Portuguese escudo. Our closes show the first one on 17 September, the next trading day. On the cross, pesetas per mark rose 4.82% that day, a 4.6% fall for the peseta.
Marker 2 is 13 May 1993, the third devaluation. The Wikipedia article above also counts three in the early 1990s, the first just after Black Wednesday. Pesetas per mark rose 3.99% that day. Before it, the line had held between about 114 and 120 since mid-February, and it breaks out right there. By the end of the window it reaches 135.30, and the year closed at 143.15.
Worked example: 1,000 pesetas from 1973 to today
- Start with the first close, 63.49 on 2 January 1973. A 1,000 peseta note buys 1,000 / 63.49 = 15.75 US dollars.
- Move to the last traded close, 142.49 on 31 December 1998. The same note now buys 1,000 / 142.49 = 7.02 dollars, a loss of 55.4%.
- Run it against the mark: 1,000 / 19.809 = 50.48 marks in 1973, but 1,000 / 85.559 = 11.69 marks at the end of 1998.
- Lock it into euro: 1,000 / 166.386 = 6.01 euro. That sum has not changed since 1 January 1999.
- Convert to dollars with the feed’s 150.97 of 13 November 2026: 1,000 / 150.97 = 6.62 dollars.
Step five hides the key point. The 150.97 print implies EUR/USD of 166.386 / 150.97 = 1.1021. So the slide from 7.02 to 6.62 dollars comes from EUR/USD alone. No peseta changed hands to cause it.
Treat these figures as arithmetic, not as a bank’s buying price. Also, the Banco de España’s exchange deadline passed on 30 June 2021, so it no longer swaps old notes at 166.386. For live pairs, our currency converter runs the same kind of arithmetic.
Our measurement: pesetas per Deutsche mark
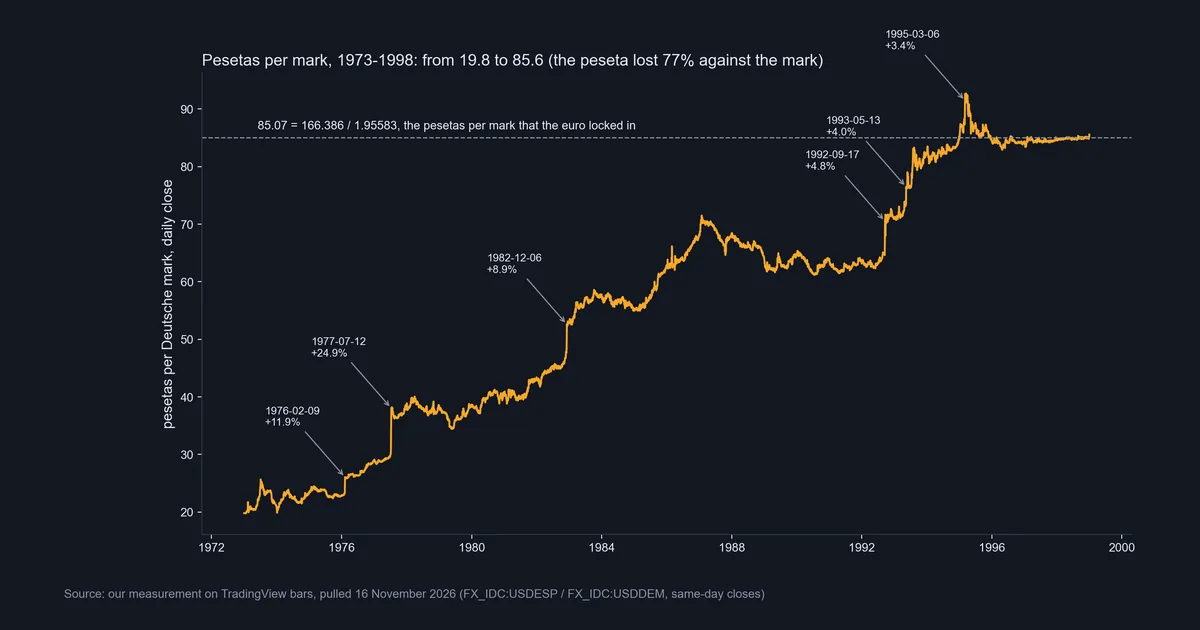
This chart divides USD/ESP by USD/DEM on each date from 1973 to 1998. The line runs from 19.809 to 85.559 pesetas per mark, so the peseta lost 76.8% of its mark value. Most of the climb came in steps rather than a drift. The arrows mark six of the largest one-day rises: 9 February 1976 (+11.9%), 12 July 1977 (+24.9%), 6 December 1982 (+8.9%), 17 September 1992 (+4.8%), 13 May 1993 (+4.0%) and 6 March 1995 (+3.4%).
Between the steps, the line often sat still or slipped back. From 1988 to mid-1992 it stayed between about 61 and 69, a calm stretch that overlaps the first ERM years. Then the steps of 1992 to 1995 lifted it above 90 for a short time in March 1995. After that it fell back and hugged the dashed 85.07 line. The year-end closes for 1995 to 1998 were 84.629, 84.396, 84.709 and 85.559. Each sits within 0.8% of the rate the euro would lock in. In other words, the cross had settled on the euro’s number before 1999 arrived.
Our measurement: the peseta year by year
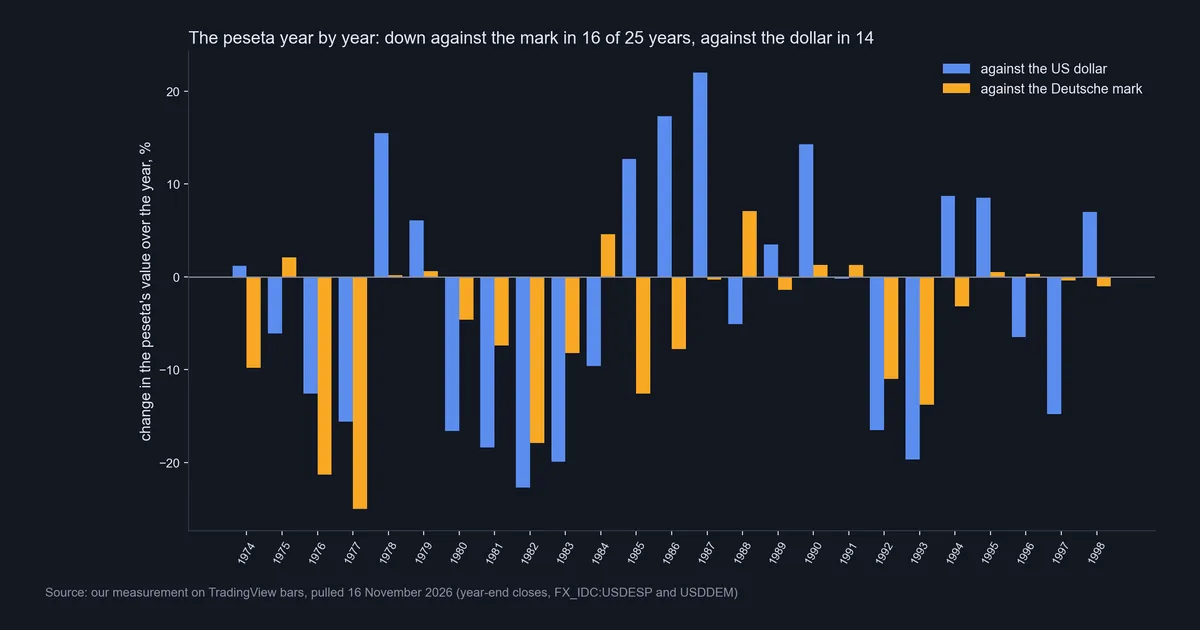
This chart sets each year’s change in the peseta’s value against the dollar (blue) and the mark (gold), from 1974 to 1998. The peseta fell against the mark in 16 of the 25 years, and against the dollar in 14. The two bars often point opposite ways, because the dollar and the mark also moved against each other.
Its worst run came from 1980 to 1983, when the peseta lost 16.6%, 18.4%, 22.7% and 19.9% against the dollar. The best came from 1985 to 1987, at +12.7%, +17.3% and +22.0%. Yet in 1985 the peseta still lost 12.6% against the mark. So a good dollar year often reflected a weak dollar more than a strong peseta. Then 1992 and 1993 brought losses on both bars, which matches the ERM cuts above.
Download the complete indicator database
Put these concepts on your charts. One email unlocks the full library of 1,380+ indicators with compiled MT4 and MT5 files, plus my TradingView scripts. No paywall, no spam, unsubscribe any time.
Get free access to my indicator database
One email unlocks 1,380+ free MT4, MT5 and TradingView indicators — the complete library. No single-tool download; you get the whole database.
Where it fails
The data tells a clear story, but it has limits we could not remove.
- A vendor quote, not an official rate. FX_IDC shows where a data vendor’s quotes sat. That differs from the Banco de España’s official rate, and nobody stood ready to deal at those prints.
- A size screen misses events. Our list holds the ten largest one-day rises. The 23 November 1992 cut from the Hansard answer does not make it, so the list is no full calendar of realignments.
- Dates can differ by a day. Hansard dates the first ERM cut to 16 September 1992, while our close shows it on 17 September.
- A cross has two legs. Pesetas per mark comes from two dollar quotes. A jump can start on either side, so a big day on the cross does not prove a Spanish event. For instance, we can name no cause for the 3.35% rise on 24 September 1992.
- The line after 1998 is not a market. It tracks 166.386 / EUR/USD within a median 0.065%, with gaps up to 0.71% from feed noise.
- No cause in the numbers. Data gives size and date. We name a cause only where a source does.
The line after 1998: a fixed slice of the euro
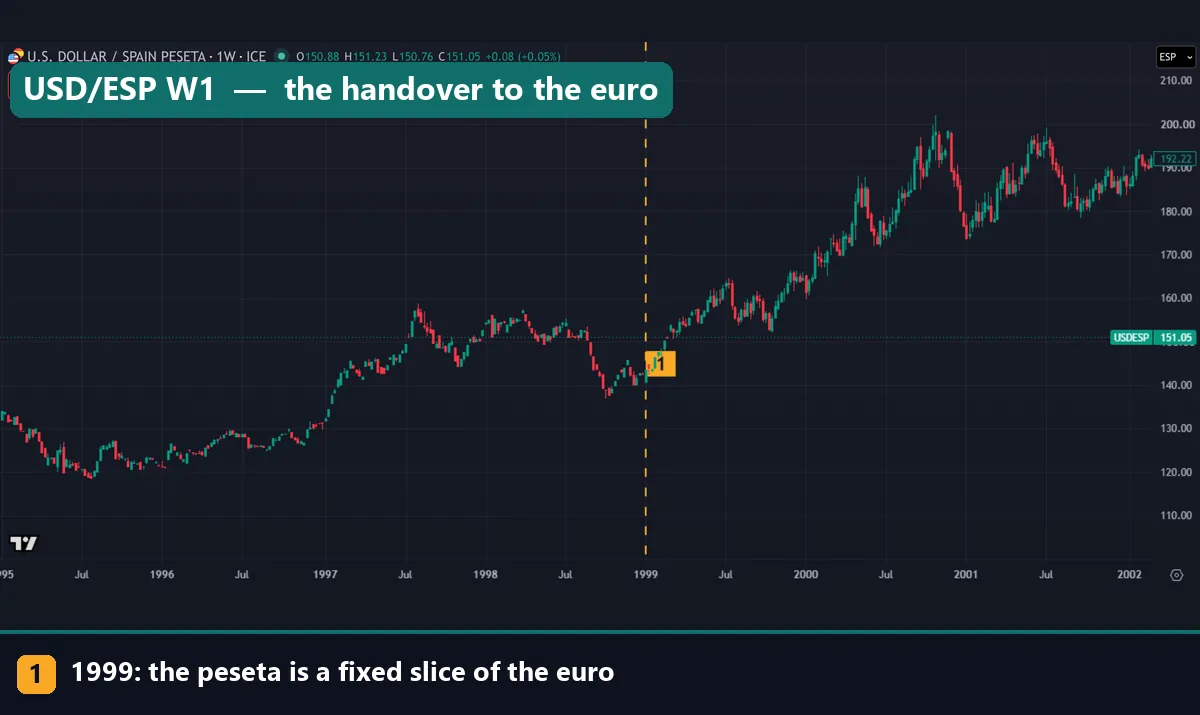
This weekly chart covers 1995 to early 2002. Before the dashed 1999 line, the peseta moves between about 118 and 160 per dollar. After it, the line keeps going and climbs to about 200 in late 2000. That looks like a peseta crash, but the peseta had no price of its own by then. Instead, the euro fell against the dollar, and the feed simply divides 166.386 by EUR/USD.
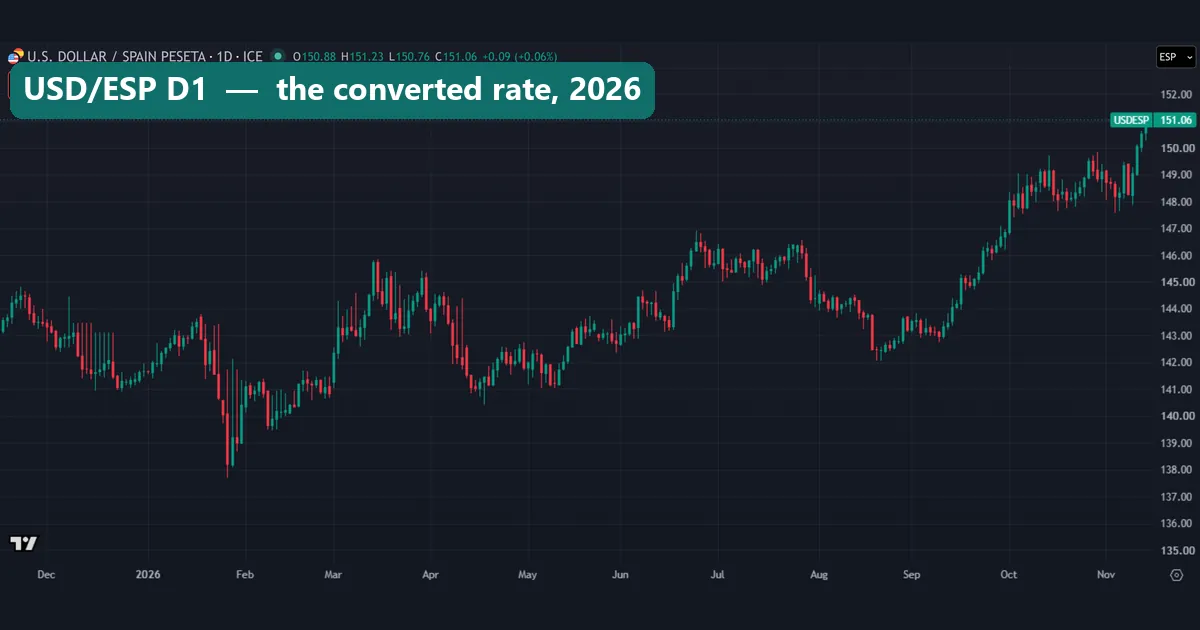
The last chart shows the daily feed for the year to 13 November 2026. It swings from a low near 138 in late January 2026 to 150.97 on our last settled close. Each of those moves is EUR/USD turned upside down. On 13 November the implied euro rate came to 1.1021 dollars.
So this is not a live currency. A signal drawn on USD/ESP today is a signal on EUR/USD, one of the major currency pairs. Also, the SELL and BUY boxes at the top left show the forming quote on capture day, not a peseta price.
Common mistakes with peseta charts
- Reading the post-1999 line as the peseta. Since 1 January 1999 the series is a conversion. A “record” on it in 2000 is a euro record.
- Getting the direction backwards. USD/ESP counts pesetas per dollar. Up means a weaker peseta, and down means a stronger one.
- Calling every jump a devaluation. Some big days on the cross have no official event behind them that we can find. Check a source before you name one.
- Assuming old notes still swap at 166.386. The Banco de España’s deadline passed on 30 June 2021. The rate remains a legal figure, not a cash offer.
Where to go next
The mark ran beside the peseta for this whole story. Our guide to German money before the euro measures it with its own sources. For another currency tied to the euro today, see our BGN currency guide.
Inflation and interest rates are two common drivers of long currency declines, and our pages on how inflation affects forex and how interest rates affect forex cover them. For the dollar side of every chart here, read our note on the dollar index in forex.
To set the peseta’s fall against today’s extremes, see the weakest currency in the world and the most valuable currency in the world. Finally, to see where the euro sits among today’s big currencies, try our G10 currencies guide.
FAQ about the Spanish currency before the euro
What was the Spanish currency before the euro?
It was the peseta. According to the Banco de España, a Government Decree of 19 October 1868 made it the basic unit of Spain’s money.
How many pesetas made one euro?
One euro equals 166.386 pesetas. The EU Council set that rate with effect from 1 January 1999, and it never changed.
When did Spain stop using the peseta?
Euro cash arrived in 2002. The Banco de España says pesetas circulated alongside it until 28 February 2002.
Can I still exchange pesetas for euro?
Not at the Banco de España. Its deadline for swapping pesetas for euro was 30 June 2021.
How much was a peseta worth in dollars?
In our data it bought 1.575 US cents on 2 January 1973 and 0.702 cents on 31 December 1998.
Why does TradingView still show a USD/ESP rate?
The feed divides 166.386 by EUR/USD. On 13 November 2026 it printed 150.97, which is a euro rate in peseta units.
How often did Spain devalue the peseta inside the ERM?
Hansard records cuts of 5 per cent on 16 September 1992 and 6 per cent on 23 November 1992. Wikipedia counts three in the early 1990s, and our data shows the third on 13 May 1993.
Will the peseta come back?
We make no forecast. The ECB release calls the 1999 rates irrevocable, and our charts only record the past. Treat every figure here as history: results are not guaranteed; past performance is not indicative of future results.
Last updated: 16 November 2026.

About the author
Written by Dominic Walsh, a Forex trader and MT4/MT5 indicator, Expert Advisor and script developer. Every tool on forexmt4systems.com is tested on live charts before release and ships with ready-to-use compiled MT4 (.ex4) and MT5 (.ex5) files. Learn more about the trader and developer behind this site.
How we build, test and correct every tool: Editorial & Testing Policy. Trading carries risk; see the disclaimer.