
The three drives pattern is a reversal shape built from three pushes in one direction, each to a new extreme, with two pullbacks in between. This guide settles one question: does it tell you anything on forex charts? We explain the ratios, walk through six real charts, and report what followed every case our scan found in eight years of daily MT4 history, plus recent hourly data. The short answer is that we found too few cases to know.
What the three drives pattern is
The pattern has six points: a start, then drive 1, retrace 1, drive 2, retrace 2 and drive 3. In a bullish version the drives fall, each to a new low, and traders expect a turn up after the third. A bearish version is the mirror: three higher highs, then an expected turn down.
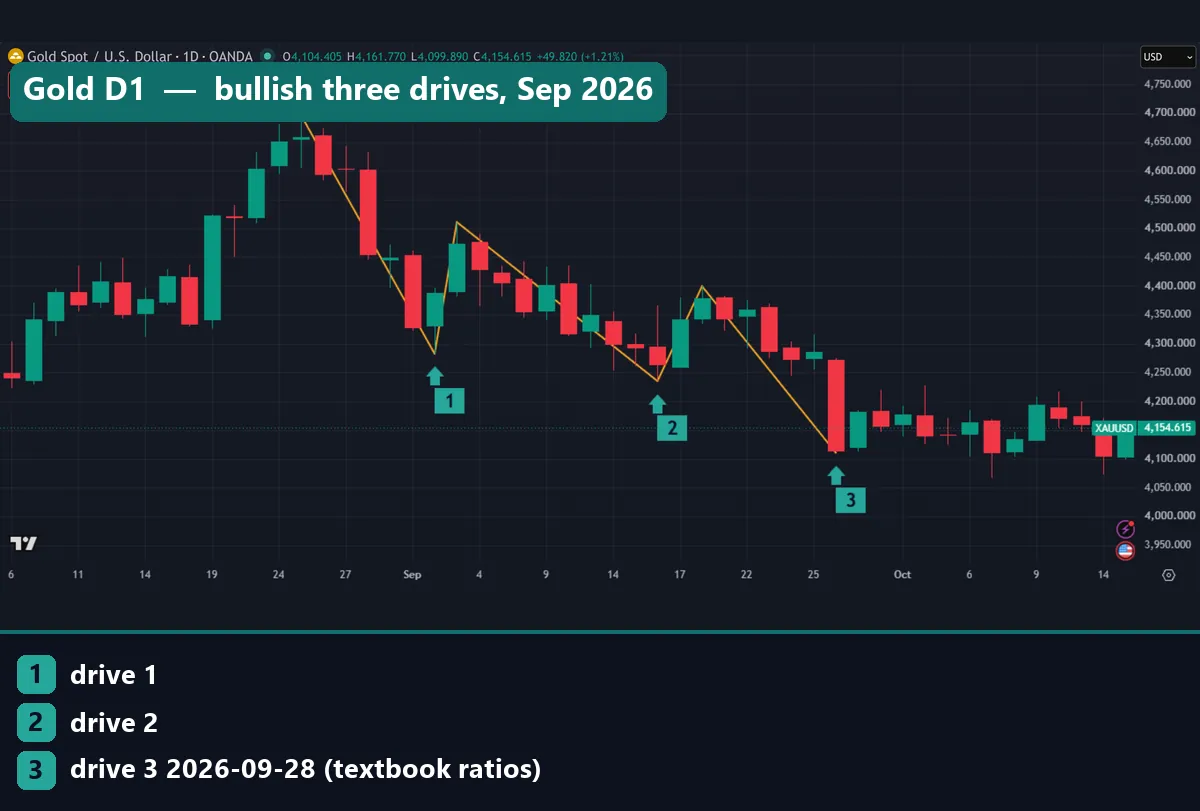
The gold chart above shows a bullish case from our scan. XAUUSD fell from $4,697.105 on 25 August 2026 to drive 1 at $4,282.625 on 2 September. Drive 2 followed at $4,235.165 on 16 September and drive 3 at $4,110.87 on 28 September. After that, gold went mostly sideways. On 15 October it traded at $4,157.465, about $47 above drive 3.
The shape belongs to the harmonic family, next to the Gartley and the bat, as our list of harmonic patterns shows. It also looks like a five-wave impulse from Elliott wave theory, with the drives as waves 1, 3 and 5.
How the three drives pattern works: ratios and symmetry
Each check compares one leg with the leg before it. A retracement ratio measures how much of a drive the next pullback gives back. An extension ratio measures how far the next drive runs, as a multiple of that pullback.
TradingView’s help page for its three drives drawing tool gives the usual numbers. Pullbacks are typically 61.8% or 78.6%, or only 38.2% or 50% in a strong trend. Drives 2 and 3 should extend 127.2% or 161.8% of the pullback before them.
Take a bearish pattern with start low S, drive highs D1 to D3 and pullback lows R1 and R2. The four checks:
ret1 = (D1 - R1) / (D1 - S)ext2 = (D2 - R1) / (D1 - R1)ret2 = (D2 - R2) / (D2 - R1)ext3 = (D3 - R2) / (D2 - R2)
A bullish pattern flips them. To map the target zone, anchor a Fibonacci tool from the end of a drive to the end of its pullback. The 127.2 and 161.8 levels then sit beyond the drive. Our guide on how to draw a Fibonacci extension shows the steps, and Fibonacci retracement vs extension compares the tools.
The TradingView page also stresses time: the two pullbacks should take about the same number of bars. It calls the pattern rare for that reason and warns against forcing it. Our scan did not check time.
How we tested
We used Capital Point Trading MetaTrader 4 history, build 1471, read from the terminal’s history files. The daily test covered 23 FX pairs from 12 June 2018 to 24 August 2026. The hourly test used EURUSD, GBPUSD and USDJPY from 22 December 2025 to August 2026, plus XAUUSD from 1 July 2025 to 20 August 2026.
First, we marked swings with a 3-bar pivot: a high, or low, that beats the three bars on each side. Next, we looked for six alternating swings within 120 bars, where each drive made a new extreme. Pullbacks had to retrace 0.5 to 0.8 of the drive before them, and drives 2 and 3 had to extend 1.13 to 1.8 times their pullback. That is the textbook 1.27 to 1.618 zone, widened. Our ZigZag formula guide covers the same swing-width choice.
A 3-bar pivot needs three more bars to confirm, so we measured from 3 bars after drive 3. Then we checked whether the close 5 and 10 bars later had moved the expected way. Moves are in units of ATR(14), the average true range on Wikipedia, so pairs compare fairly. All figures are before spread, swap and commission.
The six price charts come from the TradingView web chart with OANDA data, captured on 15 October 2026. Our editorial testing policy explains how we pick data and report results.
Three drives settings and parameters
A hand-drawn pattern has no inputs, only ratio bands. Charts marked “textbook ratios” used our test rule. Charts marked “wide ratios” used a looser rule, which our chart script falls back to only when the test rule finds nothing.
| Parameter | Textbook (TradingView help) | Our test | Our wide chart rule |
|---|---|---|---|
| Pullbacks | 61.8% or 78.6%; 38.2% or 50% in strong trends | 0.5 to 0.8 | 0.38 to 0.9 |
| Drives 2 and 3 vs the pullback before | 127.2% or 161.8% | 1.13 to 1.8 | 1.0 to 2.0 |
| Time symmetry | Important | Not checked | Not checked |
| Swing detection | Trader’s judgment | 3-bar pivots | 3-bar pivots |
| Maximum span | Not fixed | 120 bars | Not limited |
| Signal point | End of drive 3 | 3 bars after drive 3 | Chart marks only |
So “textbook” on our labels means the widened band, not an exact 1.27 or 1.618. In the gold chart, drive 2 extended only 1.21 times its pullback. Also, our three drive harmonic pattern indicator uses a wider extension band by default, so it draws looser patterns unless you narrow it.
Reading a three drives pattern on a chart
Start with the trend. A top needs a rise with higher highs, and a bottom needs a fall. Then count three new extremes and two clear pullbacks.
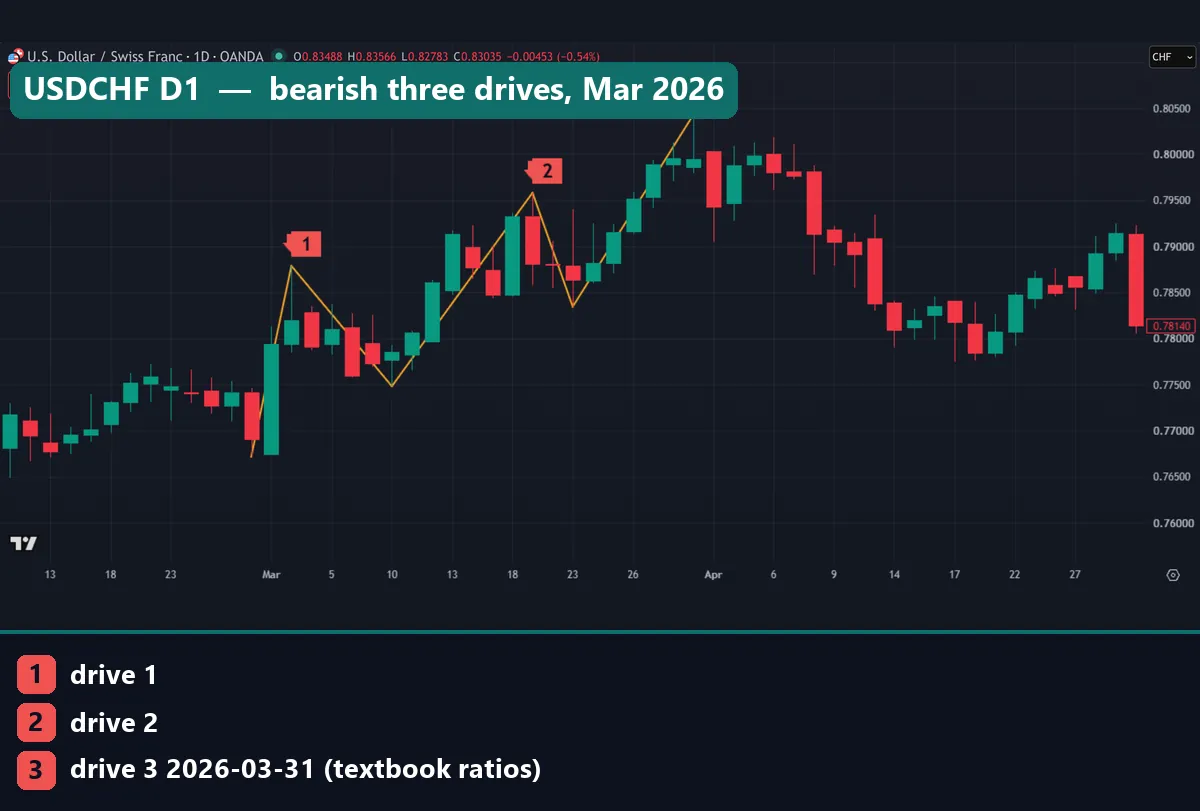
The USDCHF daily chart shows the cleanest case in this set. Three red markers sit on three rising highs in March 2026, and marker 3 says “textbook ratios”. The three drive legs also look close to equal, which is the first thing most traders scan for.
After a candidate drive 3, wait for the swing to confirm. Until then drive 3 can keep going, and a pattern that looked finished turns into a longer trend.
A weak case: when drive 3 barely moves
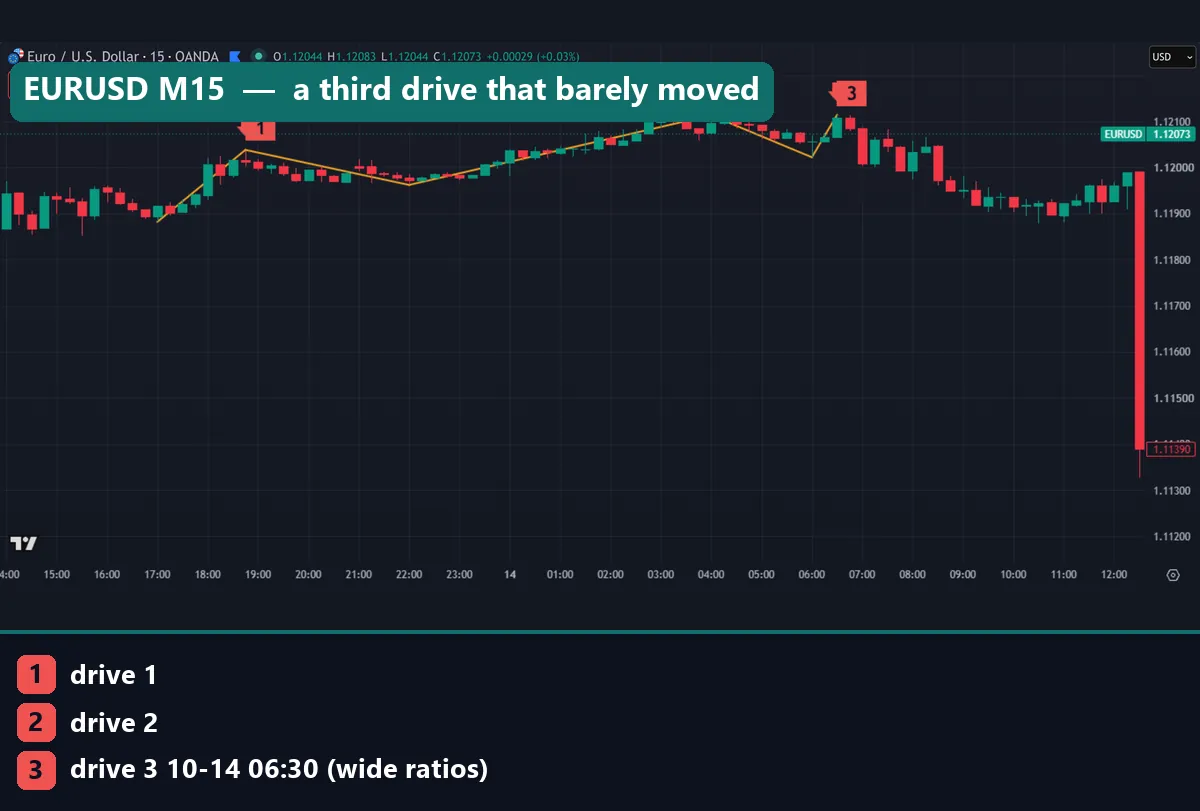
The EURUSD M15 chart shows what a loose rule lets in. Our test rule found nothing here, so marker 3 says “wide ratios”. Drive 2 printed at 1.12113 at 04:00 UTC on 14 October 2026, already 1.99 times its pullback. Drive 3 came at 06:30 UTC at 1.12114, only 0.1 pip higher, an extension of 1.01. In plain terms, this is a double top with a third label.
Price slid to about 1.1190 between 09:00 and 11:00 UTC. Then a long red bar at 12:30 UTC dropped below 1.1140. Still, that came six hours after drive 3, and nothing in the pattern explains it.
Worked example: USDCHF daily, March 2026
Here are the six pivot points from the second chart.
- Start: 0.76716 on 27 February 2026.
- Drive 1: 0.78788 on 3 March.
- Retrace 1: 0.77482 on 10 March.
- Drive 2: 0.79582 on 19 March.
- Retrace 2: 0.78345 on 23 March.
- Drive 3: 0.80427 on 31 March.
Drive 1 rose 207.2 pips. Retrace 1 gave back 130.6 pips, or 0.63, close to 61.8%. Then drive 2 rose 210.0 pips, 1.61 times the pullback. Next, retrace 2 gave back 123.7 pips, or 0.59. Drive 3 rose 208.2 pips, 1.68 times that pullback. So the legs nearly match: 207.2, 210.0 and 208.2 pips.
You could have mapped the end zone early. From the retrace 2 low at 0.78345, 1.272 times the 123.7-pip pullback points to about 0.7992, and 1.618 times to about 0.8035. Drive 3 topped at 0.80427, about 8 pips past that level.
Time was less tidy. Retrace 1 took seven calendar days, but retrace 2 took four. What came next? The chart shows price below 0.7800 by mid-April, more than 240 pips under drive 3, then back above 0.7900 late in the month. However, one clean case is not a result.
What our three drives pattern test found
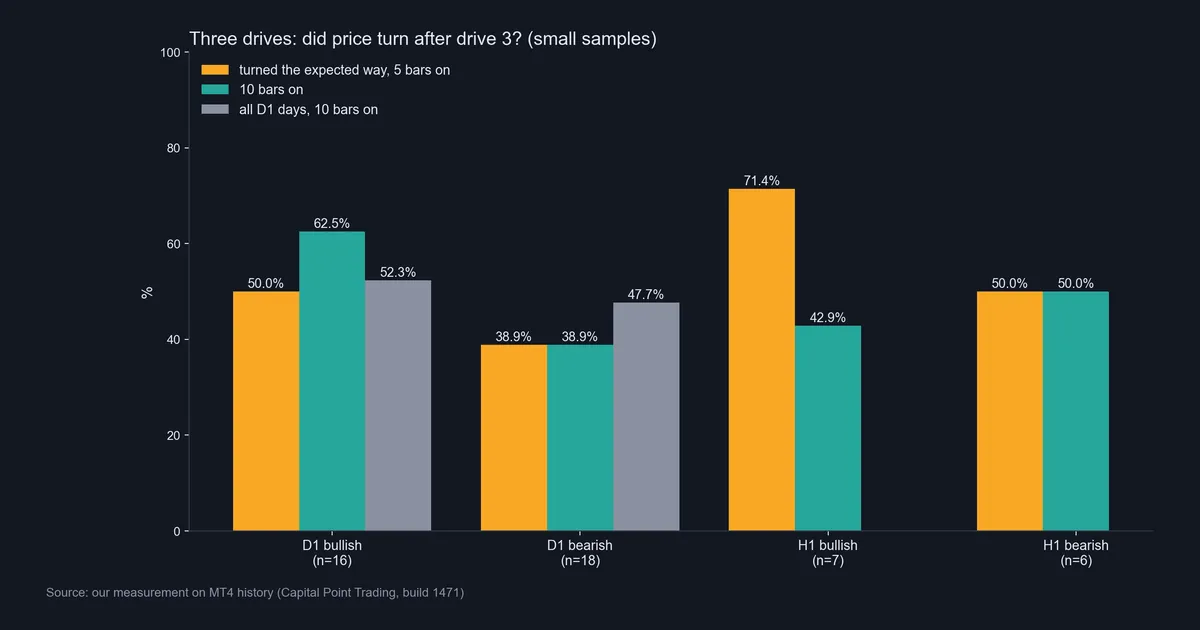
Our scan found 16 bullish and 18 bearish cases on daily FX: 34 patterns across 23 pairs in about eight years.
After bullish cases, the close 5 bars later was higher 50.0% of the time, with a median move of +0.07 ATR. Ten bars later, 62.5% were higher, with a median of +0.33 ATR. For comparison, all daily bars closed higher 10 days later 52.3% of the time.
That 62.5% means 10 cases out of 16, and each case moves it by 6.25 points. If two of the ten had closed lower, it would read 50.0%.
Bearish cases did worse. Only 38.9% closed lower after 5 bars and after 10. All days closed lower 10 days later 47.7% of the time. The median moves were -0.06 and -0.21 ATR, so price drifted against the pattern.
The hourly sample is smaller: 7 bullish and 6 bearish. Bullish ones were higher 71.4% of the time after 5 bars but 42.9% after 10, and bearish ones split 50.0%. We read this as noise. Our note on backtest sample size explains why.
An hourly example: GBPUSD H1
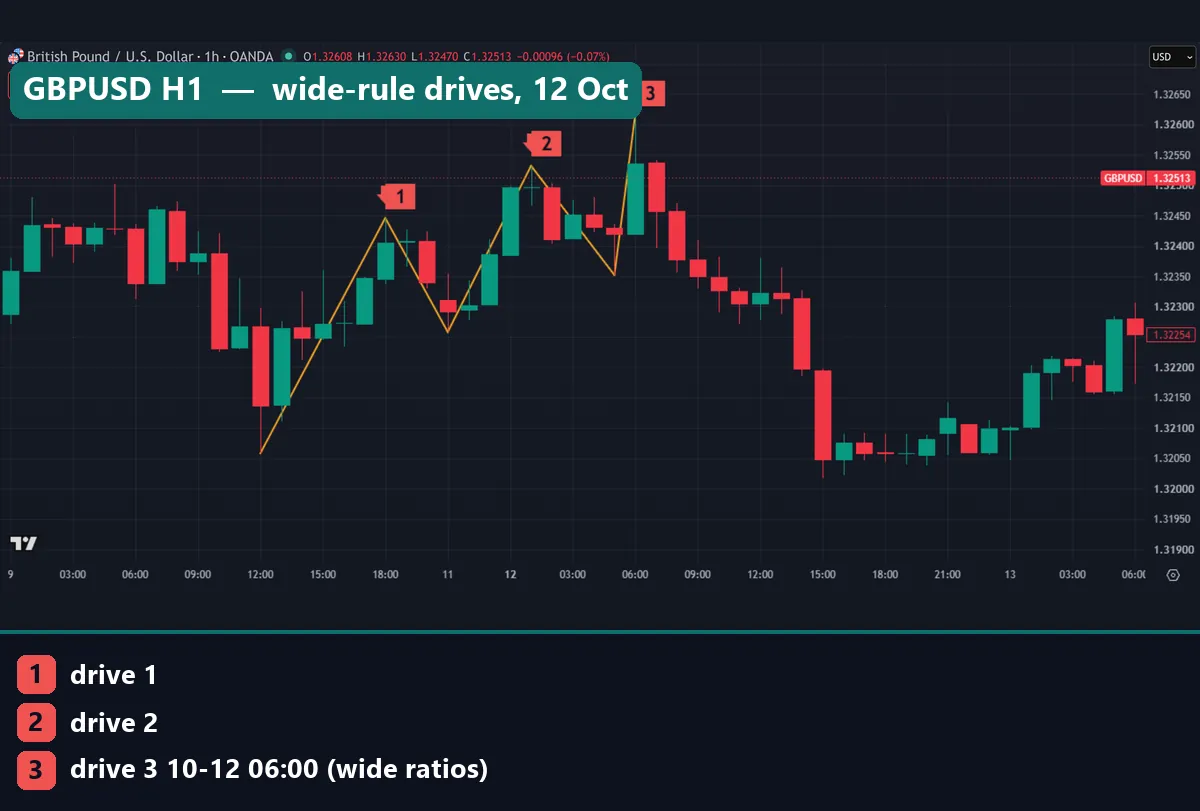
The GBPUSD H1 chart shows a bearish case under the wide rule. Its first pullback was only 0.48 of drive 1, under our 0.5 floor. The drives came at 1.32446 on 9 October 2026, 1.32532 at 01:00 UTC on 12 October, and 1.32616 at 06:00 UTC. Retrace 1 printed on Sunday 11 October, so the pattern spans a weekend.
After drive 3, price slid to near 1.3205 by 15:00 UTC. That looks like a success. Still, it is one loose case, easy to collect after the fact.
Download the complete indicator database
Put these concepts on your charts. One email unlocks the full library of 1,380+ indicators with compiled MT4 and MT5 files, plus my TradingView scripts. No paywall, no spam, unsubscribe any time.
Get free access to my indicator database
One email unlocks 1,380+ free MT4, MT5 and TradingView indicators — the complete library. No single-tool download; you get the whole database.
Where it fails
- It is rare. Our test rule found 34 daily cases on 23 pairs in eight years. That is too few to separate an edge from luck.
- The ratio bands stretch. Every widening admits more patterns, and each one means less. A drive 3 at 1.01 times its pullback is not a third drive. Tuning bands until results look good is curve fitting.
- The swings come from hindsight. StockCharts ChartSchool’s ZigZag article notes that the latest swing line is temporary and that the tool has no predictive power. This pattern shares that problem.
- Drive 3 can keep going. A strong trend adds a fourth push, and the pattern has no rule for that.
- Bearish daily cases went the wrong way more often than not.
- Costs come on top. Spread, swap and commission only make results worse; see backtesting transaction costs.
Two charts where the turn did not last
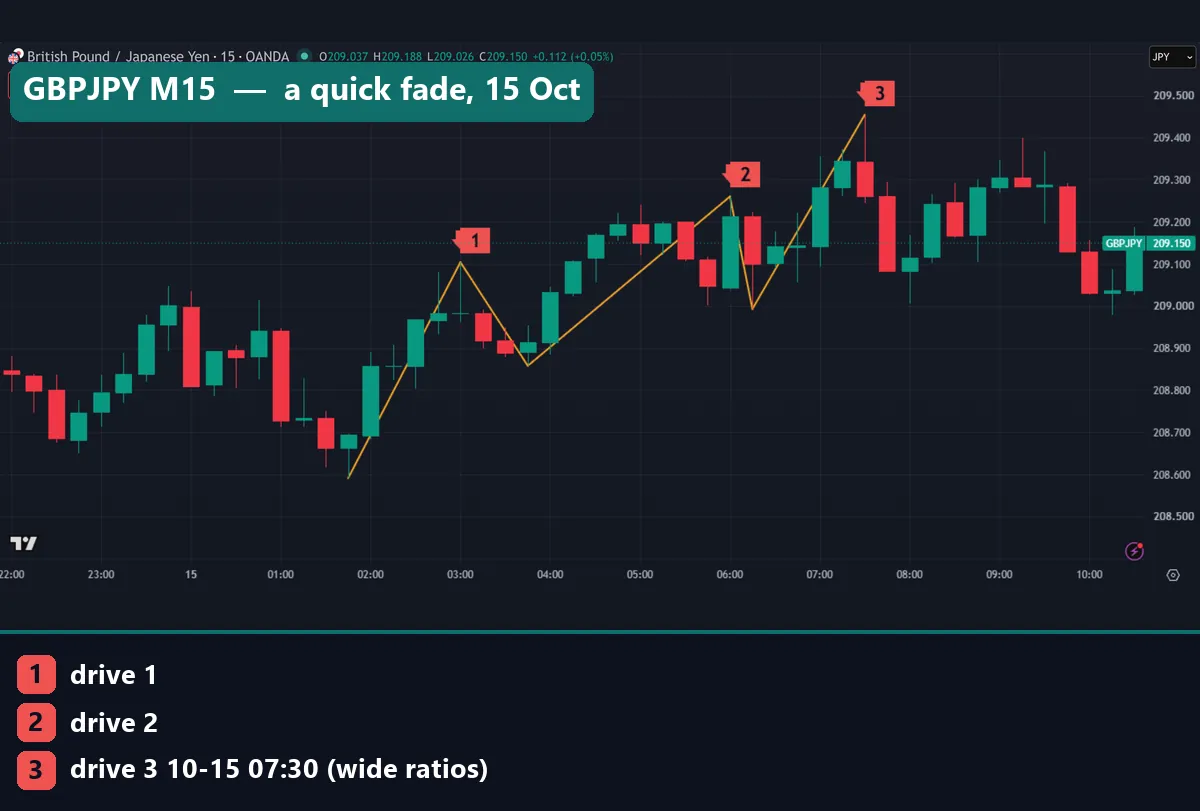
The GBPJPY M15 chart is another wide-rule bearish case. Drive 3 printed at 209.454 at 07:30 UTC on 15 October 2026, and price dropped to near 209.00 by 08:15. However, by 09:30 UTC it traded back near 209.30, above drive 2’s high of 209.26. The pattern gave a dip, not a turn.
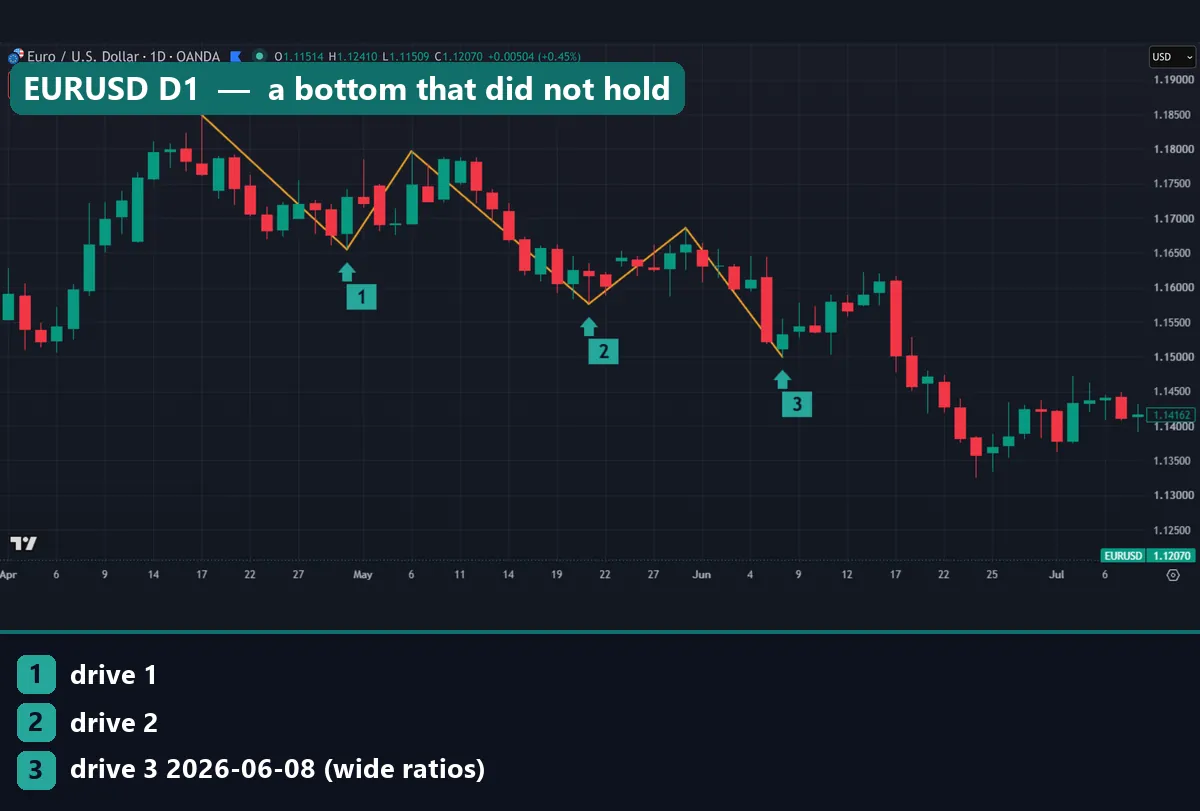
The EURUSD daily chart shows a bottom that failed. The drives ended at 1.14997 on 8 June 2026. It missed our test rule only because retrace 2 came to 0.497 of drive 2. Price bounced to near 1.1600 by mid-June, then fell below 1.1400, under the drive 3 low. In effect, the market added a fourth drive.
Common mistakes with the three drives pattern
- Forcing it. Any trend has pushes. If you must bend a ratio to make it fit, move on.
- Acting before drive 3 is a swing. Until later bars confirm it, drive 3 can extend, and your “end of trend” becomes the middle of one.
- Counting an equal high as a drive. A drive 3 just 0.1 pip past drive 2, as on EURUSD M15, is a double top.
- Trusting a clean example. The USDCHF case looks perfect, but one case proves nothing. If you trade it anyway, size the stop from volatility, as in our guide to ATR stop-loss distance.
Where to go next
Our harmonic pattern cheat sheet puts every harmonic ratio on one page. The shark pattern guide runs the same kind of test on another harmonic shape. For a second filter at drive 3, see RSI divergence explained; we did not test it here.
To draw the levels in MetaTrader, the Fibonacci Retracement page in the MetaTrader 5 help lists the default levels. It includes 161.8 but not 127.2, so add that one yourself.
FAQ: the three drives pattern
What is the three drives pattern?
It is a reversal shape with three pushes in one direction, each to a new extreme, and two pullbacks between them. It assumes the third push is the last.
What ratios define a three drives pattern?
TradingView’s help lists pullbacks of 61.8% or 78.6% and drives of 127.2% or 161.8% of the pullback before. Our test widened those to 0.5 to 0.8 and 1.13 to 1.8.
Is the three drives pattern bullish or bearish?
Either. Three falling drives make it bullish, and three rising drives make it bearish. On our daily data the bullish group did slightly better than all days, and the bearish group did worse.
How is it different from an AB=CD pattern?
An AB=CD has two pushes and one pullback. Three drives adds a second pullback and a third push, so it reads like two AB=CD shapes that share a leg.
Which timeframe suits the three drives pattern?
We cannot rank them. We found 34 daily and 13 hourly cases, too few for a stable result. Our charts range from 15-minute to daily, and the shape looks the same on each.
Does time symmetry matter?
TradingView’s help says it does. We did not test it. In our USDCHF example the price ratios came close to textbook, yet the pullbacks took seven and four calendar days.
Can I find three drives automatically in MT4?
Yes. Our three drive harmonic pattern indicator marks them on MT4 and MT5 from confirmed swings, so each mark appears a few bars after drive 3.
Does the three drives pattern work in forex?
On our MT4 data we found no clear edge. Daily bullish cases beat the base rate on 16 examples, and bearish cases lagged it on 18. Test any rule on your own data first, because results are not guaranteed; past performance is not indicative of future results.
Last updated: 15 October 2026.

About the author
Written by Dominic Walsh, a Forex trader and MT4/MT5 indicator, Expert Advisor and script developer. Every tool on forexmt4systems.com is tested on live charts before release and ships with ready-to-use compiled MT4 (.ex4) and MT5 (.ex5) files. Learn more about the trader and developer behind this site.
How we build, test and correct every tool: Editorial & Testing Policy. Trading carries risk; see the disclaimer.