
The 3 inside pattern, also called three inside up and down, is a three-candle reversal signal: a harami followed by a candle that closes past the first candle’s open. This guide settles two things. First, it shows exactly how three inside up and three inside down form. Then it shows what happened after the pattern on eight years of daily forex data and a year of 15-minute bars. The short answer is not flattering. In our test, the pattern moved its own way less often than an average bar did.
What the three inside pattern actually is
Three inside up and three inside down are classic Japanese candlestick patterns. Each one has three candles. The first two form a harami, and the third confirms it. So you can read the whole pattern as “harami plus a confirmation close.”
Three inside up is the bullish version. It appears after a fall. First comes a large bearish candle. Next comes a smaller bullish candle whose body sits inside the first body. Then a third candle closes above the open of the first candle. That last close is the point of the pattern, because it shows buyers took back the whole first candle.
Three inside down is the mirror. It appears after a rise. A large bullish candle comes first, then a small bearish candle inside its body. Finally, a third candle closes below the first candle’s open.
If the harami part is new to you, read our page on the harami candlestick pattern first. The idea is also close to an inside bar, but a harami only compares bodies, not wicks. Thomas Bulkowski keeps a separate page on three inside up at ThePatternSite, with his own stock-market counts.
How three inside up and down form, step by step
Here is the bullish case, in order.
- Candle 1: a bearish candle with a large body. “Large” needs a number, so we measured it against ATR.
- Candle 2: a bullish candle whose open and close both sit inside candle 1’s body. Its wicks may poke out.
- Candle 3: a candle that closes above candle 1’s open.
There is no formula, but the logic is simple. Candle 1 shows strong selling. Candle 2 shows the selling stopped, because price could not even make a new body low. Then candle 3 erases the whole of candle 1.
The bearish case flips every step. Candle 1 is a large bullish body, candle 2 is a small bearish body inside it, and candle 3 closes below candle 1’s open. Many traders also want a clear trend first. Our rule did not demand that.
The pattern shares DNA with the engulfing candle. In fact, candles 2 and 3 together often look like a bullish engulfing bar. The harami entry on Wikipedia lists the three inside patterns as confirmed haramis for that reason.
How we tested the 3 inside pattern
We ran two tests. Both used MetaTrader 4 history from Capital Point Trading, MetaTrader 4 build 1471, read straight from the terminal’s .hst files. The full method sits in our editorial testing policy.
- Daily test: 23 forex pairs on D1, from 12 June 2018 to 24 August 2026.
- Intraday test: M15 bars on EURUSD, GBPUSD, USDJPY and XAUUSD, from June 2025 to August 2026.
For each pattern, we checked one thing. Was the close N bars later beyond the third candle’s close, in the pattern’s direction? On D1 we checked 1, 3 and 5 bars later. On M15 we checked 1, 4 and 8 bars later.
Then we ran the same check on every bar in the data. That gives a base rate, and a pattern only matters if it beats it.
Next, we took chart examples on the TradingView web chart on 9 October 2026, using OANDA data. They illustrate the shape. However, single cases prove nothing on their own.
These are direction checks, not trades. No spread, swap or commission went into them.
The rule we coded: settings table
Candlestick books describe the pattern in words, but code needs numbers. So here is the exact rule our scanner used.
| Parameter | Our setting | Why it matters |
|---|---|---|
| Candle 1 body size | At least 0.6 ATR | Filters out small first candles that carry little meaning |
| Candle 2 body | Open and close inside candle 1’s body | This is the harami part; wicks may stick out |
| Candle 2 colour | Opposite to candle 1 | Shows the first move stalled |
| Candle 3 close | Beyond candle 1’s open | The confirmation that defines “three inside” |
| Trend filter | None | Keeps the test simple; a filter could change results |
| Horizons, D1 | 1, 3 and 5 bars | Next day, half a week, a full week |
| Horizons, M15 | 1, 4 and 8 bars | 15 minutes, one hour, two hours |
| Costs | None included | Results are before spread, swap and commission |
If ATR is unfamiliar, it is the average size of recent bars. Measuring body size against ATR keeps the rule fair across quiet and busy markets.
Reading three inside up on a live chart
On a chart, look for a “big candle, small candle, big candle” rhythm with the colours red, green, green (or green, red, red for the bearish case). Then check the last close against the first candle’s open. If it does not clear that open, you only have a harami.
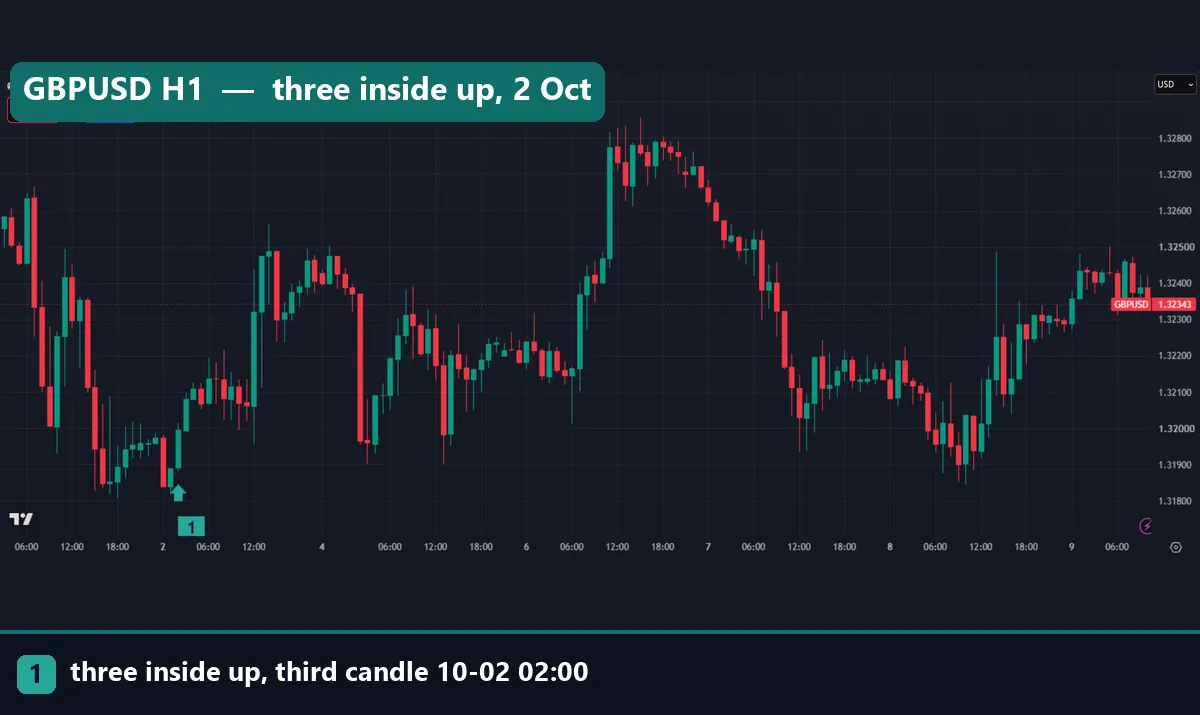
This GBPUSD one-hour chart shows a three inside up that finished at 02:00 UTC on 2 October 2026. The third candle opened at 1.31892 and closed at 1.31996. Its low was 1.31884. Price then climbed through the rest of the session. Later on the chart, it trades up near 1.32500. So this case worked out, at least for a while.
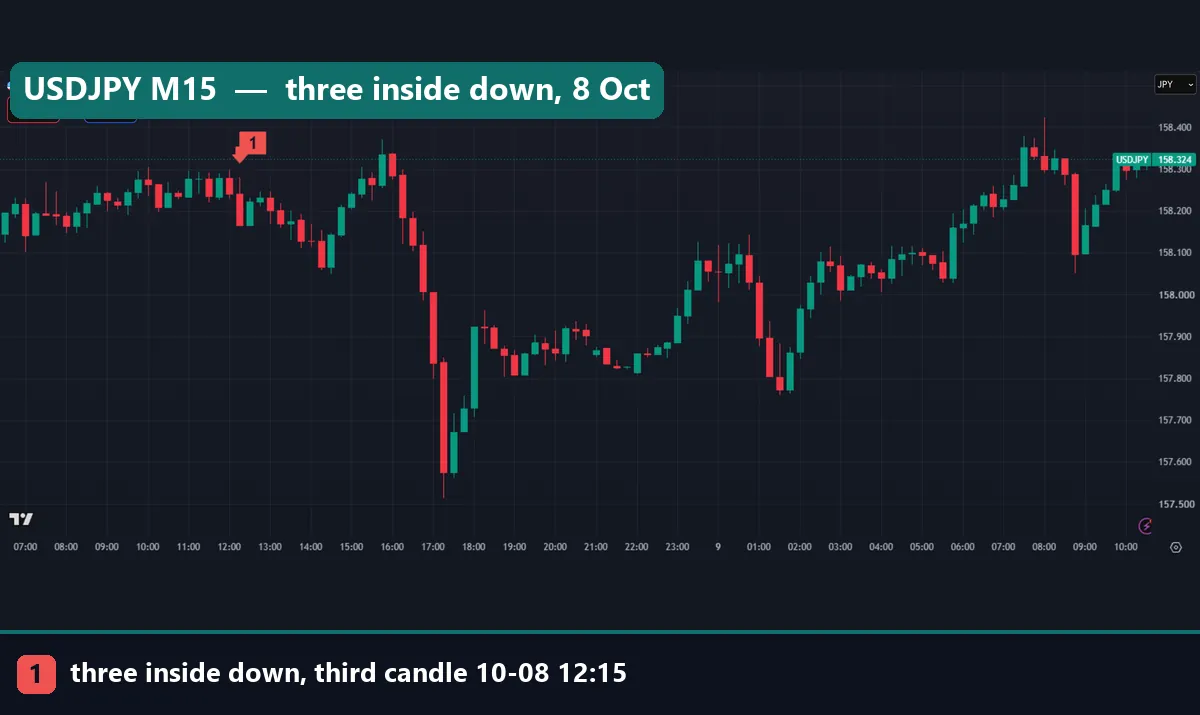
The USDJPY 15-minute chart shows the bearish version. The third candle closed at 12:15 UTC on 8 October 2026. It opened at 158.24, reached 158.28 and closed at 158.166. But look at what came next. Price first rallied past that high to about 158.37 around 16:00. Only then did it drop hard toward 157.50. So a stop above the pattern high would have closed the trade before the fall. The direction call was right, but the path still hurt.
Worked example: EURUSD daily, August 2026
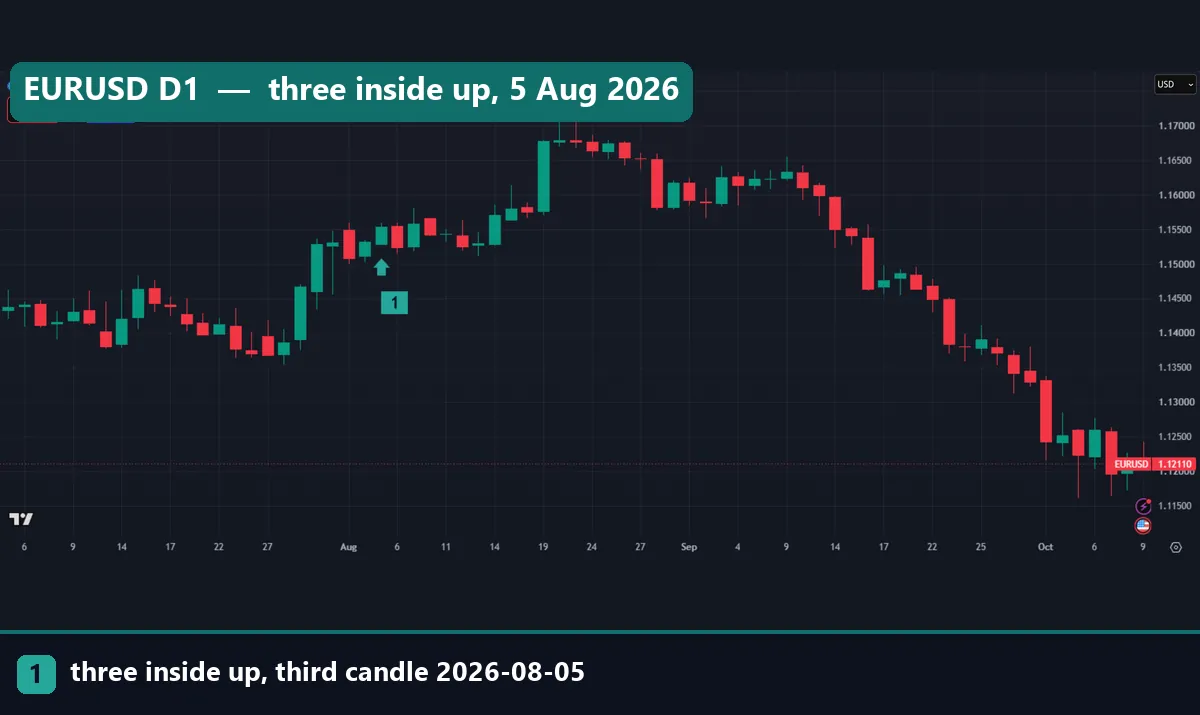
Our first chart shows a three inside up on EURUSD daily. The first candle printed on 3 August 2026, and the third candle closed on 5 August 2026. Here are the numbers for that third candle, from our TradingView data.
- Open: 1.15286
- High: 1.15594
- Low: 1.15268
- Close: 1.15534
So the third candle gained 24.8 pips from open to close. Its full range, from low to high, was 32.6 pips. That close also sat above the first candle’s open, which is what made the pattern count.
Price then chopped for about a week. Then a large green candle on 19 August lifted EURUSD toward 1.17000. For a buyer, that looks like a clean signal.
Still, keep reading the chart. From mid-September, price fell steadily. By 9 October it traded near 1.12100, well below the pattern. So a trader who held without a plan gave everything back and more.
A single case shows a shape, not an edge. To judge the pattern, you need hundreds of cases.
What 23 pairs of daily data showed
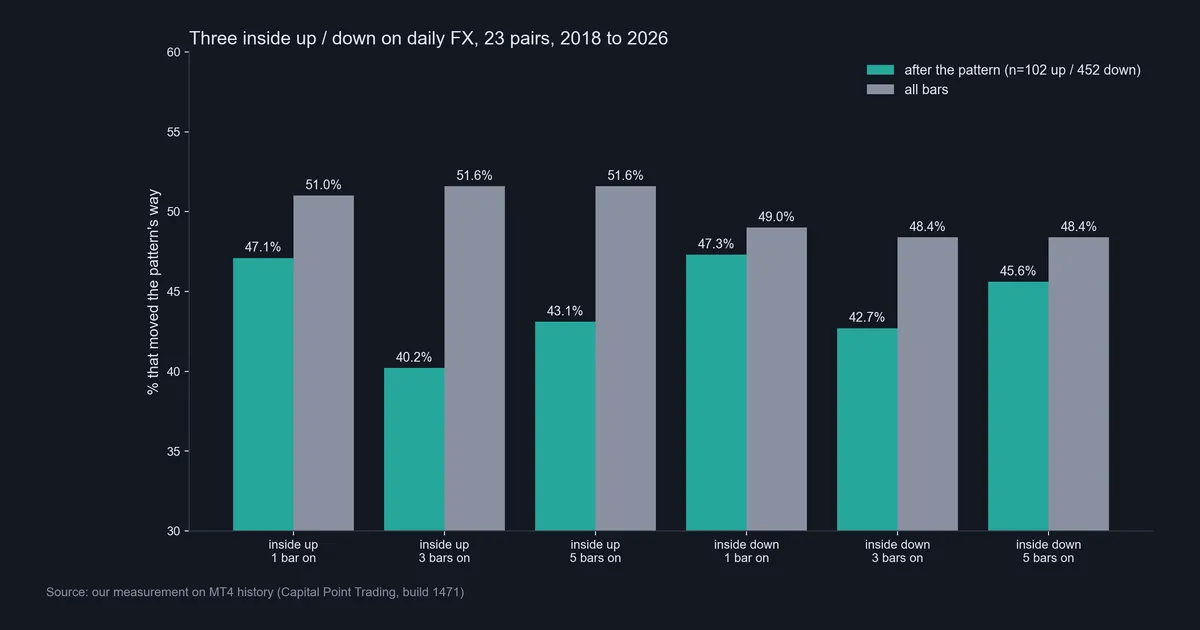
Our scanner found 102 three inside up patterns and 452 three inside down patterns on daily charts. We cannot fully explain the imbalance. It is simply what the rule found across these 23 pairs and these years.
Here is the key result. After three inside up, the close one bar later was higher only 47.1% of the time. Yet across all daily bars, the next close was higher 51.0% of the time. So the bullish pattern did worse than an average day.
The gap widened over time. Three bars later, the pattern had moved its way 40.2% of the time, against 51.6% for all bars. Five bars later, it was 43.1% against 51.6%.
The bearish side told the same story. After three inside down, the next close was lower 47.3% of the time, against 49.0% for all bars. Three bars on, it was 42.7% against 48.4%. Five bars on, it was 45.6% against 48.4%.
In short, the confirmation candle did not help. If anything, price tended to give some of the move back. Still, 102 bullish cases is a small sample. Our guide on backtest sample size explains why.
The 15-minute test
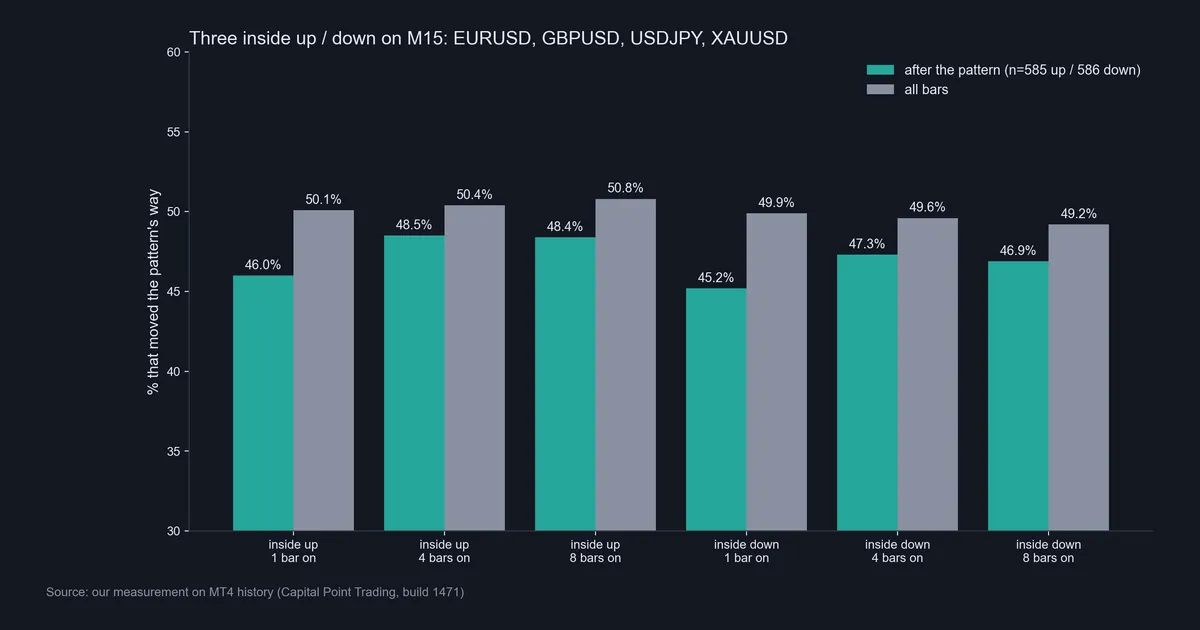
Next, we ran the same rule on M15 bars. Here the counts were balanced: 585 bullish and 586 bearish patterns across EURUSD, GBPUSD, USDJPY and XAUUSD.
The result matched the daily test. After three inside up, the next close was higher 46.0% of the time, against 50.1% for all bars. Four bars later, it was 48.5% against 50.4%. Eight bars later, it was 48.4% against 50.8%.
Three inside down was weak too. One bar later, it moved its way 45.2% of the time, against 49.9% for all bars. After four bars, it was 47.3% against 49.6%. After eight bars, it was 46.9% against 49.2%.
So on both timeframes, every reading sat below its base rate. The gaps on M15 are smaller, but they point the same way. Also, on 15-minute charts, spread eats a bigger share of each move. That makes a weak signal weaker still. Our page on backtesting transaction costs shows how fast that adds up.
Download the complete indicator database
Put these concepts on your charts. One email unlocks the full library of 1,380+ indicators with compiled MT4 and MT5 files, plus my TradingView scripts. No paywall, no spam, unsubscribe any time.
Get free access to my indicator database
One email unlocks 1,380+ free MT4, MT5 and TradingView indicators — the complete library. No single-tool download; you get the whole database.
Where it fails
Our data points to five clear limits. None of them is subtle.
- No edge on its own. On both D1 and M15, the pattern moved its way less often than an average bar. Trading it alone, as a direction call, did worse than doing nothing special.
- Late entry. By the time candle 3 closes, much of the move is already done. On daily charts, that is two full days after candle 1 closed.
- Wide stops. The logical stop sits beyond the pattern’s extreme. Because candle 1 is large, the stop is large too, so your position must shrink.
- Ugly paths. The USDJPY example shows price running past the pattern high before falling. A sensible stop would have closed the trade first.
- Context blind. Our rule ignored trend, levels and news. A pattern at a key level may behave differently, but we did not test that.
At best, it describes a turn that already happened. It can draw your eye to a chart, but it should not decide a trade by itself. Our broader article on whether candlestick patterns work reaches a similar view for other patterns.
Two charts where the signal faded
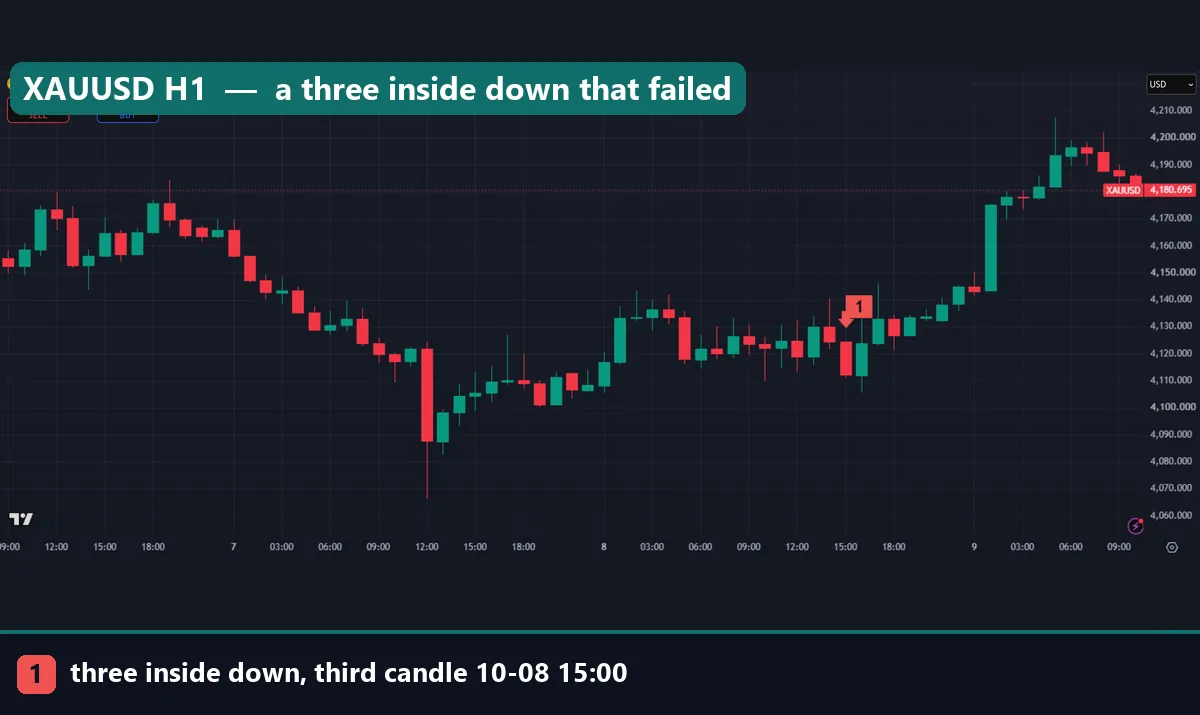
This XAUUSD one-hour chart shows a three inside down that closed at 15:00 UTC on 8 October 2026. The third candle opened at $4,124.41, dipped to $4,110.92 and closed at $4,112.085. Then gold turned up almost at once. Within hours it traded back above the pattern’s open, and on 9 October it reached about $4,200. A seller here was wrong straight away.
Note the size, too. The third candle alone spanned $13.69 from high to low.
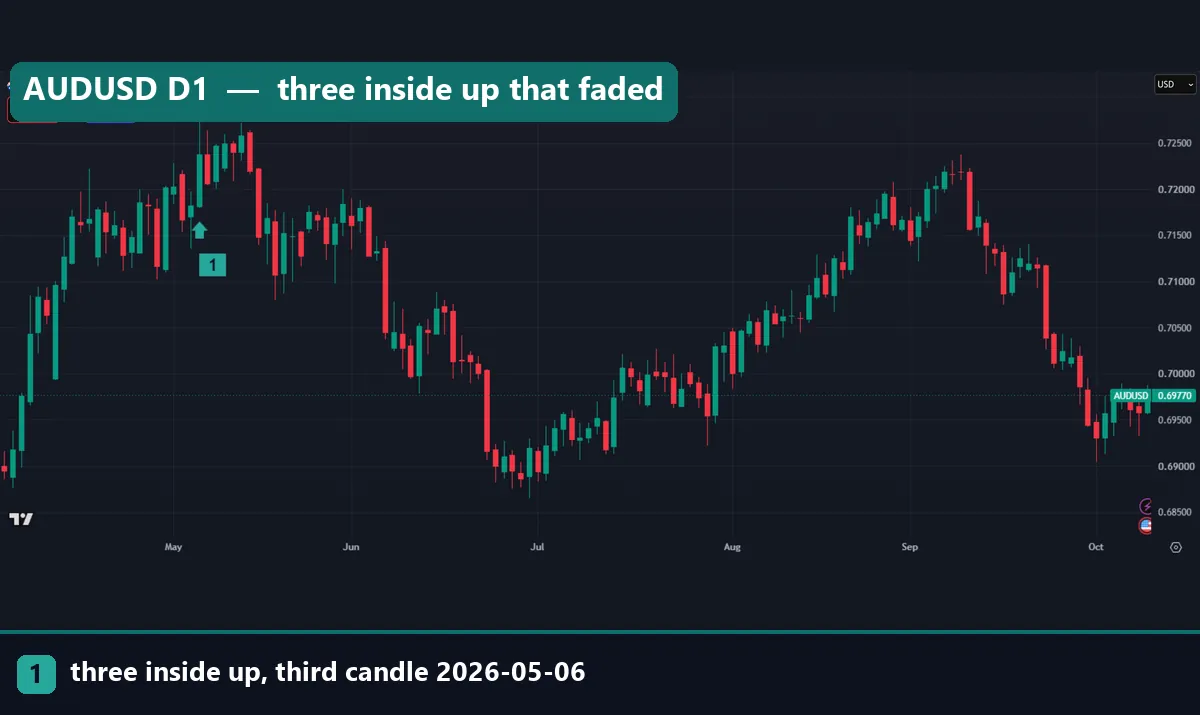
This AUDUSD daily chart shows a three inside up whose third candle closed on 6 May 2026. It opened at 0.71812, reached 0.72777 and closed at 0.72375. Price did edge a little higher over the next few days. But it then rolled over. By late June it traded near 0.69000, far below the pattern.
Common mistakes with three inside patterns
These four errors come up again and again. Each one makes a weak signal worse.
- Calling a harami a three inside pattern. Without the third close past candle 1’s open, you only have two candles. Wait for the close, not the intrabar move.
- Ignoring body size. A tiny first candle carries no meaning. That is why we required at least 0.6 ATR.
- Skipping the stop. The pattern gives a natural stop beyond its extreme. If that distance is too wide for your account, skip the trade. Do not trade without one. See our guide on how to use a stop loss.
- Trusting a few good charts. The EURUSD chart looks great for two weeks. However, our 554 daily cases say the average result was below the base rate. Count, then decide.
Where to go next
If you want to compare the three inside up with related patterns, these pages help. The morning star pattern is another three-candle turn. The three white soldiers page covers another three-candle bullish shape. For the bigger picture, start with candlestick patterns explained, then read candlestick patterns at support and resistance.
For quick reference, our Japanese candlestick cheat sheet shows the shapes side by side. Also, if you want MT4 to mark patterns for you, try our candlestick patterns indicator. Then test what it finds before you trust it.
Outside our site, StockCharts keeps a candlestick pattern dictionary at StockCharts ChartSchool. BabyPips has a plain primer on triple candlestick patterns at BabyPips.
FAQ
What is the 3 inside pattern?
It is a three-candle reversal pattern: a large candle, a smaller opposite candle inside its body, then a candle that closes past the first candle’s open.
What is the difference between three inside up and three inside down?
Three inside up is bullish and follows a fall, while three inside down is bearish and follows a rise; every condition is mirrored.
Is three inside up the same as a harami?
No, a harami is only the first two candles, and the three inside up adds a third candle that closes above the first candle’s open.
Did the pattern beat an average bar in your test?
No, on 23 daily forex pairs and on M15 bars, both versions moved their way less often than the base rate for all bars.
Which timeframe works best for three inside patterns?
Neither D1 nor M15 showed an edge in our data, and on M15 the spread takes a bigger share of each move.
Where should the stop go?
The usual place is just beyond the pattern’s extreme, so below the low for three inside up and above the high for three inside down.
Can a scanner find these patterns for me?
Yes, a candlestick scanner can flag them, but you still need to set a body-size filter and check results against a base rate.
Should I trade three inside up and down on their own?
Our numbers say no, because the pattern alone did worse than an average bar; results are not guaranteed; past performance is not indicative of future results.
Last updated: 9 October 2026.

About the author
Written by Dominic Walsh, a Forex trader and MT4/MT5 indicator, Expert Advisor and script developer. Every tool on forexmt4systems.com is tested on live charts before release and ships with ready-to-use compiled MT4 (.ex4) and MT5 (.ex5) files. Learn more about the trader and developer behind this site.
How we build, test and correct every tool: Editorial & Testing Policy. Trading carries risk; see the disclaimer.