
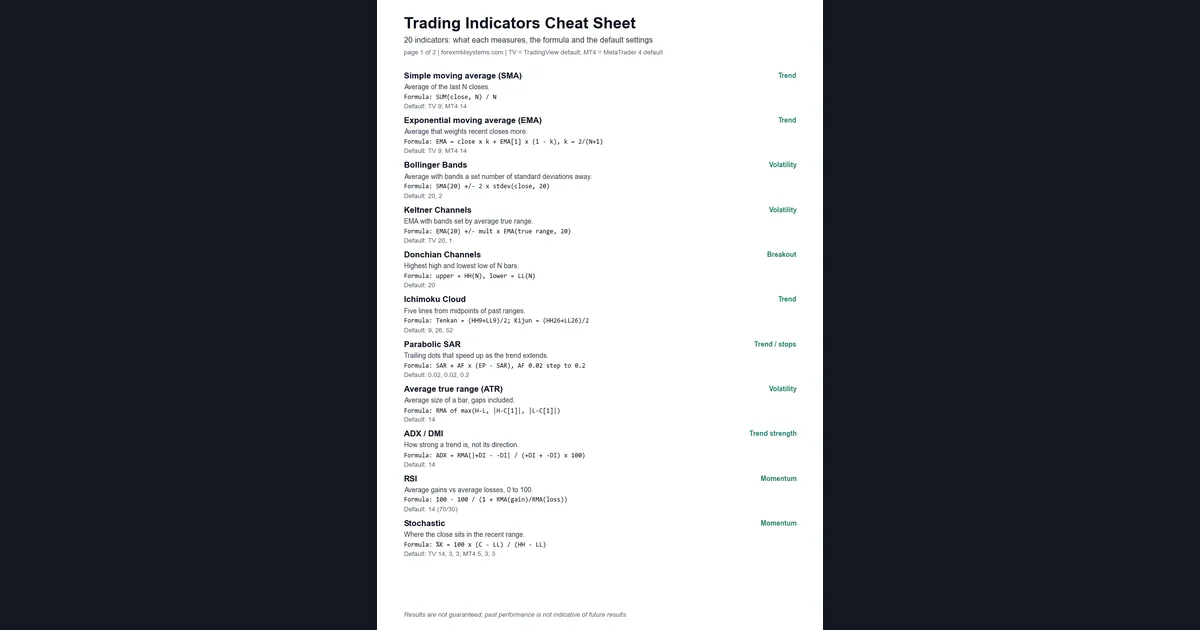
This trading indicators cheat sheet puts 20 common chart tools on two printable pages: what each one measures, its formula, and its default settings on TradingView and MetaTrader 4. Below, we explain the sheet, read five of its tools on real charts from 5 October 2026, and show what our own counts say about popular signals. Most of those counts show no edge, and we say so plainly.
What a trading indicators cheat sheet is
A cheat sheet is a lookup card. It does not tell you what to trade. Instead, it answers three quick questions about a tool: what it measures, how the math works, and which settings the platform loads by default.
That last point matters, because TradingView and MetaTrader 4 do not always agree. For example, the Stochastic opens at 14, 3, 3 on TradingView and at 5, 3, 3 on MT4. So two traders can talk about “the stochastic” and look at different lines.
Our sheet groups the 20 tools by family: trend, volatility, breakout, momentum, volume, levels and swings. Every tool is built from price, and two also use volume. In short, they reshape data you can already see.
How the trend and volatility tools work
Trend tools smooth price so the direction is easier to see. A simple moving average (SMA) is the sum of the last N closes divided by N. An exponential moving average (EMA) weights recent closes more, using k = 2/(N+1). Our page on SMA vs EMA compares the two.
Next come the bands. Bollinger Bands sit two standard deviations above and below a 20-bar SMA, so they widen when closes spread out. Keltner Channels put an EMA in the middle and set the width from average true range. Donchian Channels are simpler: the highest high and lowest low of the last 20 bars.
Ichimoku builds five lines from the midpoints of past ranges. For example, the conversion line is the midpoint of the last 9 bars, and the base line is the midpoint of the last 26. Parabolic SAR places a trailing dot that speeds up as the trend runs, because its step climbs from 0.02 up to 0.2.
Two tools measure size or strength rather than direction. Average true range (ATR) averages each bar’s true range, gaps included, over 14 bars. ADX measures how strong a trend is. However, it says nothing about which way it points. For that, you read the +DI and -DI lines beside it.
How the momentum, volume and level tools work
Momentum tools ask how fast price is moving compared with its recent past. RSI compares average gains with average losses on a 0 to 100 scale, with alert lines at 70 and 30. The Stochastic shows where the close sits in the recent range: %K = 100 x (C - LL) / (HH - LL).
Several tools are close cousins. Williams %R is the Stochastic turned upside down. KDJ adds a J line, J = 3K - 2D, which can leave the 0 to 100 range. CCI measures how far the typical price sits from its own average. Rate of change is the percent move of the close over N bars.
MACD is the gap between a 12 EMA and a 26 EMA, with a 9 EMA of that gap as the signal line.
Volume tools add a second input. On-balance volume (OBV) adds the bar’s volume on an up close and subtracts it on a down close. VWAP averages price by volume from an anchor, usually the session start.
Finally, two tools mark levels. Pivot points come from the prior period’s high, low and close: P = (H + L + C) / 3. ZigZag joins swing highs and lows once price reverses by a set percent. Its last leg redraws, which we measure below.
How we tested the numbers on the sheet
First, we captured five charts on the TradingView web chart on 5 October 2026, with OANDA data: EURUSD daily with RSI and MACD, GBPUSD daily with Bollinger Bands and ATR, USDJPY daily with the Stochastic and DMI, XAUUSD daily with Ichimoku, and EURUSD H1 with Parabolic SAR and a 200 EMA. Every study kept its defaults, except the EMA length of 200.
Next, we measured signals on history from MetaTrader 4, build 1471 (Capital Point Trading). That covers 23 FX pairs on the daily chart from 12 June 2018 to 24 August 2026, 37,748 candles in all. We also used M15 data for nine symbols from June 2025 to August 2026, and H1 data for the ZigZag test.
All results are before spread, swap and commission, so costs would make them worse. Our method sits in the editorial testing policy.
Default settings for all 20 indicators
This table copies the defaults exactly as they appear on the PDF. “TV” means TradingView and “MT4” means MetaTrader 4.
| Indicator | Family | Default |
|---|---|---|
| SMA | Trend | TV 9; MT4 14 |
| EMA | Trend | TV 9; MT4 14 |
| Bollinger Bands | Volatility | 20, 2 |
| Keltner Channels | Volatility | TV 20, 1 |
| Donchian Channels | Breakout | 20 |
| Ichimoku Cloud | Trend | 9, 26, 52 |
| Parabolic SAR | Trend / stops | 0.02, 0.02, 0.2 |
| ATR | Volatility | 14 |
| ADX / DMI | Trend strength | 14 |
| RSI | Momentum | 14 (70/30) |
| Stochastic | Momentum | TV 14, 3, 3; MT4 5, 3, 3 |
| KDJ | Momentum | 9, 3, 3 |
| MACD | Momentum / trend | 12, 26, 9 |
| CCI | Momentum | 20 |
| Williams %R | Momentum | 14 |
| Rate of change | Momentum | TV 9; MT4 14 |
| OBV | Volume | none |
| VWAP | Volume / mean | session |
| Pivot points | Levels | daily |
| ZigZag | Swings | TV 5%, depth 10 |
Defaults are a starting point, not advice. Our RSI settings guide shows how one input change moves the signals.
Reading the sheet against a live chart
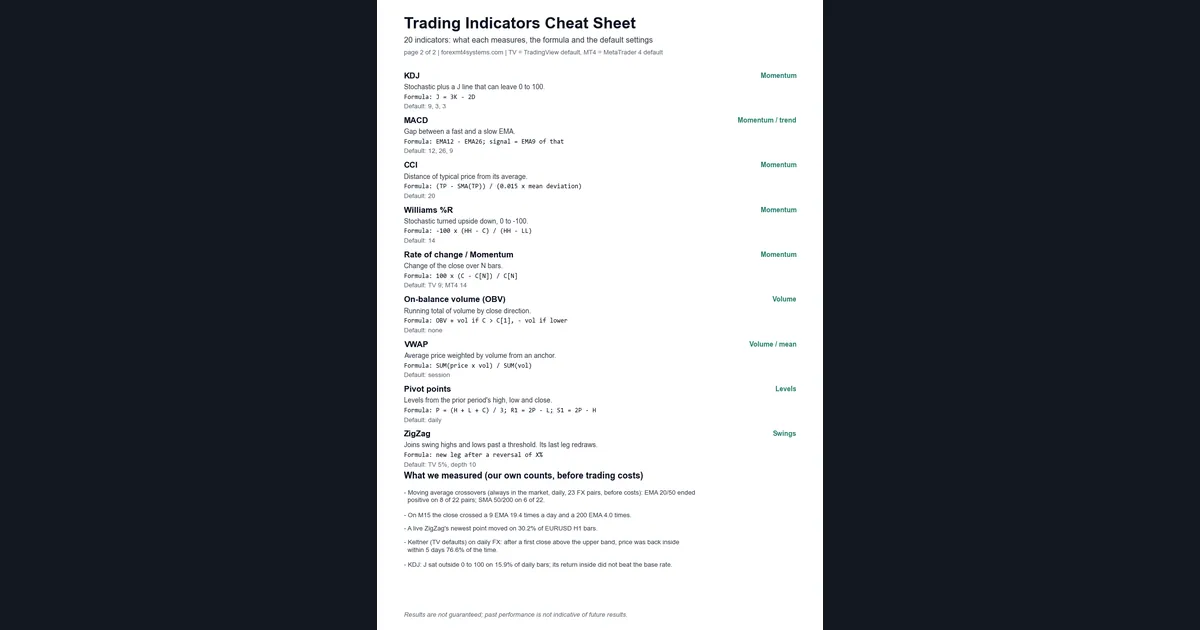
The second page of the PDF finishes the list and adds a box of our own measurements. Use it this way: find the tool, check that your chart uses the same default, then read the line.
Now take the EURUSD daily chart below, with RSI 14 and MACD 12, 26, 9 on defaults. On the last bar, RSI read 17.90, well below the 30 line. So the last 14 days held far more down moves than up moves. In the MACD panel, both lines sit below zero, which means the 12 EMA is under the 26 EMA. Also, the MACD line is below its signal line, so the histogram is negative.
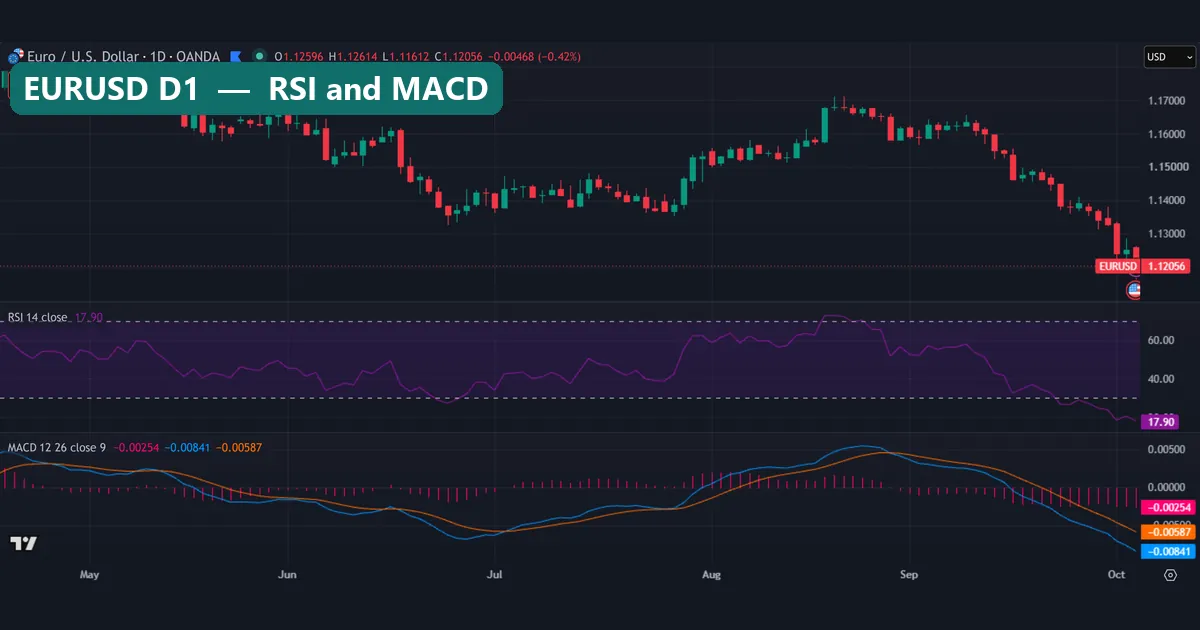
Note what the chart does not say. A low RSI describes the last 14 bars. It is not a forecast. Our guide to MACD explained walks through each part of the panel.
Worked example: one daily bar, read with the sheet
First, EURUSD daily from the chart above. The last bar opened at 1.12596, made a high of 1.12614 and a low of 1.11612, and closed at 1.12056, a range of 100.2 pips. The MACD line read -0.00841 and the signal line -0.00587. So the histogram is -0.00841 minus -0.00587, or -0.00254, which matches the chart.
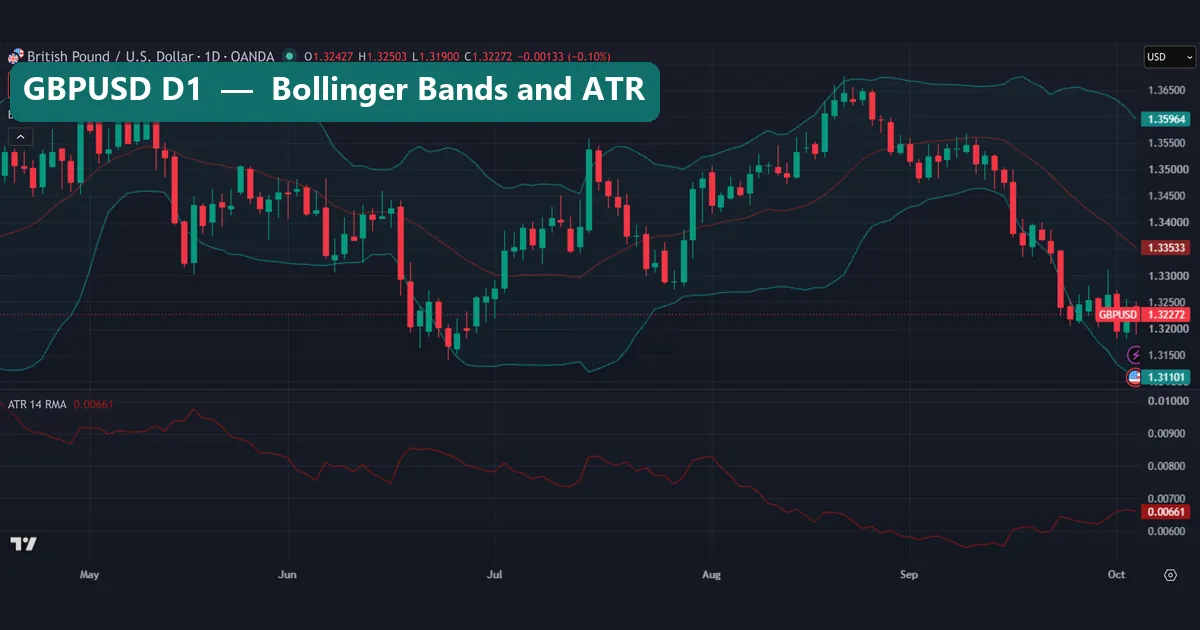
Next, GBPUSD daily with Bollinger Bands 20, 2 and ATR 14. The legend shows a middle band of 1.33533, an upper band of 1.35964 and a lower band of 1.31101. So each band sits about 243 pips from the middle. Because that equals two standard deviations, one standard deviation is about 121.6 pips.
The close was 1.32272, which is 126.1 pips below the middle and 117.1 pips above the lower band. By our calculation, that puts the close at about 24% of the band width, Bollinger’s %B.
Now add ATR. It read 0.00661, or 66.1 pips. So the band half-width was about 3.7 times the average daily range. The last bar ran from 1.31900 to 1.32503, which is 60.3 pips, a little under the ATR. In short, it was an ordinary bar in the lower half of a wide band. See Bollinger Bands explained, and John Bollinger’s own rules on the Bollinger Bands page at BollingerBands.com.
Trend strength and the stochastic on USDJPY
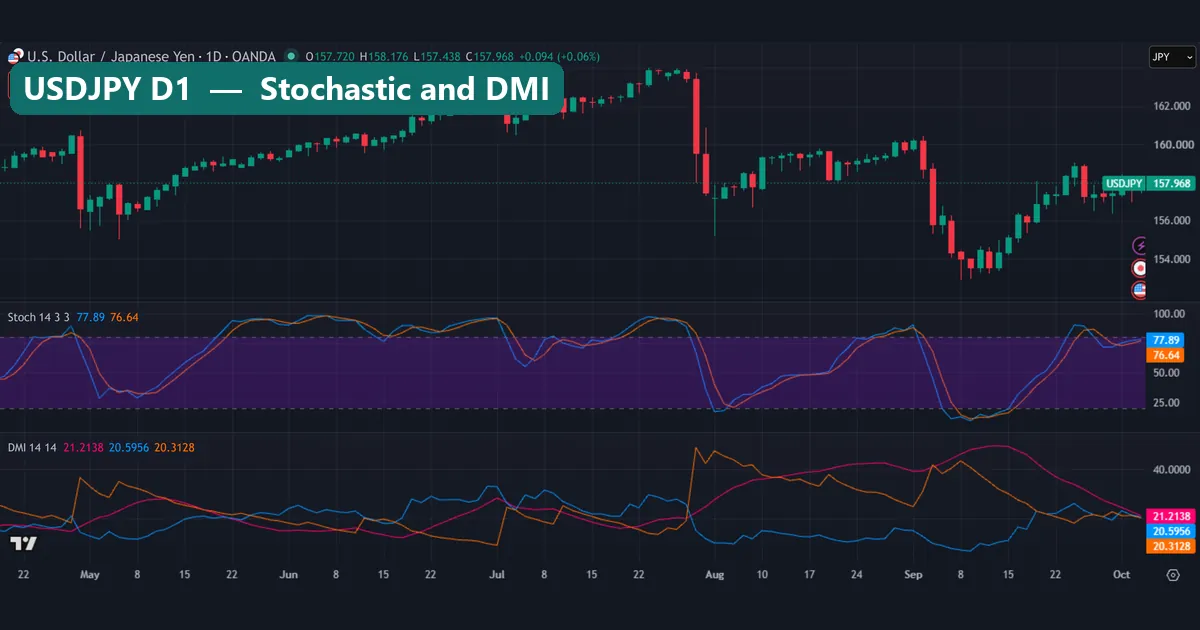
The third chart pairs two tools people often mix up. The Stochastic 14, 3, 3 shows where the close sits in its range. DMI 14, 14 measures how strong the move is. So they can disagree.
On the last bar, %K read 77.89 and %D read 76.64, just under the 80 line. However, ADX read 21.21, with +DI at 20.60 and -DI at 20.31. So price sat near the top of its 14-day range, but with little trend strength behind it.
Also, look at the start of August. The -DI line jumped well above +DI as USDJPY dropped sharply, then faded over the next weeks. That is the DMI describing a strong move after it happened. Our guide on what the ADX indicator is covers all three lines.
Download the complete indicator database
Put these concepts on your charts. One email unlocks the full library of 1,380+ indicators with compiled MT4 and MT5 files, plus my TradingView scripts. No paywall, no spam, unsubscribe any time.
Download this cheat sheet free
Enter your email and the file is yours. You also get the full MT4 and MT5 library.
What our measurements say about popular signals
Moving average crossovers. We ran three always-in-the-market systems on the daily FX pairs. EMA 9/21 ended positive on 8 of 23 pairs over 1,754 trades, and 28.5% of trades made money. EMA 20/50 ended positive on 8 of 22 pairs, and SMA 50/200 on 6 of 22. The median pair lost money on all three, before costs.
EMAs on M15. The close crossed a 9 EMA 19.4 times a day and a 200 EMA 4.0 times. Meanwhile, pullbacks to the EMA held for five bars only 22.8% to 25.6% of the time, whatever the length.
Keltner Channels. A first daily close above the upper band was back inside within five days 76.6% of the time (1,948 cases). Yet price was higher five bars later in only 50.1% of them.
KDJ. The J line sat outside 0 to 100 on 15.9% of 36,943 daily bars. When J came back above 0, price closed higher five bars later 51.3% of the time (1,152 signals). The base rate was 51.6%, so the signal did not beat doing nothing.
ZigZag. At each new EURUSD H1 bar, the newest swing point moved on 30.2% of 3,880 bars. On XAUUSD H1, with a 0.6% reversal, it moved on 65.6% of 3,999 bars.
Where it fails
First, every tool here is built from past bars, so each one lags. Our crossover counts show the cost: most pairs ended negative, before any spread.
Second, the sheet cannot tell you which regime you are in. RSI and Bollinger Bands read well in ranges and badly in trends. Parabolic SAR does the reverse: in a range, it flips again and again, and each flip is a small loss.
Third, several tools repaint or reset. ZigZag redraws its last leg, as our 30.2% figure shows. Pivot points and VWAP reset each period. Also, every indicator recalculates on the forming bar until it closes. Our list of non-repaint indicators for MT4 explains how to check a signal in real time.
Fourth, volume tools are weak on spot FX. OBV and VWAP use one broker’s tick volume, so another broker can show different numbers. Finally, the sheet covers only two platforms. MT5 and other packages may load other defaults, so check the inputs panel first.
Trend overlays: Ichimoku, Parabolic SAR and the 200 EMA
First, XAUUSD daily with Ichimoku 9, 26, 52, 26.
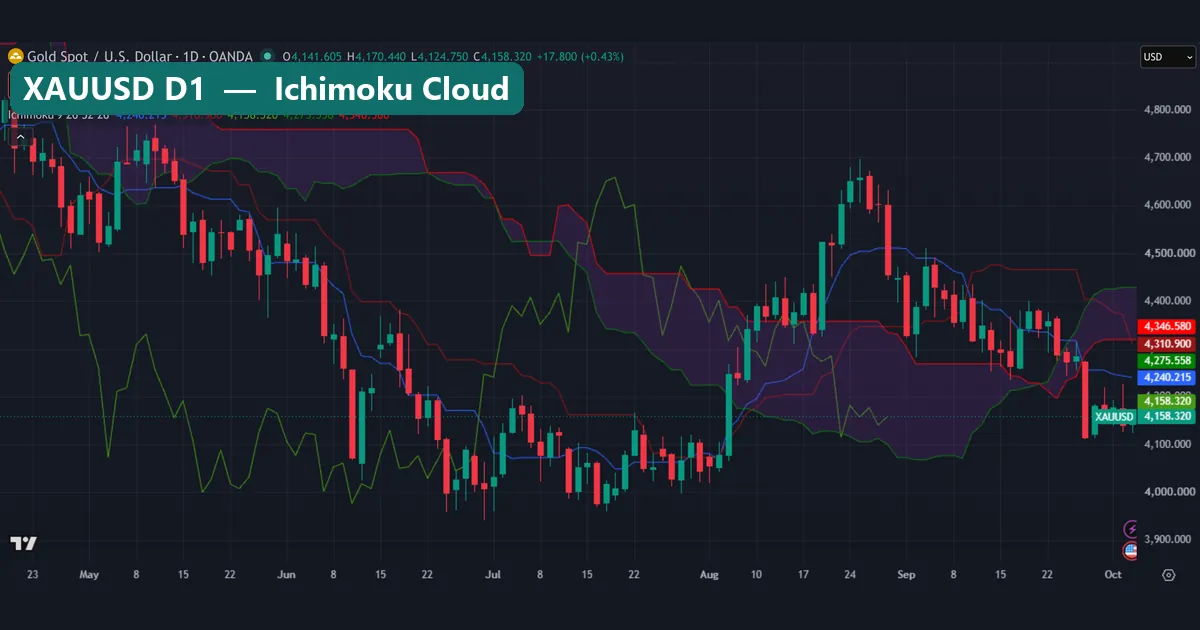
On the last bar, gold closed at $4,158.32. The legend shows the conversion line at $4,240.22 and the base line at $4,310.90. The two cloud spans read $4,275.56 and $4,346.58. So the close sat about $81.90 under the conversion line and $117.24 under the lower cloud edge, a down state on this chart. However, in August price climbed up through the cloud, then fell back below it within weeks. Our guide on what the Ichimoku Cloud is covers the five lines.
Next, EURUSD H1 with Parabolic SAR 0.02, 0.02, 0.2 and a 200 EMA.
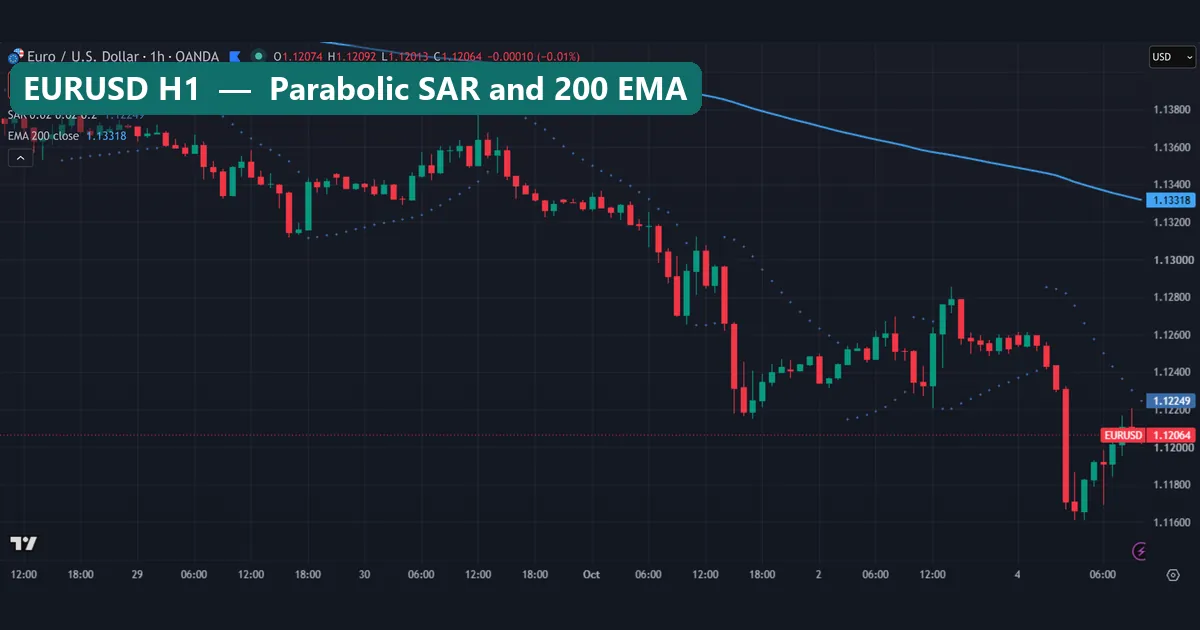
At the last bar, the SAR dot sat at 1.12249, above the close of 1.12064, which marks a short state. The 200 EMA read 1.13318, about 125.4 pips above price. Where price moved sideways, the dots flipped often. Read more in what Parabolic SAR is.
Four common mistakes with a trading indicators cheat sheet
1. Mixing platform defaults. A 9-bar SMA on TradingView and a 14-bar SMA on MT4 are different lines. So check the inputs before you compare screenshots.
2. Stacking one family. RSI, Stochastic, Williams %R and CCI all measure momentum from the same closes. Four of them agreeing is one opinion. Instead, see how to combine indicators from different families.
3. Treating an extreme as a reversal. Our EURUSD chart showed RSI at 17.90 after a long slide. Low readings can stay low. Likewise, our KDJ count found no gain from buying the J line’s return above 0.
4. Judging a signal on finished history. ZigZag looks clean on old bars because it redrew as price moved. So test any rule bar by bar, and include costs.
Where to go next
For averages, start with moving averages explained. For volatility, read what ATR is in trading and our Keltner Channel strategy test. Then, for candle patterns, our Japanese candlestick cheat sheet uses the same format.
For official formulas, MetaQuotes lists every built-in tool in the MQL5 technical indicator reference. TradingView documents its version in the RSI help article on TradingView. Also, StockCharts keeps an index of tools in the indicator list at StockCharts ChartSchool.
FAQ
What is on the trading indicators cheat sheet?
It lists 20 indicators on two pages, each with what it measures, one formula and its default settings on TradingView and MT4, plus a box of our own measured results.
How do I get the PDF?
Enter your email in the opt-in form on this page, and we will send you the two-page PDF free.
Why do TradingView and MT4 defaults differ?
Each platform chose its own starting inputs. For example, the Stochastic opens at 14, 3, 3 on TradingView and 5, 3, 3 on MT4.
Which indicator on the sheet works best?
Our data does not name one. Most signals we counted, such as moving average crossovers and KDJ returns, did not beat the base rate before costs.
Can I use these indicators on gold?
Yes, the formulas work on any price series. Our XAUUSD chart shows Ichimoku on gold, where distances and ATR read in dollars.
Do any of these indicators repaint?
ZigZag redraws its last leg, and every tool recalculates on the forming bar. Pivot points and VWAP also reset each period by design.
How many indicators should I put on one chart?
Fewer is clearer. Two or three from different families, such as one trend tool, one momentum tool and ATR, tell you more than five momentum tools.
Will the default settings make my trades profitable?
No setting can promise that. Our crossover and EMA counts lost on most pairs before costs, so test any rule on your own data; results are not guaranteed; past performance is not indicative of future results.
Last updated: 5 October 2026.

About the author
Written by Dominic Walsh, a Forex trader and MT4/MT5 indicator, Expert Advisor and script developer. Every tool on forexmt4systems.com is tested on live charts before release and ships with ready-to-use compiled MT4 (.ex4) and MT5 (.ex5) files. Learn more about the trader and developer behind this site.
How we build, test and correct every tool: Editorial & Testing Policy. Trading carries risk; see the disclaimer.