
What is KDJ indicator? It is a stochastic oscillator with a third line, J, that stretches the gap between the two classic lines and can run past 0 and 100. This guide shows the formula, the settings, and how to read it. It also settles one practical question with data: did the popular J-line reversal signal beat doing nothing on daily forex charts? On 23 pairs from 2018 to 2026, it did not.
What is KDJ indicator: a plain definition
KDJ is a momentum oscillator. It asks one simple question on every bar: where did the close land inside the recent high-low range? A close near the top of the range scores near 100. A close near the bottom scores near 0.
The tool draws three lines. K is a smoothed version of that raw score. D is a smoothed version of K, so it moves more slowly. J is the odd one. It equals three times K minus two times D, so it reacts fastest and often leaves the 0 to 100 box.
KDJ grew out of George Lane’s stochastic oscillator. The K and D lines carry the same idea. The main changes are the smoothing method and the extra J line. KDJ is common on Chinese and other Asian charting platforms. By contrast, Western platforms tend to ship only the two-line stochastic.
How the KDJ formula works
The calculation runs in four steps. We use the common default of 9, 3, 3.
- RSV (raw stochastic value).
RSV = 100 x (close - lowest low of 9 bars) / (highest high of 9 bars - lowest low of 9 bars). - K line.
K = 2/3 x previous K + 1/3 x RSV. - D line.
D = 2/3 x previous D + 1/3 x K. - J line.
J = 3K - 2D.
On the first bar there is no previous K or D. So most versions, including ours, start both at 50.
Notice the smoothing. Each new K keeps two thirds of yesterday’s K and adds one third of today’s RSV. That is a recursive average, close to an exponential one, while the stock stochastic uses simple averages. As a result, the K and D values on a KDJ chart will not match a stock stochastic exactly, even with the same 9, 3, 3 inputs.
Next, look at J. Since J = 3K – 2D, you can rewrite it as K + 2 x (K – D). In other words, J takes K and adds twice the distance between K and D. When K pulls away from D, J races ahead of both. When K sits on D, J equals K.
Why the J line leaves the 0 to 100 box
K and D are averages of a score that lives between 0 and 100. Therefore they also stay between 0 and 100. J has no such limit. For example, say K is 90 and D is 80. Then J is 270 minus 160, which gives 110.
That is why KDJ charts show J above 100 and below 0 while K and D stay inside. Then they treat the return inside the box as a signal: J back below 100 is a sell, and J back above 0 is a buy.
How often does J go outside? In our measurement on 36,943 daily bars across 23 forex pairs, J sat outside 0 to 100 on 15.9% of bars. For comparison, K sat beyond the 80 and 20 lines on 24.4% of bars. So J extremes are not rare. Roughly one bar in six has one.
How we tested KDJ
We ran two kinds of tests, following our editorial testing policy.
History test. We used MetaTrader 4, build 1471, with daily history from Capital Point Trading. The data covers 23 FX pairs from 12 June 2018 to 24 August 2026. After warm-up bars, 36,943 daily bars entered the count. We computed KDJ (9, 3, 3) with the exact formula above, with K and D seeded at 50.
Then we defined two events. A sell event is J crossing back below 100. A buy event is J crossing back above 0. For each event we checked the close five daily bars later. A sell counts as correct if that close sat lower. A buy counts as correct if it sat higher. We compared each figure with the base rate for all bars. All numbers are before spread, swap and commission.
Chart test. We also opened the TradingView web chart on 5 October 2026 with OANDA daily data for EURUSD, GBPUSD and USDCHF. TradingView has no built-in KDJ. So our TradingView shots show the built-in Stochastic set to 9, 3, 3, which plots K and D. The J line images are our own calculation from the same OANDA bars.
KDJ settings and parameters
KDJ has three inputs plus the fixed J formula. The table lists the defaults we used and what each one changes.
| Parameter | Default | What it does | Effect of raising it |
|---|---|---|---|
| N (RSV lookback) | 9 | Bars used for the highest high and lowest low | Slower RSV, fewer extremes |
| M1 (K smoothing) | 3 | Weight of the new RSV in K (1/M1) | Smoother, later K line |
| M2 (D smoothing) | 3 | Weight of the new K in D (1/M2) | Smoother, later D line |
| J formula | 3K – 2D | Adds twice the K minus D gap to K | Fixed; some builds use 3D – 2K |
| Seed value | 50 | Starting K and D on the first bar | Only affects the first few dozen bars |
| Levels | 0 and 100 (J), 80 and 20 (K, D) | Lines traders treat as extremes | A convention, not part of the math |
Check the J formula in any KDJ script before you trust it. A few builds flip it to 3D – 2K, and that line moves the other way. For a broader look at tuning the inputs, see our guide to the best setting for stochastic.
Reading KDJ on a chart
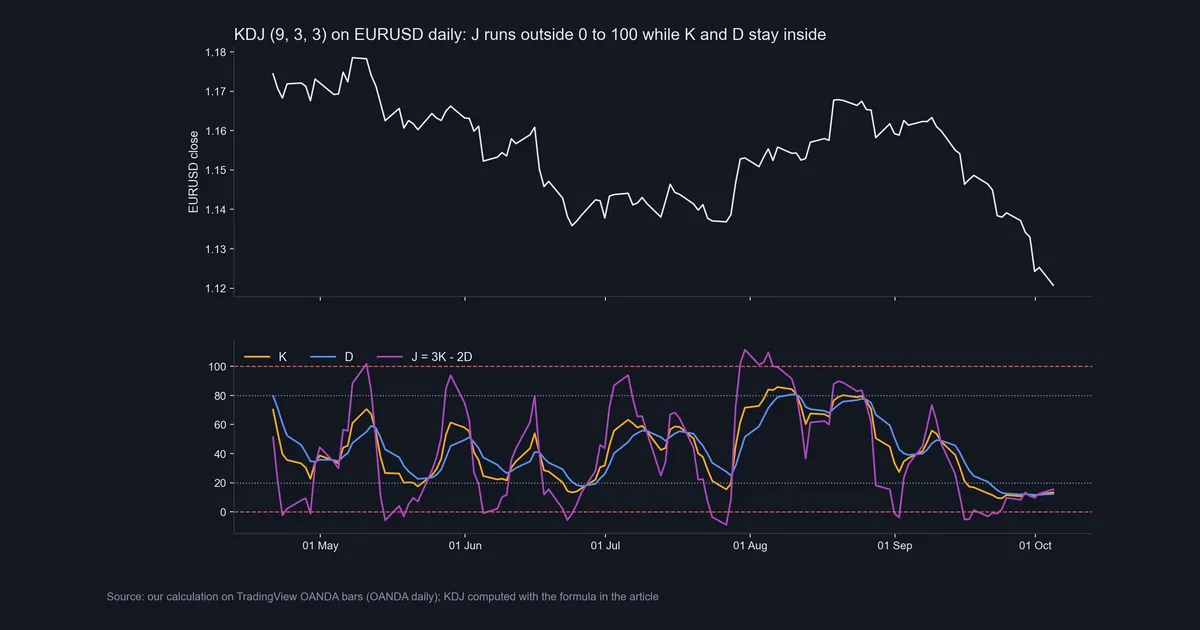
Our EURUSD daily calculation runs from late April to early October 2026. Look at early August. J climbed above 100 while K and D stayed under 90. Then, in late September, J dipped below 0 several times as the pair slid toward 1.12.
Next, compare that with the TradingView panel on GBPUSD.
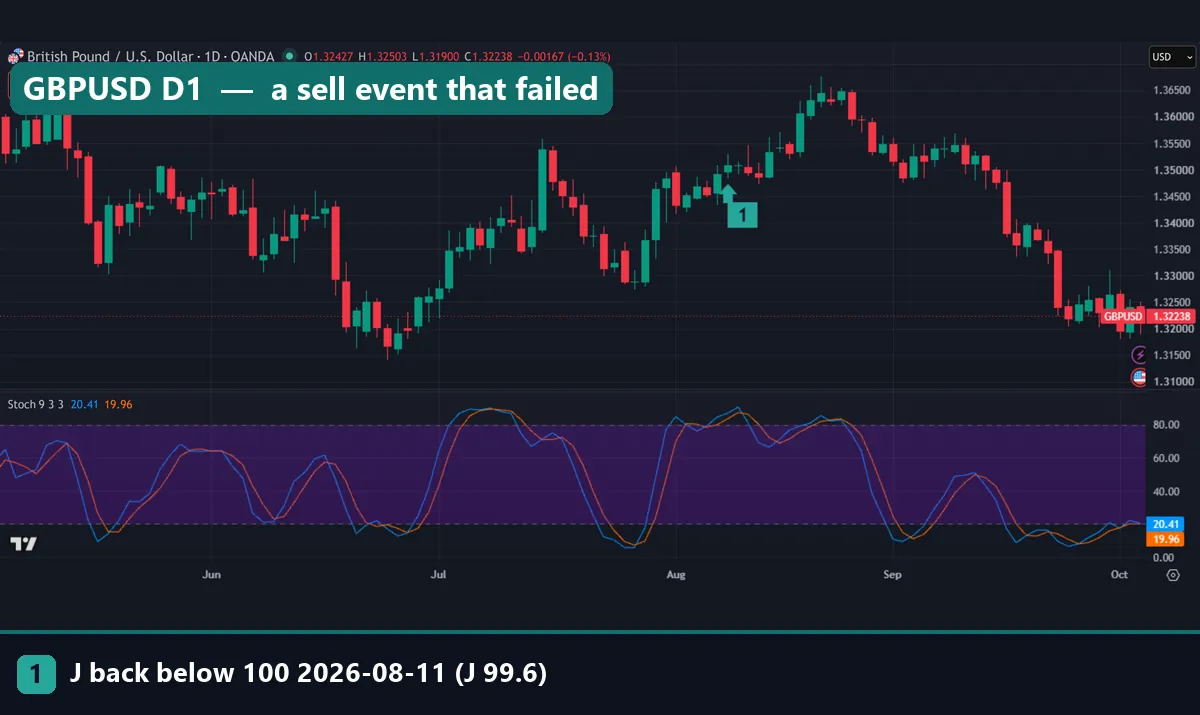
Marker 1 sits on 11 August 2026. On that bar, by our calculation, J crossed back below 100 at 99.6, with K at 85.7 and D at 78.7. The close was 1.35084. On the usual reading, that is a sell.
However, the chart shows what came next. GBPUSD kept climbing and printed highs around 1.365 later in August.
So read KDJ as a gauge of where the close sits in its range. Don’t read it as a timer. It also pairs well with a wider grasp of what overbought and oversold really mean.
Worked example: EURUSD on 24 September 2026
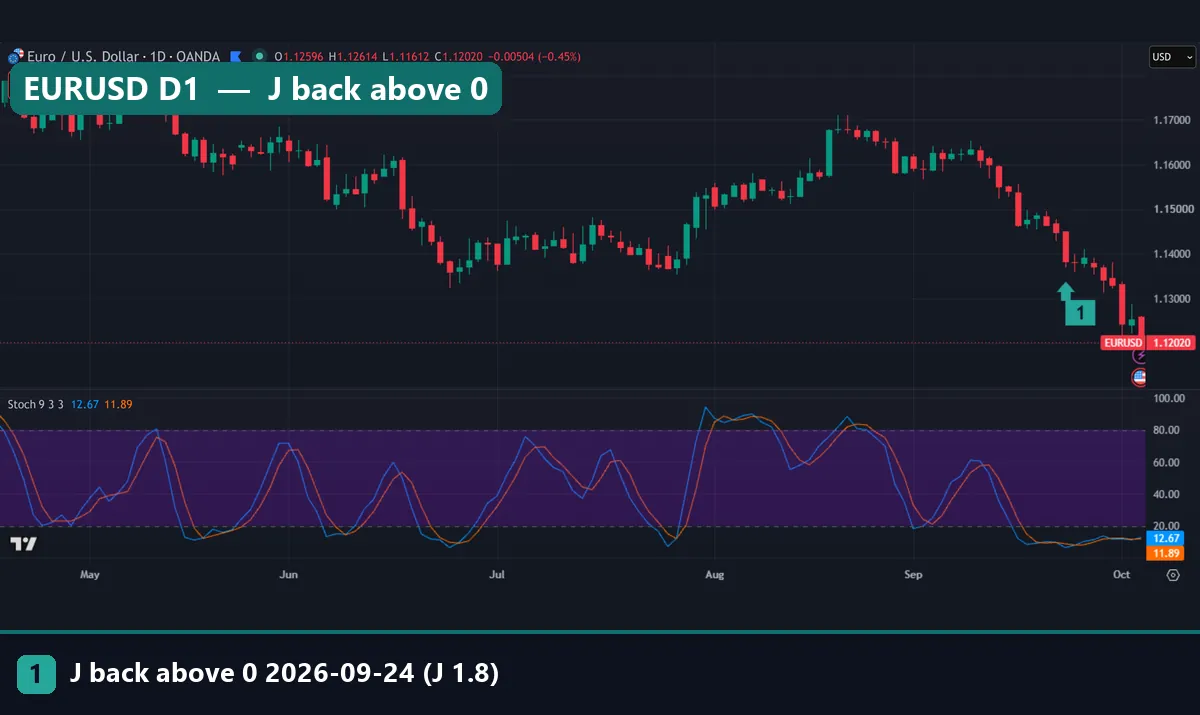
Go back to the first image. Marker 1 points at the EURUSD daily bar of 24 September 2026. Our numbers from OANDA data:
- Open 1.13808, high 1.13992, low 1.13592, close 1.13802.
- K = 9.3 and D = 13.0.
- J = 3 x 9.3 – 2 x 13.0 = 27.9 – 26.0 = 1.9. Our file shows 1.8, because it works from unrounded K and D.
The day before, J sat below 0. On this bar it crossed back above 0. That is the classic KDJ buy event.
Now check the outcome on the chart. Five daily bars later, EURUSD still traded below the signal close. Then the slide went on. When we captured the chart on 5 October 2026, the last bar showed 1.12020. That is about 178 pips under the 24 September close.
The same pair gave buy events on 3 September (J 23.3) and 18 September (J 1.1) as well. Both came inside a falling month, and each “buy” met more selling.
What 36,943 daily bars showed
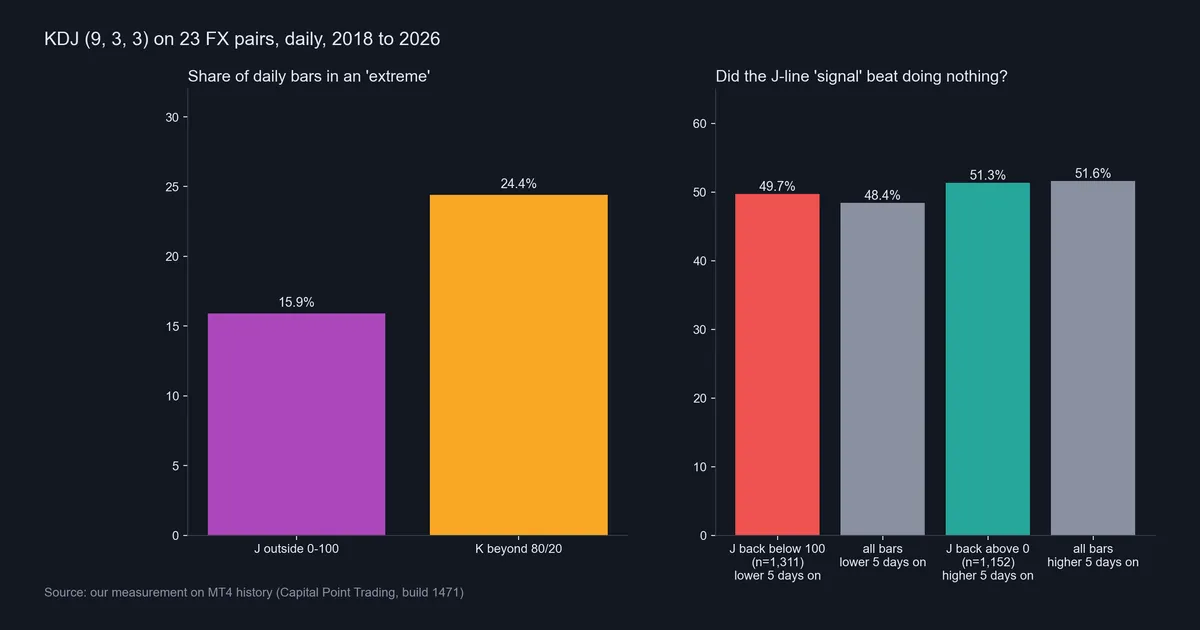
Our measurement covered 23 FX pairs on the daily chart, 2018 to 2026. Here are the two signal results next to their base rates:
- Sell event (J back below 100): 1,311 signals. The close five bars later was lower 49.7% of the time. For all bars, that figure was 48.4%.
- Buy event (J back above 0): 1,152 signals. The close five bars later was higher 51.3% of the time. For all bars, it was 51.6%.
So the sell event beat the base rate by 1.3 points, and the buy event trailed it by 0.3 points. Both gaps are tiny for samples of this size. Also, costs come out of every trade, and these figures are before costs. Our guide on backtesting transaction costs shows how fast that adds up.
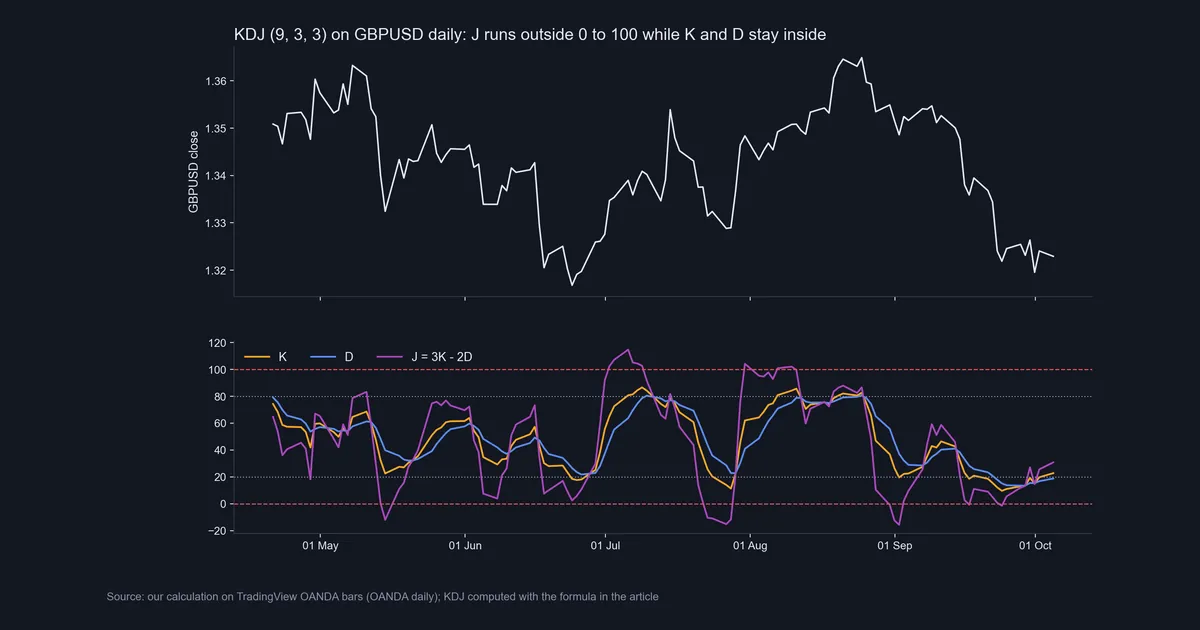
The GBPUSD calculation shows why. J went above 100 in early July and again in early August. Each time price kept rising for a while. Then J fell below 0 in late July and early September, and price kept falling at first. As a result, extremes in J tended to show up inside moves rather than at their ends.
Download the complete indicator database
Put these concepts on your charts. One email unlocks the full library of 1,380+ indicators with compiled MT4 and MT5 files, plus my TradingView scripts. No paywall, no spam, unsubscribe any time.
Get free access to my indicator database
One email unlocks 1,380+ free MT4, MT5 and TradingView indicators — the complete library. No single-tool download; you get the whole database.
Where it fails
- Trends. In a strong trend the close stays near one end of the range. So J sits outside the box again and again. Each return inside fires a signal against the trend.
- No edge in our reversal test. Across 2,463 J events on daily FX, neither direction beat the base rate by a margin worth trading.
- Lag. K and D are averages of averages. That said, J reduces the lag, but it does so by adding noise.
- The live bar moves. Until the bar closes, J keeps changing. A cross on the open can vanish by the close.
None of this makes KDJ useless as a picture of momentum. Still, it does mean the J cross alone is not a trading rule. Our article on RSI false signals covers the same trap in a sister oscillator.
Building KDJ on TradingView
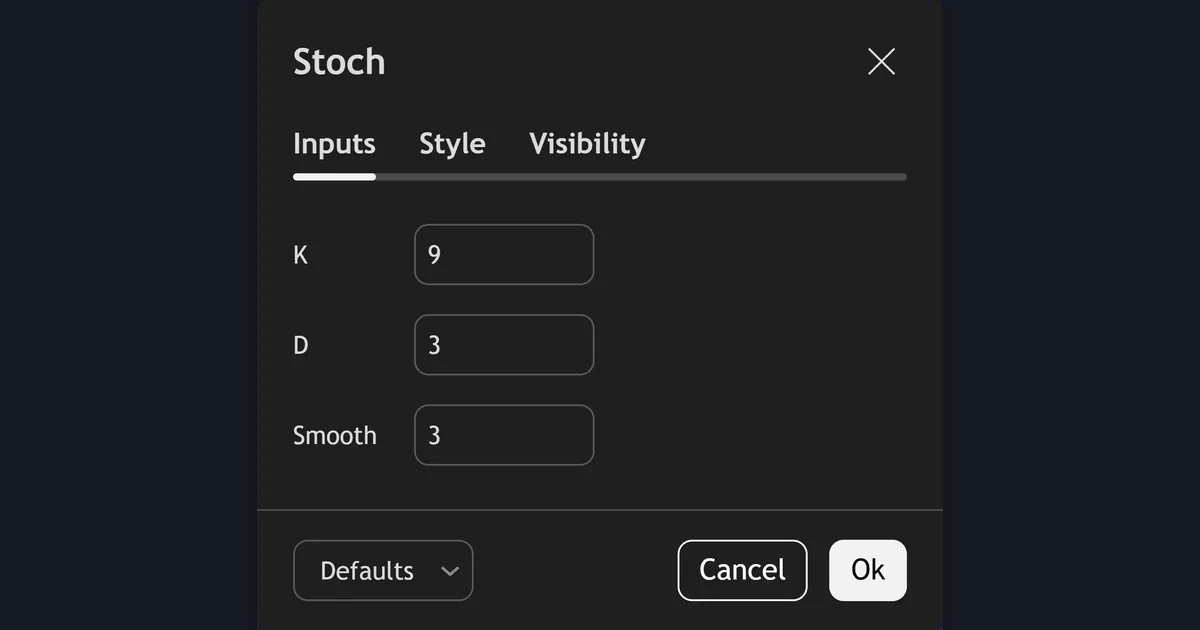
TradingView ships the Stochastic, not KDJ. Its settings dialog has three inputs: K, D and Smooth. For our shots we set them to 9, 3 and 3. That gives you K and D close to KDJ, though not identical, because the platform smooths with simple averages.
To get a true J line you need a script. It needs only the four steps above. TradingView’s own documentation of the Stochastic in the TradingView Help Center explains how its version computes %K and %D.
On MetaTrader the built-in Stochastic works the same way. The iStochastic reference in the MQL5 documentation lists its smoothing methods. If you add a KDJ file in MT4 or MT5, our guide on how to install MT4 and MT5 indicators walks through the folders.
A sell signal that did not hold: USDCHF
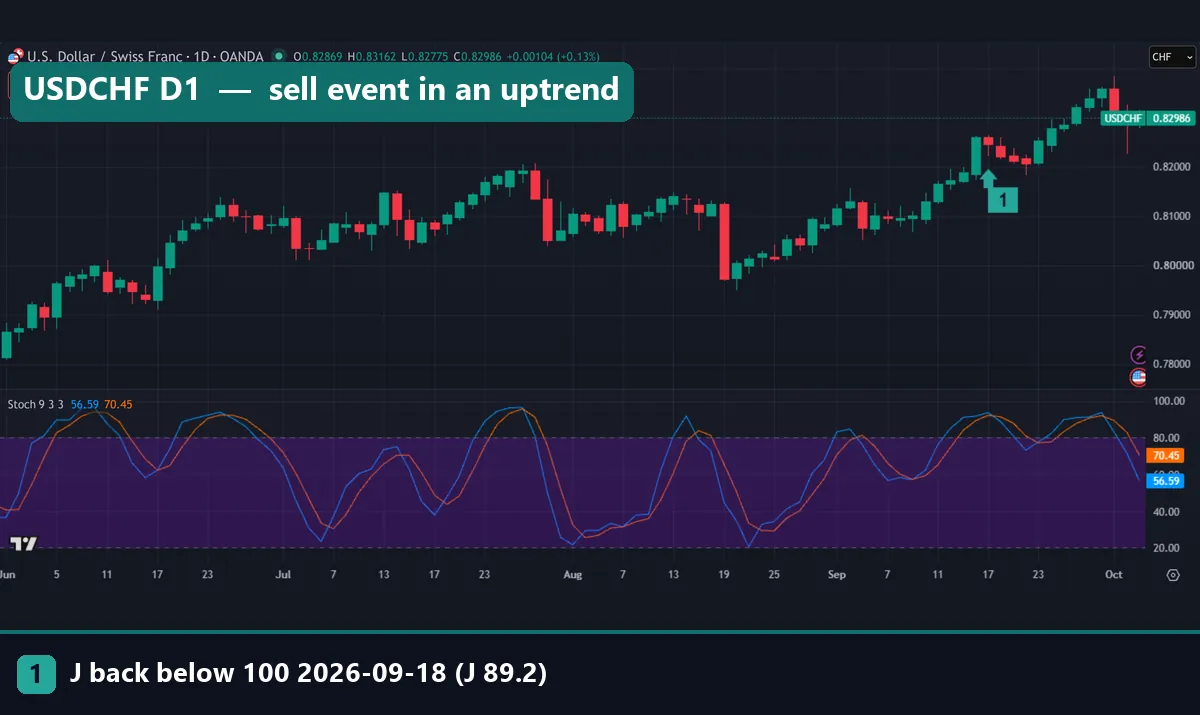
Marker 1 on this USDCHF daily chart sits on 18 September 2026. On that bar, J crossed back below 100 and printed 89.2, with K at 85.3 and D at 83.4. The close was 0.82213. That is a textbook KDJ sell.
But the pair dipped for a few days and then climbed again. By our 5 October capture it traded at 0.82986, above the signal close. In fact, our event list for USDCHF holds five “J back below 100” bars between 24 June and 18 September 2026. Meanwhile, the chart shows a steady rise from about 0.79 to 0.83 over the same months.
Common mistakes with KDJ
- Trading every J cross. J leaves the box on about one daily bar in six. Treating each return as an entry turns noise into trades. Our base-rate test found no edge in that rule.
- Fading a trend. In the EURUSD and USDCHF examples, the signals pointed against the main move. If you use KDJ at all, check trend direction first. See our guide to trend-following trading.
- Assuming all KDJ lines match. A stock stochastic set to 9, 3, 3 is not KDJ. Equally, two KDJ scripts can differ in seed or J formula. Compare a few bars by hand before you rely on one.
- Judging it on a handful of charts. A few clean reversals look convincing. Read our note on backtest sample size before trusting any small count.
Where to go next
If you want the parent indicator in depth, start with how to use the stochastic oscillator. Then compare it with the slower version in our slow stochastic guide. Our RSI vs stochastic comparison shows how a different momentum formula behaves.
For ready-made files, see our stochastic indicator for MT4 and MT5. Before you test any oscillator rule, also read how trading expectancy works.
For outside reading, StockCharts explains the fast, slow and full versions in its stochastic oscillator article at StockCharts ChartSchool. Then the stochastic oscillator entry on Wikipedia covers the history and the base formula.
FAQ: the KDJ indicator
What does KDJ stand for?
The letters are just the names of the three lines: K, D and J. K and D come from the stochastic oscillator, and J is the extra line built from them.
What are the default KDJ settings?
Most platforms use 9, 3, 3: a nine-bar range for RSV, then smoothing of 3 for K and 3 for D. J is always 3K – 2D in the standard version.
Why does the J line go above 100 or below 0?
J adds twice the gap between K and D to K. When K moves away from D quickly, J overshoots. In our data it sat outside 0 to 100 on 15.9% of daily bars.
Is KDJ the same as the stochastic oscillator?
Not quite. K and D follow the same idea, but KDJ smooths with a 1/3 recursive average while most stochastic builds use simple averages, so values differ slightly.
Does the KDJ J-line signal work on forex?
Not in our test. On 23 daily FX pairs, sell events closed lower five bars later 49.7% of the time against a 48.4% base, and buy events 51.3% against 51.6%.
Can I add KDJ to TradingView?
There is no built-in KDJ. You can set the Stochastic to 9, 3, 3 for K and D, or load a community script that plots J. Check its formula first.
Which timeframe suits KDJ?
We only tested the daily chart, so we cannot rank timeframes. Lower timeframes produce more J events, which means more noise and higher total costs.
Should I use KDJ alone?
Our data says no: the J cross alone showed no edge over the base rate. Treat it as one view of momentum, add risk control, and remember that results are not guaranteed; past performance is not indicative of future results.
Last updated: 5 October 2026.

About the author
Written by Dominic Walsh, a Forex trader and MT4/MT5 indicator, Expert Advisor and script developer. Every tool on forexmt4systems.com is tested on live charts before release and ships with ready-to-use compiled MT4 (.ex4) and MT5 (.ex5) files. Learn more about the trader and developer behind this site.
How we build, test and correct every tool: Editorial & Testing Policy. Trading carries risk; see the disclaimer.