
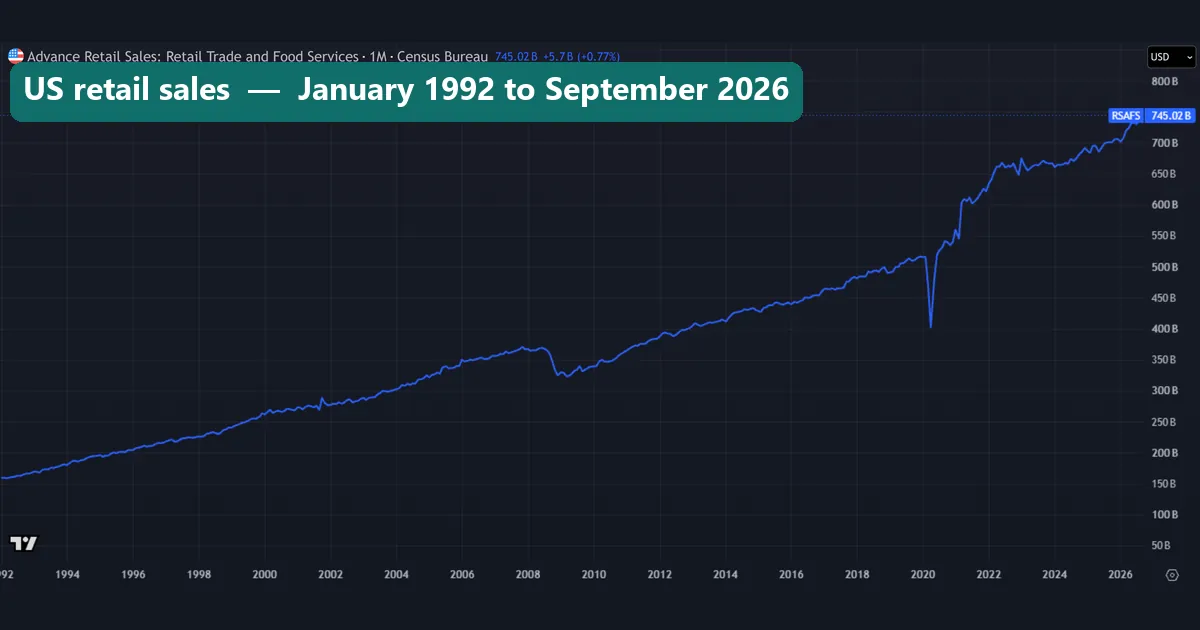
What is retail sales, and why does one US report stir the dollar every month? Retail sales is the US Census Bureau’s monthly estimate of what stores, online sellers and restaurants took in. This guide settles what the number covers, how the Census builds it, and what it did to EUR/USD on 38 release days. From January 1992 to September 2026, monthly sales grew from $159.2bn to $745.0bn, or 4.68 times. After prices, the gain shrinks to 1.92 times. And the release hour on EUR/USD ran 1.51 times wider than normal, with no steady direction.
What is retail sales? A short definition
Retail sales is the total value of sales by US retail and food service firms in one month. The headline counts current dollars, so it mixes volume with price. The Census also strips out normal seasonal swings, so one month compares fairly with the next.
On TradingView the headline series is FRED:RSAFS. Beside it, FRED:RSXFS is retail trade without food services, and FRED:RRSFS is the same total in 1982-84 dollars. Food services and drinking places made up 10.5% of the total in January 1992 and 12.5% in September 2026.
Retail sales is not the same as all consumer spending, though. It leaves out most services, such as rent, health care and travel. BEA’s consumer spending (PCE) page defines the wider measure as the value of goods and services bought by or for US residents. Retail sales arrives weeks earlier, and that head start is why markets watch it.
How the Census builds the monthly number
The report rests on a survey sample. The Census Bureau’s notes on the Advance Monthly Retail Trade Survey give the details. About 4,800 firms take part, drawn from a larger monthly retail survey. Some 1,150 of them sit in the sample with certainty, because their sales sway whole industry groups.
The estimate itself is a ratio. For each kind of business, the Census takes the sample’s sales this month over the same firms’ sales last month. Then it applies that ratio to last month’s figure from the larger survey and adds up the industries:
advance estimate = last month's estimate x (sample sales this month / sample sales last month)
Traders then turn the level into two growth rates:
month-on-month % = (sales this month / sales last month - 1) x 100
year-on-year % = (sales this month / sales a year earlier - 1) x 100
For the real series, FRED divides the dollar total by a consumer price index and quotes the result in 1982-84 dollars:
real sales = nominal sales / price index x 100
The report lands at 08:30 New York time, about nine working days after the month ends, according to the Census. Each report also revises the month before it.
How we tested
We pulled every series on the TradingView web chart on 16 November 2026. The sales data are FRED:RSAFS and FRED:RRSFS, one value a month from January 1992 to September 2026, 417 months in all.
For the market side we used OANDA:EURUSD on the H1 chart. Release dates came from the Census Bureau’s MARTS release-date file, last revised 19 October 2026. That gave 38 release days from 14 September 2023 to 15 October 2026. The release hour is the H1 bar that opens at 08:00 New York and holds the 08:30 print. We compared its high-low range with the same 08:00 bar on every other weekday in the window. We also flagged days when it was the widest H1 bar between 00:00 and 16:00 New York.
Charts 4 and 5 are our own measurement from those bars. The other five are TradingView captures. We placed no trades, so no spread or commission enters any figure. Our editorial testing policy sets out how we run and report tests like this one.
The series and settings behind our numbers
Retail sales has no inputs to tune. Still, each figure here depends on a few choices, and the table lists them.
| Setting | What we used |
|---|---|
| Headline series | FRED:RSAFS, retail and food services, seasonally adjusted, current dollars |
| Real series | FRED:RRSFS, the same total in 1982-84 dollars |
| Window | January 1992 to September 2026, 417 months |
| Growth measures | Month on month and year on year, in % |
| Market symbol | OANDA:EURUSD, H1 bars |
| Release days | 38 Census dates, 14 September 2023 to 15 October 2026 |
| Release hour | H1 bar opening 08:00 New York, holding the 08:30 print |
| Baseline | Same 08:00 bar on every other weekday in the window |
| Widest-hour test | Widest H1 bar from 00:00 to 16:00 New York |
| Costs | None, because we simulated no trades |
The baseline matters most. The 08:00 hour is busy on any weekday, so a fair test compares like with like.
Reading retail sales on a chart
Chart 1 shows the full run since 1992, and it looks like a ramp. Two breaks stand out: the slide in late 2008 and 2009, and the hole in spring 2020. Everything else is a slow climb, because the series counts dollars, and dollars lose value over time.
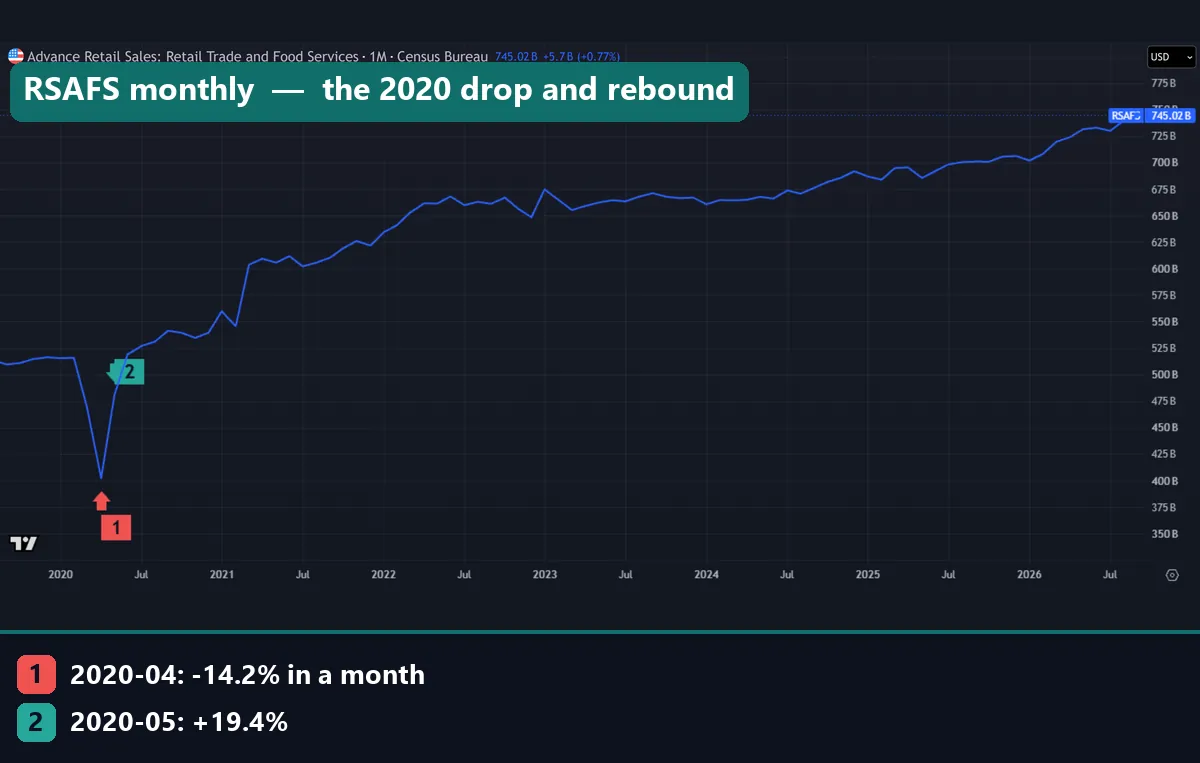
Chart 2 zooms in on October 2019 to September 2026. Marker 1 is April 2020, when sales fell 14.18% in a month, the deepest drop in our data. Then marker 2, May 2020, shows a 19.42% jump, the biggest rise. Next in size came March 2021, up 10.66%. After that the line goes flat from mid-2022 to the end of 2023, and then climbs again into 2026.
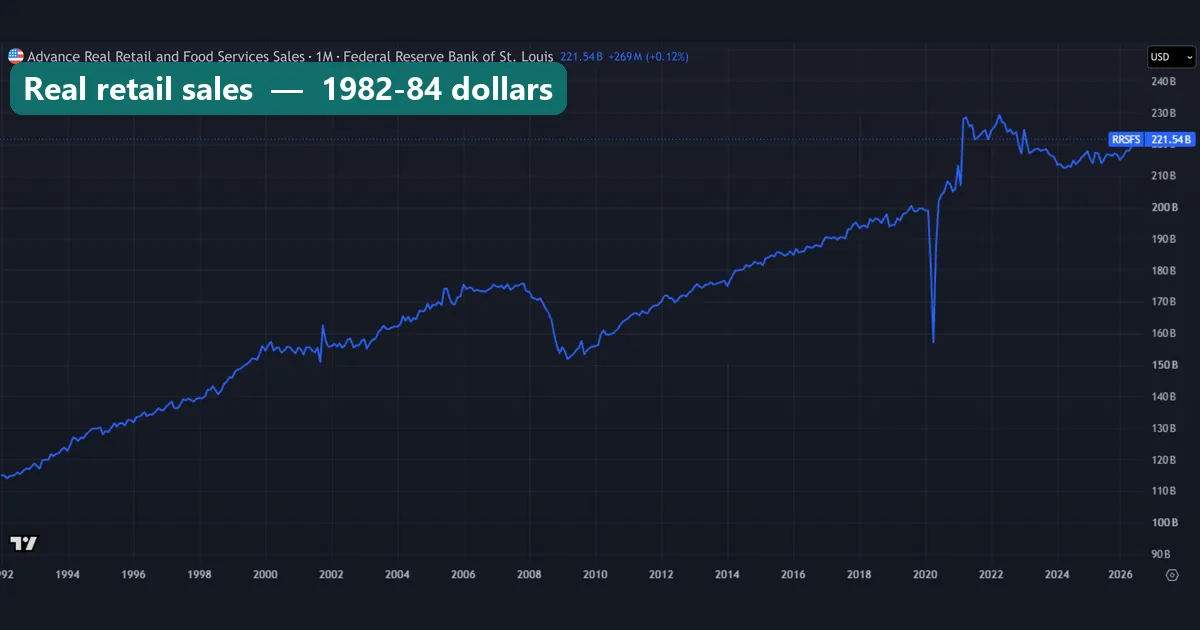
Chart 3 is the real series. In 1982-84 dollars, sales rose 1.92 times over the same window, or 1.91% a year. By contrast, the dollar line rose 4.68 times, or 4.55% a year. So more than half of the yearly growth came from prices, not from more goods. Real sales peaked in 2021 and 2022 and have not regained those highs. The last value on the chart is $221.54bn.
Worked example: the September 2026 report
The latest report in our data covers September 2026. The Census put it out at 08:30 New York on 15 October 2026. Here is how to read it in four steps.
Step 1, the level. Sales came in at $745.0bn for the month. The chart header shows $745.02bn, up $5.7bn on August.
Step 2, the monthly change. That works out to +0.77% on August. Our median month since 1992 is +0.41%, so September beat a normal month by a fair margin.
Step 3, the yearly change. Sales stood 6.29% above September 2025.
Step 4, take out prices. The real series rose just 0.12% in the month, to $221.54bn in 1982-84 dollars. So most of the 0.77% came from higher prices rather than more goods.
Then check the market. EUR/USD’s release bar on 15 October ran 28.0 pips from high to low, against our 17.7-pip baseline for that hour. It was also the widest hour of that New York day. Yet the pair closed the hour only 6.8 pips higher, a small dip for the dollar. In short, a big range and a small net move.
What a normal month looks like
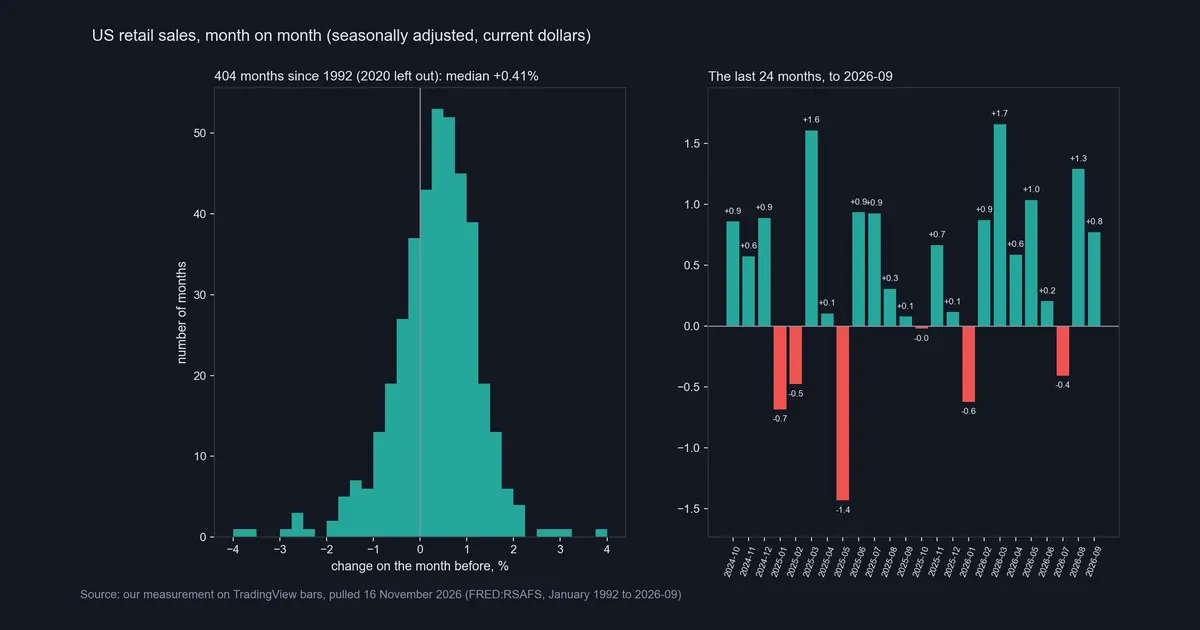
Chart 4 sorts every monthly change since 1992 into bins. We left 2020 out, so its two extreme months do not stretch the scale, and that leaves 404 months. The median is +0.41%, and the typical size of a move, up or down, is 0.66%. Most months land between -1% and +2%.
Falls are common, though. Sales dropped in 30.8% of all months, roughly one month in three. The right panel shows the last 24 months to September 2026. May 2025 was the weakest at -1.4%, and March 2026 the strongest at +1.7%. Six of the 24 bars are red.
So a single negative print is no alarm on its own. It needs a second weak month, or a weak real series, before it says much about the US shopper.
EUR/USD in the retail sales hour
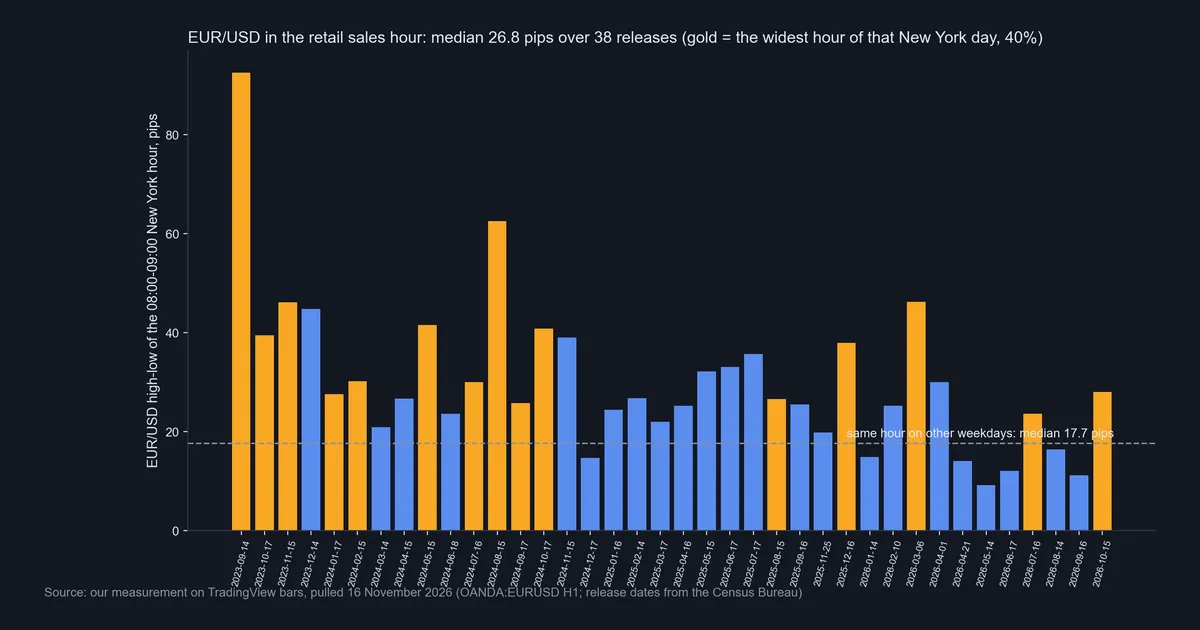
Chart 5 shows the H1 range of the release hour on all 38 days. The median is 26.8 pips. On other weekdays, the same 08:00 New York bar had a median of 17.7 pips. So the release hour ran 1.51 times wider. The hour before the release was calmer still, with a median of 13.8 pips.
Gold bars mark days when the release hour was the widest H1 bar of the New York day. That happened on 39.5% of release days.
Direction is the weak spot. The dollar fell during the release hour on 44.7% of the 38 days and rose on the rest. That is close to a coin toss. So the release adds range, but on its own it gives no lean.
Notice also that the bars shrink over time. In 2024, only one of 12 release hours fell below the 17.7-pip line. In 2026, six of 11 did. Part of that may be a calmer market overall, which our single baseline does not separate.
Download the complete indicator database
Put these concepts on your charts. One email unlocks the full library of 1,380+ indicators with compiled MT4 and MT5 files, plus my TradingView scripts. No paywall, no spam, unsubscribe any time.
Get free access to my indicator database
One email unlocks 1,380+ free MT4, MT5 and TradingView indicators — the complete library. No single-tool download; you get the whole database.
Where it fails
The first print is an estimate. The Census puts the average absolute revision to the advance figure at two-tenths of one percent. Our typical monthly move is 0.66%, so a revision can be a third of a normal month. A weak +0.1% can turn negative a month later.
Dollars are not volume. In 10.4% of months, the dollar total rose while real sales fell. A strong headline in a month of fast price rises can hide a drop in goods bought.
The hour is shared. Other US data land at 08:30 on many release days. Thursday brings weekly jobless claims, and producer prices, consumer prices or regional surveys sometimes share the slot. So our 26.8-pip median measures the whole 08:30 batch, not retail sales alone.
No forecast test. We did not compare each print with market forecasts. So this guide cannot say whether a beat pushes the dollar one way. It can only say the raw hour had no steady lean.
The calendar can break. A lapse in federal funding held up the October 2025 release. September 2025 data only came out on 25 November 2025, and later reports ran late into early 2026: 14 January, 10 February, 6 March, 1 April and 21 April. Normal mid-month timing returned with the 14 May 2026 release.
Smoothed data only. We had no unadjusted series, so we make no claims about holiday months.
Two release hours on the hourly chart
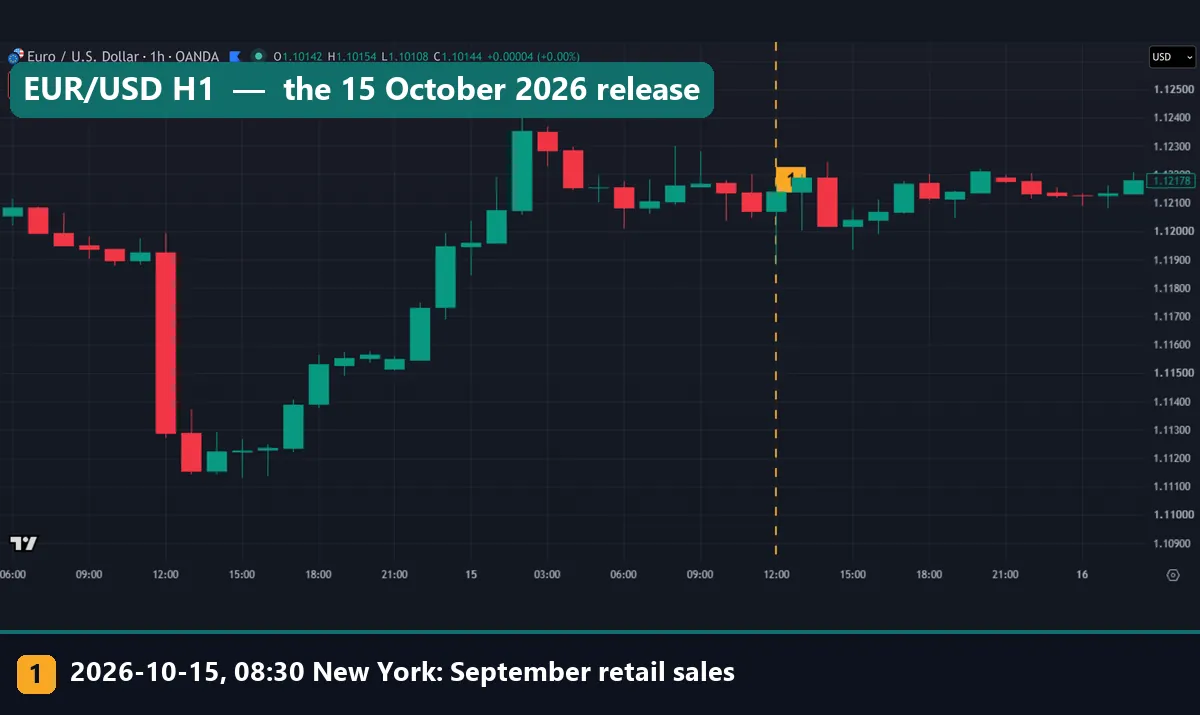
Chart 6 is OANDA:EURUSD on H1 from 14 to 16 October 2026. The chart clock runs on UTC, so the gold line sits on the 12:00 bar. That bar opens at 08:00 New York and holds the 08:30 release. It has a long lower wick: the pair dropped, then recovered to close 6.8 pips up. Two hours later, a red candle with a larger body took back the gain.
Look left on the same chart, though. On 14 October, the same 12:00 bar printed a far larger red candle, and no retail report came out that day. And 15 October 2026 fell on a Thursday, the usual day for weekly jobless claims. That is the shared-slot problem in one picture.
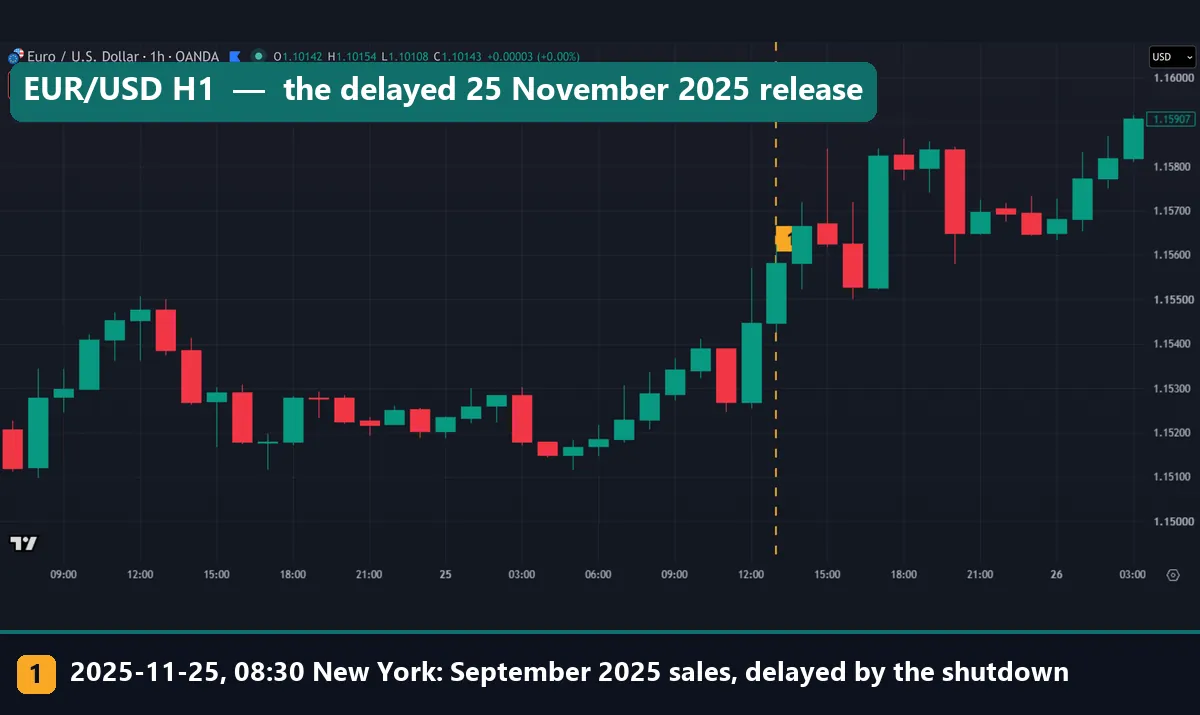
Chart 7 covers 24 to 26 November 2025 and the delayed September 2025 report. In November, New York runs on standard time, so the release bar opens at 13:00 UTC. Its range was 19.8 pips, and it closed 13.4 pips higher. But the hour before it ran wider, at 31.7 pips. Price was already rising into the number, and the release hour was not the widest of the day.
Four common mistakes with retail sales
Reading dollars as volume. The headline counts dollars. Check the real series, or at least that month’s CPI release and its forex impact, before you call spending strong.
Skipping the revision. Each report also revises the month before. A strong headline paired with a cut to last month can net out flat.
Treating the release as a direction signal. The data raise the range, not the odds of one side. Wider stops or smaller size suit that hour better than a bet on direction, as our guide to trading forex news spikes explains.
Blaming retail sales for every 08:30 move. Check what else came out in the same minute. Our economic calendar lists each release, and Thursdays usually carry jobless claims as well.
Where to go next
For the full set of market movers, start with high-impact news in forex, then learn how to read an economic calendar. Another consumer gauge pairs well with it: the University of Michigan consumer sentiment survey.
The labour side matters too, because shoppers need paychecks. Read about non-farm payrolls in trading and weekly initial jobless claims. For the wider economy, see gross national product, what imports measure and the M2 money supply. If you trade near the print, also read why spreads widen around data.
Outside this site, the retail sales entry at Investopedia gives a short primer. Between reports, the Federal Reserve’s Beige Book collects business reports from each Fed district.
FAQ: retail sales
What is retail sales in simple terms?
It is the dollar value of what US shops, online sellers and restaurants sold in one month. The Census Bureau estimates it from a survey of firms and takes out normal seasonal swings.
When does the US retail sales report come out?
It comes out at 08:30 New York time, usually mid-month. The date can slip, though: a federal funding lapse pushed the September 2025 data to 25 November 2025.
Why do forex traders watch retail sales?
Shoppers’ spending is a large part of the US economy, so the report shapes views on growth and interest rates. In our test, the EUR/USD release hour had a median range of 26.8 pips, against 17.7 pips on other weekdays.
What is the difference between nominal and real retail sales?
Nominal counts current dollars, while real takes out price changes. Since January 1992, nominal sales grew 4.55% a year and real sales only 1.91% a year.
Does a strong retail sales number lift the dollar?
Not in any steady way in our data. We did not compare each print with forecasts. But the raw release hour showed no lean: the dollar weakened in 44.7% of the 38 hours we measured.
Do retail sales figures change after release?
Yes. Each report revises the month before, and the Census Bureau puts the average absolute revision to the advance estimate at two-tenths of one percent.
Does retail sales include online shopping?
Yes. Online and other non-store sellers sit inside retail trade, so their sales count in the total.
Is it safe to trade the retail sales release?
It carries extra risk. The hour runs wider than normal, spreads can widen, and our sample showed no steady direction. Size any position for the wider range, and keep in mind that results are not guaranteed; past performance is not indicative of future results.
Last updated: 16 November 2026.

About the author
Written by Dominic Walsh, a Forex trader and MT4/MT5 indicator, Expert Advisor and script developer. Every tool on forexmt4systems.com is tested on live charts before release and ships with ready-to-use compiled MT4 (.ex4) and MT5 (.ex5) files. Learn more about the trader and developer behind this site.
How we build, test and correct every tool: Editorial & Testing Policy. Trading carries risk; see the disclaimer.