
World market hours are the set times when the big stock exchanges in Sydney, Tokyo, Hong Kong, Shanghai, Frankfurt, London and New York trade. This guide lists each one in UTC and New York time and shows how daylight saving moves them. Then it checks what the clock does to prices. We measured hourly bars on EUR/USD, USD/JPY, seven stock indices and the E-mini S&P 500 future to find the busy hours and the dead ones.
What world market hours actually are
Each exchange runs on its own local clock. Tokyo trades on Japan time, London on UK time and New York on Eastern Time. World market hours are those timetables put on one shared clock, so you can see who trades when. Most traders use UTC for this, because UTC never shifts for daylight saving.
The idea matters even if you never buy a share. Currencies have no exchange and trade around the clock on weekdays. But the banks and funds that move them keep the office hours of these cities. So the stock market timetable also marks the busy and quiet parts of the currency day. Our pages on forex trading sessions and forex market hours cover the currency side.
How the trading day moves from Sydney to New York
The mechanism is plain time zone arithmetic. Take the local opening time and subtract the city’s offset from UTC:
UTC time = local time - UTC offset
New York time = UTC time - 5 hours (US winter time)
New York time = UTC time - 4 hours (US summer time)
For example, Frankfurt opens at 9:00, and in winter Germany sits one hour ahead of UTC. So the open lands at 08:00 UTC, which is 03:00 in New York. Tokyo opens at 9:00 Japan time, nine hours ahead of UTC, so its open is 00:00 UTC.
Run that sum for every city and a loop appears. Sydney opens first, then Tokyo, then Hong Kong and Shanghai. Asia shuts at about the time Europe starts. London and Frankfurt then share their afternoon with the New York morning, and New York closes alone. Our forex time zone converter does this sum for any city.
Opening hours of the major exchanges in UTC and New York time
The table gives each regular session as the exchange publishes it, checked on 17 November 2026. It leaves out pre-open auctions and after-hours trade. We list the Asian lunch breaks because no shares change hands during them.
| Exchange | Local hours | UTC, winter (now) | New York time, winter | UTC, summer |
|---|---|---|---|---|
| Sydney (ASX) | 10:00 to 16:00 | 23:00 to 05:00 | 18:00 to 00:00 | 00:00 to 06:00 |
| Tokyo (JPX) | 9:00 to 11:30, 12:30 to 15:30 | 00:00 to 06:30 | 19:00 to 01:30 | 00:00 to 06:30 |
| Hong Kong (HKEX) | 9:30 to 12:00, 13:00 to 16:00 | 01:30 to 08:00 | 20:30 to 03:00 | 01:30 to 08:00 |
| Shanghai (SSE) | 9:30 to 11:30, 13:00 to 15:00 | 01:30 to 07:00 | 20:30 to 02:00 | 01:30 to 07:00 |
| Frankfurt (Xetra) | 9:00 to 17:30 | 08:00 to 16:30 | 03:00 to 11:30 | 07:00 to 15:30 |
| London (LSE) | 8:00 to 16:30 | 08:00 to 16:30 | 03:00 to 11:30 | 07:00 to 15:30 |
| New York (NYSE, Nasdaq) | 9:30 to 16:00 | 14:30 to 21:00 | 9:30 to 16:00 | 13:30 to 20:00 |
Tokyo’s times come from the JPX trading hours page, and Hong Kong’s from HKEX’s securities market trading hours. The New York core session sits on NYSE’s hours and calendars page, and Nasdaq lists the same hours. The ASX, the Shanghai Stock Exchange, Deutsche Börse and the London Stock Exchange publish theirs on their own sites. In the northern summer, add one hour to the New York column for Tokyo, Hong Kong and Shanghai, and two for Sydney.
Daylight saving: the weeks when the gaps change
Clocks are the main trap. Japan, Hong Kong and China do not use daylight saving, so their UTC times stay fixed. Europe and the US do switch, but not on the same dates. The US moves on the second Sunday of March and back on the first Sunday of November, per the NIST daylight saving time page. In 2026 that meant 8 March and 1 November. Europe switches on the last Sunday of March and of October, which in 2026 fell on 29 March and 25 October.
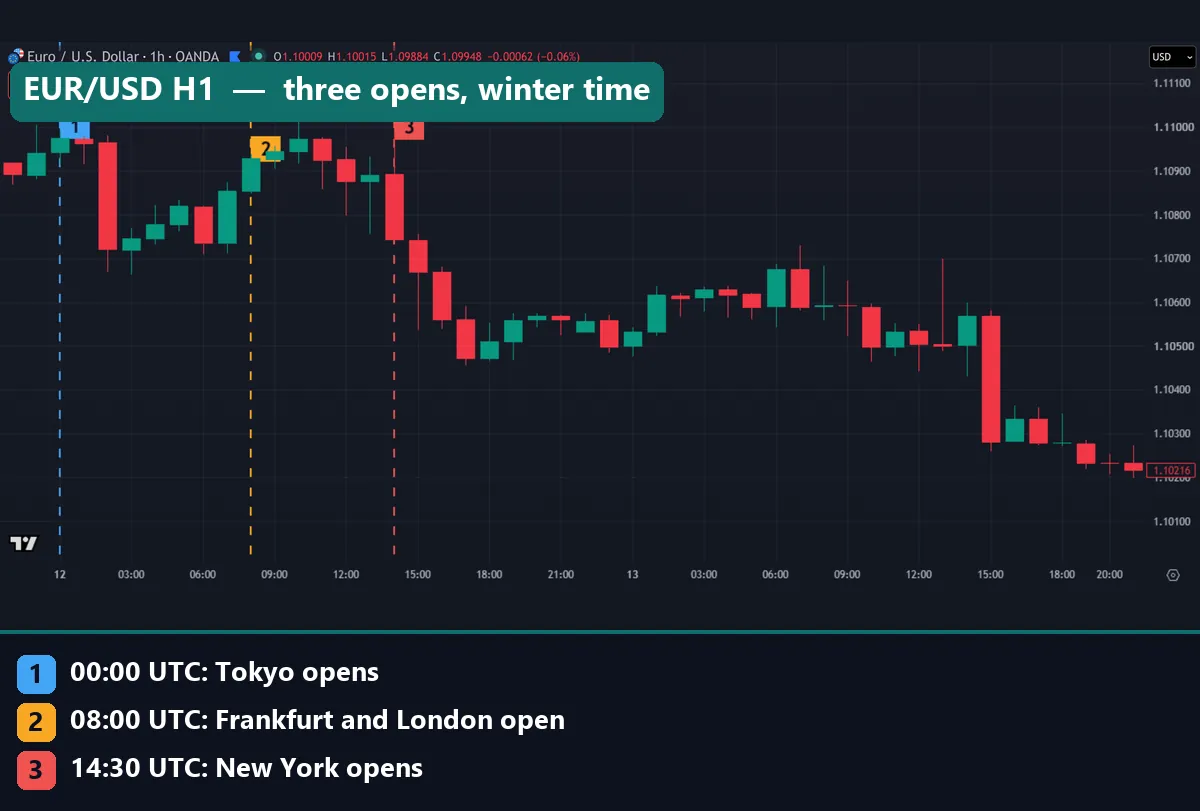
So for about three weeks in March and one in late October, London sits four hours ahead of New York, not five. In those weeks the London open lands at 04:00 New York time. Sydney goes the other way, with daylight time from early October to early April. The first image covers 12 and 13 November 2026, after both switches, so it shows winter times.
How we tested
We pulled hourly bars from the TradingView web chart on 16 and 17 November 2026. We dropped bars dated 17 November, since they were still forming. Three sets of numbers came out of it.
- Currencies: OANDA:EURUSD and OANDA:USDJPY on weekdays. For each UTC hour we took the median high-low range in pips.
- Stock indices: seven cash indices. For each day we measured the first bar’s range as a share of the day’s range, and checked whether the first or last bar held the day’s high or low. We skipped days with fewer than four bars.
- Index futures: CME_MINI:ES1!, the continuous E-mini S&P 500 future. For each New York clock hour we took the median volume as a share of the sum of all hourly medians.
The exchange hours did not come from our data. We read them on each exchange’s own site on 17 November 2026. Medians suit this job because one wild news hour cannot drag them far. Our editorial testing policy explains how we run checks like these.
The settings behind our numbers
Windows differ by symbol, so read each result with its own dates.
| Symbol | Window (hourly bars) | Days used |
|---|---|---|
| OANDA:EURUSD | 29 Aug 2023 to 16 Nov 2026 | Weekdays |
| OANDA:USDJPY | 16 Aug 2023 to 3 Nov 2026 | Weekdays |
| TVC:NI225 (Nikkei 225) | 11 Jul 2024 to 16 Nov 2026 | 570 |
| SP:XJO (S&P/ASX 200) | 19 Jun 2024 to 16 Nov 2026 | 613 |
| HSI:HSI (Hang Seng) | 27 Feb 2024 to 16 Nov 2026 | 663 |
| SSE:000001 (Shanghai Composite) | 28 Sep 2022 to 16 Nov 2026 | 999 |
| XETR:DAX | 17 Feb 2025 to 16 Nov 2026 | 445 |
| TVC:UKX (FTSE 100) | 13 Feb 2025 to 16 Nov 2026 | 445 |
| SP:SPX (S&P 500) | 5 Aug 2024 to 16 Nov 2026 | 574 |
| CME_MINI:ES1! | 11 Jul 2025 to 16 Nov 2026 | All sessions |
Reading exchange hours on a chart
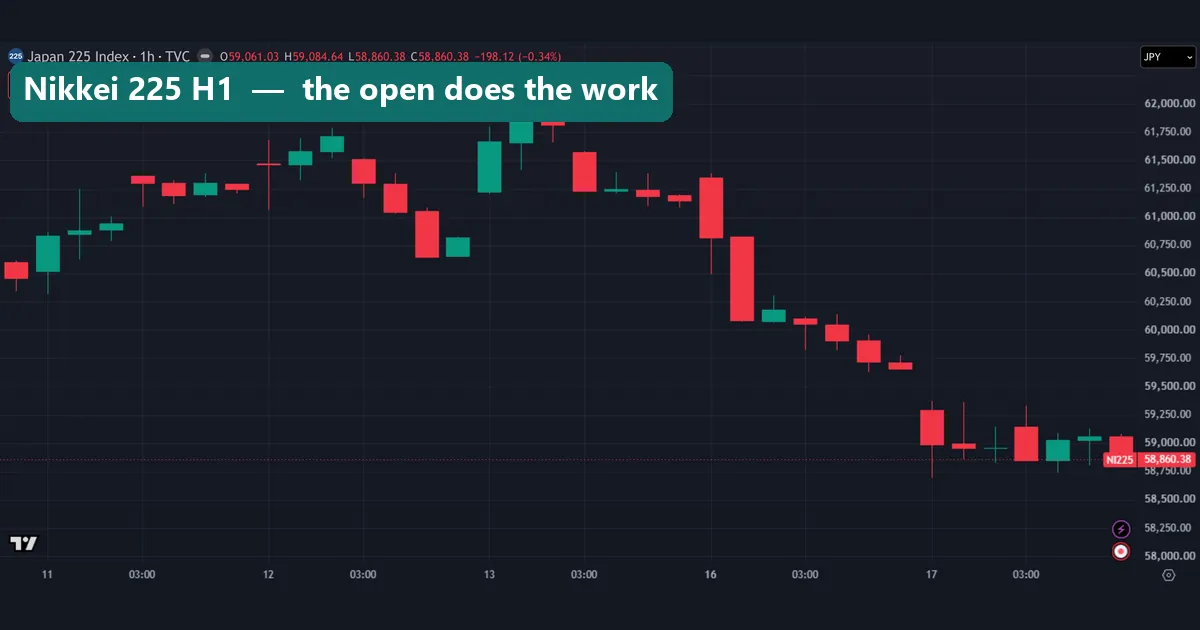
A cash index only prints bars while its exchange trades. The Nikkei 225 chart shows seven hourly bars per day, starting at 00:00 UTC, which is 9:00 in Tokyo. The lunch break falls inside two of those bars, so it leaves no hole. TradingView also squeezes out the empty night, so each session sits right next to the last. On 16 November the first two bars took the index from above 61,250 to just above 60,000. The five bars after that drifted lower in much smaller steps.
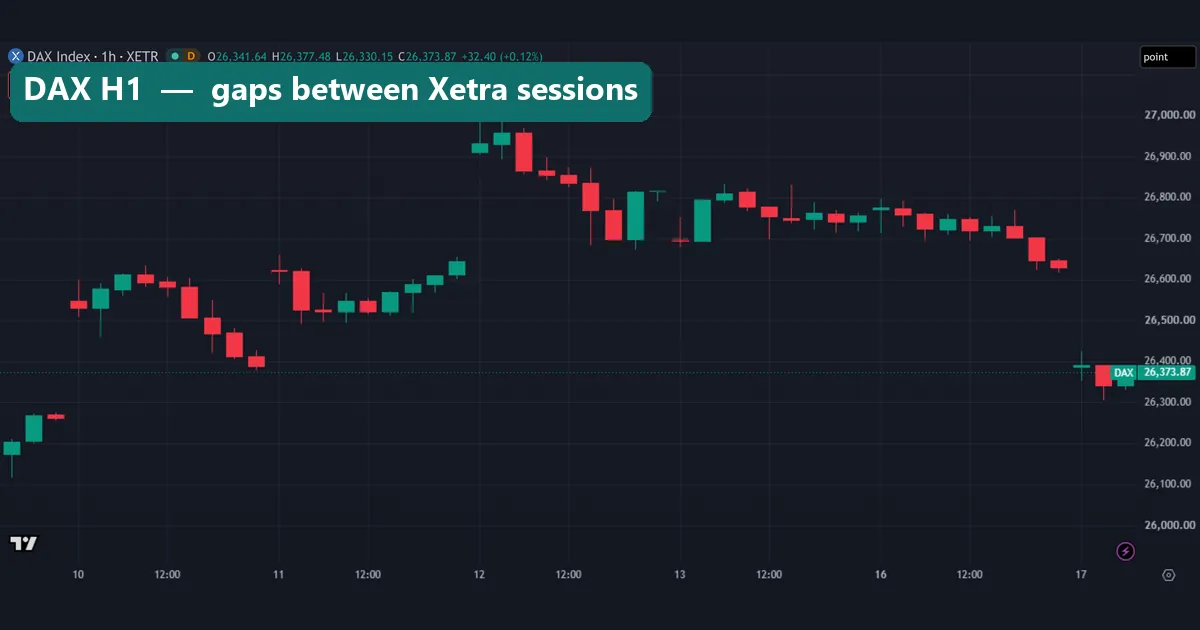
The DAX chart shows the other thing session bars do: gaps. Xetra trades from 08:00 to 16:30 UTC in winter, which gives nine hourly bars a day. News that lands overnight has nowhere to go, so it shows up at the next open. On 12 November the index opened above 26,900 after closing the day before in the 26,600s. On 17 November it opened near 26,400, again after a close in the 26,600s. Each jump built up while Frankfurt was shut.
Worked example: one EUR/USD day against the clock
Here is how the table works on a real chart. Take EUR/USD on Thursday 12 November 2026, with New York on winter time. Each step pairs an open with our median range for that UTC hour.
- 00:00 UTC, Tokyo opens (19:00 in New York). Median range: 8.6 pips.
- 08:00 UTC, Frankfurt and London open (03:00 in New York). Median: 14.5 pips, against 6.0 pips at 04:00 UTC.
- 14:30 UTC, New York opens (9:30 in New York). The 14:00 UTC hour has the day’s largest median, 19.0 pips.
- 21:00 UTC, New York closes. The 21:00 and 22:00 UTC hours are the quietest, at 4.8 and 4.7 pips.
The day fit that outline. The hour holding the New York open fell about 15 pips from just under 1.1090, and by 18:00 UTC the pair traded under 1.1050. From 20:00 to 22:00 UTC the candles barely moved, between 1.1050 and 1.1060. Yet a median is not a timetable. That same morning, the 02:00 UTC candle fell more than 20 pips during Tokyo trade, while the median for that hour is 7.6 pips.
The busiest and quietest hours, measured
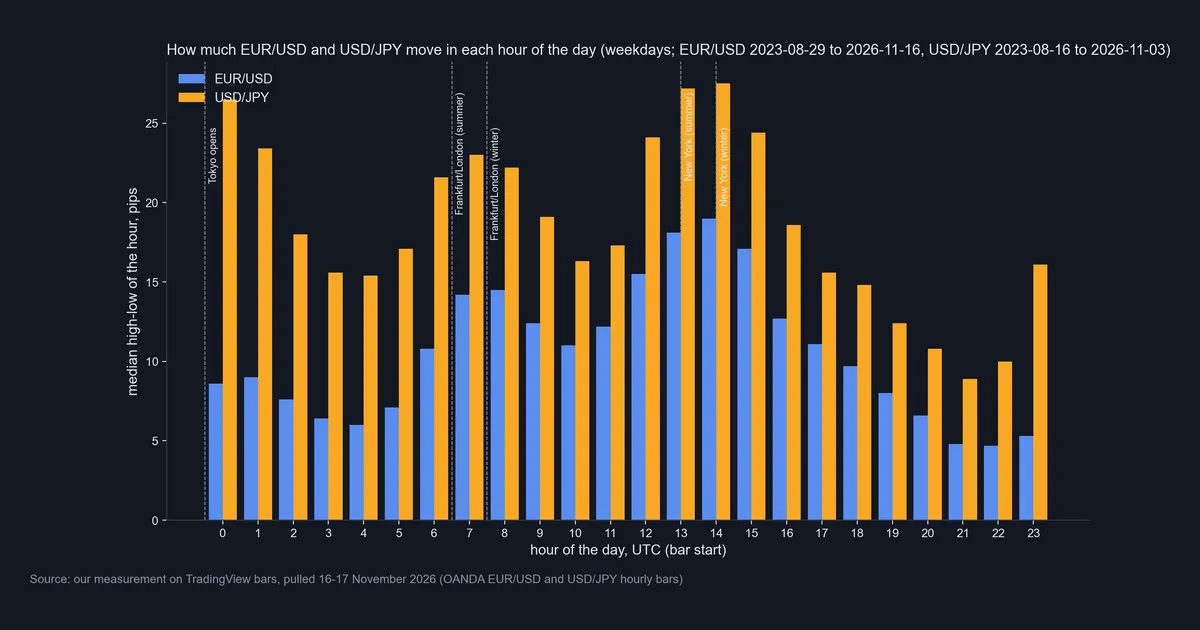
Across the whole window the shape repeats. EUR/USD stays quiet through the Asian afternoon, wakes at 07:00 UTC with 14.2 pips and peaks at 13:00 and 14:00 UTC with 18.1 and 19.0 pips. Then the range fades to 4.7 pips at 22:00 UTC. So the busiest hour moves about four times as far as the quietest. Both 07:00 and 08:00 run high because our window mixes summer, when Europe opens at 07:00 UTC, with winter.
USD/JPY, measured from 16 August 2023 to 3 November 2026, has a second peak. Its median for 00:00 UTC is 26.5 pips, close to its high of 27.5 pips at 14:00 UTC. For the yen the Tokyo morning counts, while for the euro it barely does. Our Asian trading session guide covers that window.
E-mini S&P 500 futures show the same clock in volume. From 11 July 2025 to 16 November 2026, the 9:00 New York hour carried 13.4% of the day, the 10:00 hour 16.7% and the 15:00 hour 16.1%. Each overnight hour carried between 0.4% and 1.3%. And there are no bars from 17:00 to 18:00 New York time, the daily CME pause.
What the first hour after each open does
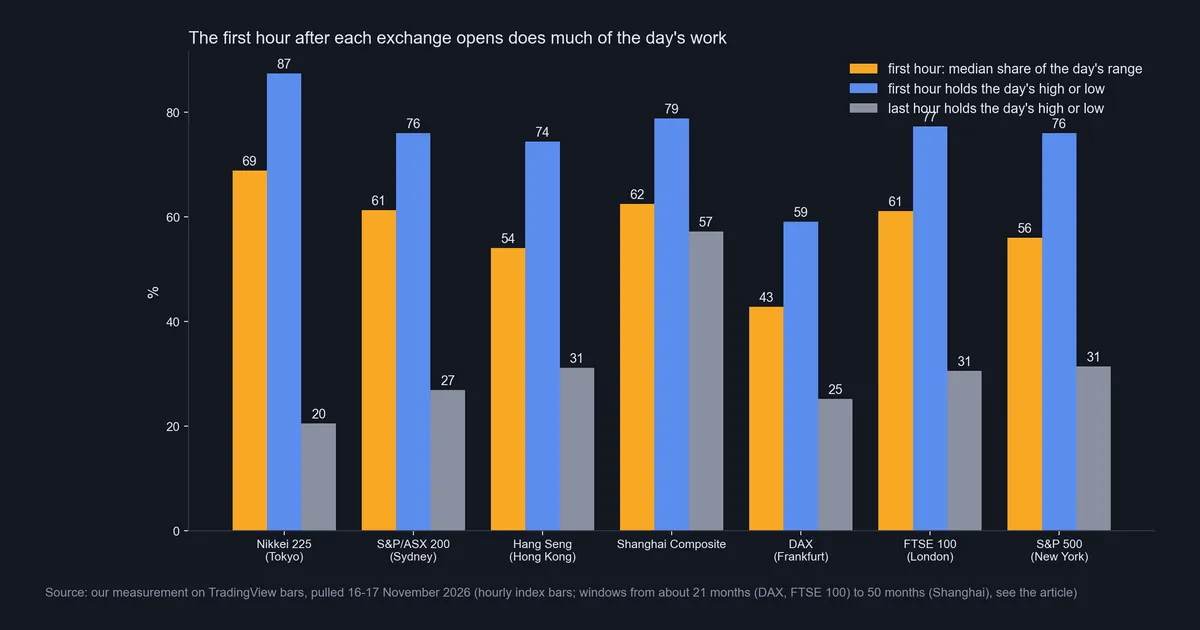
For the seven indices we asked two things. How much of the day’s range does the first hourly bar cover, and how often does it hold the day’s high or low?
| Index | First bar, median share of range | First bar holds high or low | Last bar holds high or low |
|---|---|---|---|
| Nikkei 225 | 68.9% | 87.4% | 20.5% |
| S&P/ASX 200 | 61.3% | 76.0% | 26.9% |
| Hang Seng | 54.1% | 74.4% | 31.2% |
| Shanghai Composite | 62.5% | 78.8% | 57.2% |
| DAX | 42.8% | 59.1% | 25.2% |
| FTSE 100 | 61.1% | 77.3% | 30.6% |
| S&P 500 | 56.0% | 76.0% | 31.4% |
The Nikkei stands out, with a first hour that held the high or low on 87.4% of 570 days. The DAX sits at the other end. On 12 November its high came in the first two bars, near 27,000, but the index then slid below 26,700. For background, see what indices are and how they work.
Download the complete indicator database
Put these concepts on your charts. One email unlocks the full library of 1,380+ indicators with compiled MT4 and MT5 files, plus my TradingView scripts. No paywall, no spam, unsubscribe any time.
Get free access to my indicator database
One email unlocks 1,380+ free MT4, MT5 and TradingView indicators — the complete library. No single-tool download; you get the whole database.
Where it fails
The opening times are fixed, but what happens inside them is not. These are the limits we hit.
- Medians hide single days. The 12 November Tokyo candle moved well over twice its median. A data release can make any hour the busiest of the week.
- Bar counts bias the comparison. Shanghai has four hourly bars a day and the DAX nine, so a Shanghai bar covers more of its day. That also lifts Shanghai’s last bar, which held the high or low on 57.2% of days.
- Seasons blur the UTC hours. Our windows mix summer and winter, so one UTC hour can hold the New York open in July and the hour before it in December.
- The windows are short. They run from 445 to 999 trading days. That shows a shape, not a law.
- Hours change. Tokyo stretched its afternoon session to 15:30 in November 2024, inside our Nikkei window. Local holidays also shut one market while the rest trade; see our forex bank holidays page.
Most of all, none of this is a signal. A first hour that often sets the high or low does not tell you which one, or when the move is done.
Bars that do not match the clock
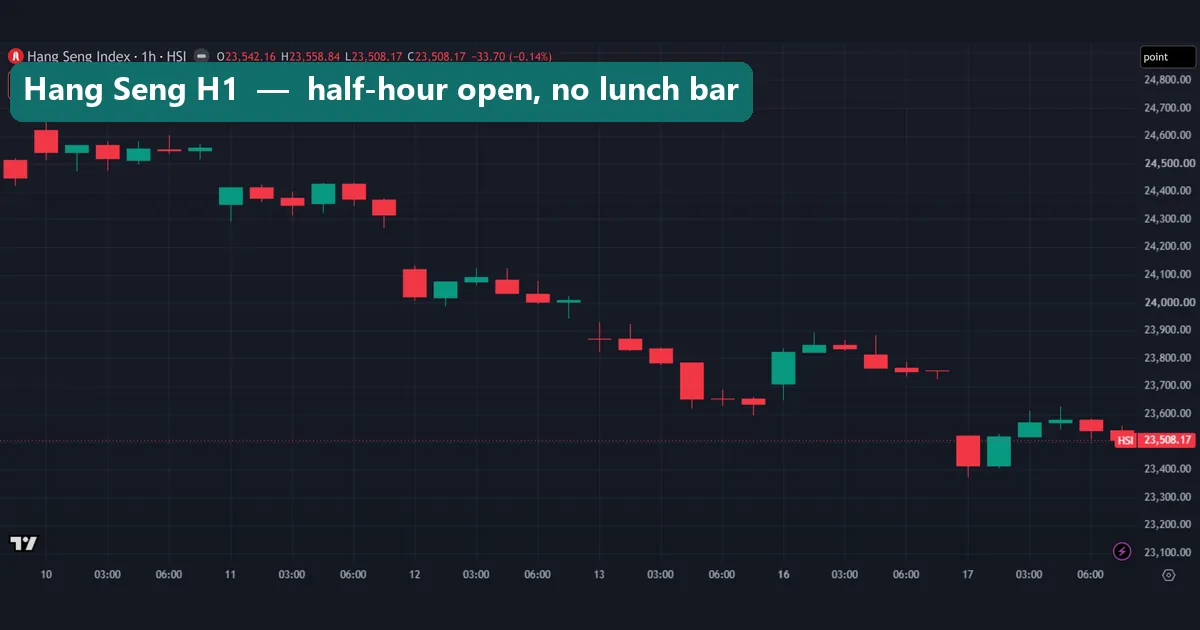
TradingView’s hourly bars for Hong Kong and Shanghai do not line up with clock hours. The Hang Seng chart shows six bars a day. The first starts at 01:30 UTC and covers only the half hour from 9:30 to 10:00 in Hong Kong. Then come bars at 02:00 and 03:00 UTC, none for lunch, and three more at 05:00, 06:00 and 07:00 UTC. Shanghai’s bars start at 01:30 and 02:30, skip lunch, then run at 05:00 and 06:00 UTC. So the Hang Seng’s first hour in our table is really its first 30 minutes. On 13 November its first two bars traded above 23,900, yet the biggest candle came at 05:00 UTC, right after lunch.
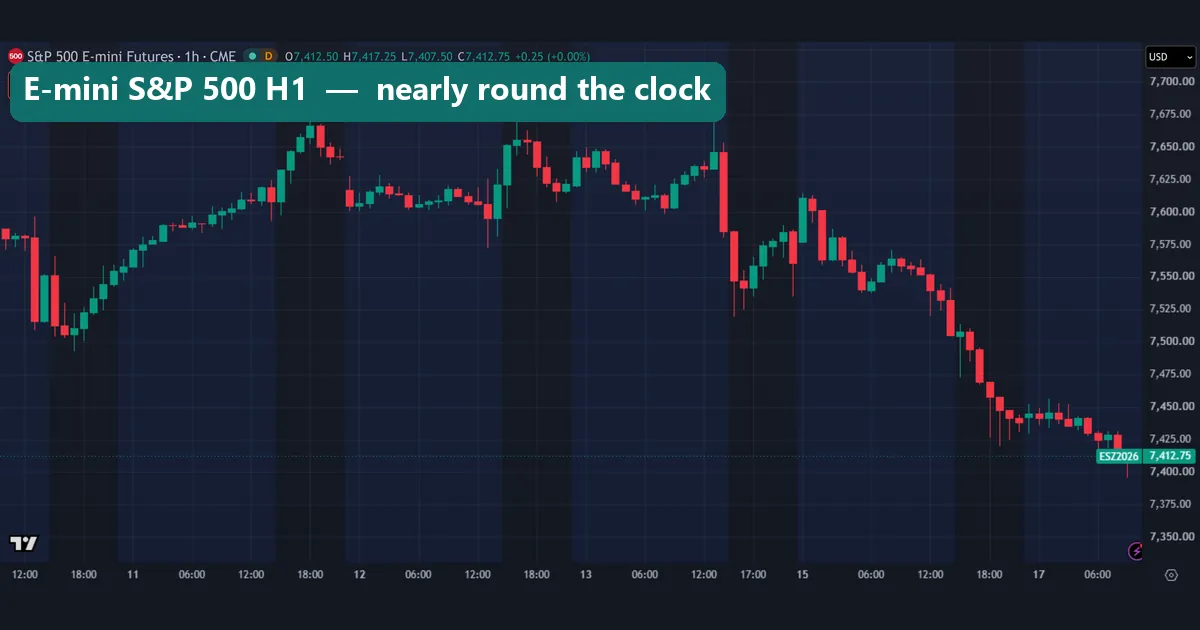
Futures ignore most of this. The E-mini S&P 500 chart has bars almost round the clock, with darker shading over the regular day session. On 13 November the hour holding the cash open fell from above 7,640 to the 7,580s. On 16 November the price slid from above 7,525 to below 7,450 by the end of the day session, and the overnight bars after it moved far less. Our Nikkei futures guide covers the same idea for Tokyo.
Four common mistakes with world market hours
Using one offset all year. London is five hours ahead of New York for most of the year and four hours ahead for about four weeks. A fixed offset puts alerts and session boxes an hour off.
Treating forex sessions as exchange hours. Currencies do not stop when Tokyo closes. Even the quietest EUR/USD hour in our data had a median range of 4.7 pips. Our guide to when the forex market opens covers the weekly start.
Reading an index gap as a missed trade. Nobody could buy the DAX on Xetra at the prices inside the 12 November gap. The move built up in futures and currencies overnight. Our guide to chart gaps sorts the types.
Trading the first hour on reflex. A first bar that holds the high or low on most days still does not say which side. Wait for it to close, and treat its range as a level, not a forecast. The killzones guide shows how session timing fits into a plan.
Where to go next
For the currency side of the clock, read our pages on the London trading session and the New York trading session. Our guide to pre-market trading covers the hours before 9:30 in New York. For timing around data, check forex news release times. Then see forex pair volatility for daily ranges and the weekend gap in forex for Monday jumps.
For the official hours, go to the JPX, HKEX and NYSE pages linked above, and to NIST for the US clock change. Check them before you rely on any table, ours included.
FAQ: world market hours
What time does the stock market open around the world?
Among the exchanges in our table, Sydney opens first, at 23:00 UTC in the northern winter. Tokyo follows at 00:00 UTC, then Hong Kong and Shanghai at 01:30. Frankfurt and London start at 08:00 UTC in winter, and New York at 14:30.
Which markets overlap the most?
London and New York. In winter both trade from 14:30 to 16:30 UTC, and EUR/USD’s two busiest hours in our data sit around that overlap. Tokyo and London do not overlap at all in stocks.
Do world market hours change with daylight saving?
In UTC, Europe, the US and Sydney shift, while Tokyo, Hong Kong and Shanghai stay put. Because the US and Europe switch on different Sundays, the London to New York gap drops to four hours for a few weeks a year.
Does forex trade when the stock exchanges are shut?
Yes, around the clock through the working week. Activity drops, though. The quietest EUR/USD hours, 21:00 and 22:00 UTC, had median ranges of 4.8 and 4.7 pips.
Why do Hang Seng bars on TradingView start at 01:30?
Hong Kong opens at 9:30 local time, which is 01:30 UTC. The first hourly bar covers the half hour to 10:00, later bars run on the hour, and the lunch break has no bar.
What is the busiest hour of the trading day?
For both EUR/USD and USD/JPY it was 14:00 UTC, with medians of 19.0 and 27.5 pips. In E-mini S&P 500 futures, the 10:00 New York hour carried the most volume, 16.7% of the day.
Do index futures follow exchange hours?
Not fully. The E-mini S&P 500 trades nearly 23 hours a day, with a pause from 17:00 to 18:00 New York time. Still, each overnight hour carried only 0.4% to 1.3% of volume in our data.
Should I only trade the first hour after the open?
Not on that fact alone. The first hour held the high or low on most days for all seven indices, but it does not tell you which side. Test any session rule on your own market, with costs, before you use it; results are not guaranteed; past performance is not indicative of future results.
Last updated: 17 November 2026.

About the author
Written by Dominic Walsh, a Forex trader and MT4/MT5 indicator, Expert Advisor and script developer. Every tool on forexmt4systems.com is tested on live charts before release and ships with ready-to-use compiled MT4 (.ex4) and MT5 (.ex5) files. Learn more about the trader and developer behind this site.
How we build, test and correct every tool: Editorial & Testing Policy. Trading carries risk; see the disclaimer.