
A broadening wedge is a chart pattern where two trend lines slope the same way and move apart, so each swing is wider than the last. This guide settles three things. First, how to draw one with a fixed rule. Next, which way 644 daily patterns on 23 currency pairs broke. Finally, why the break direction is easy to call while the move after it is not.
What a broadening wedge is
There are two versions. In an ascending broadening wedge, both lines rise, but the upper one rises faster. In a descending one, both lines fall, and the lower one falls faster. Either way, the gap between the lines grows.
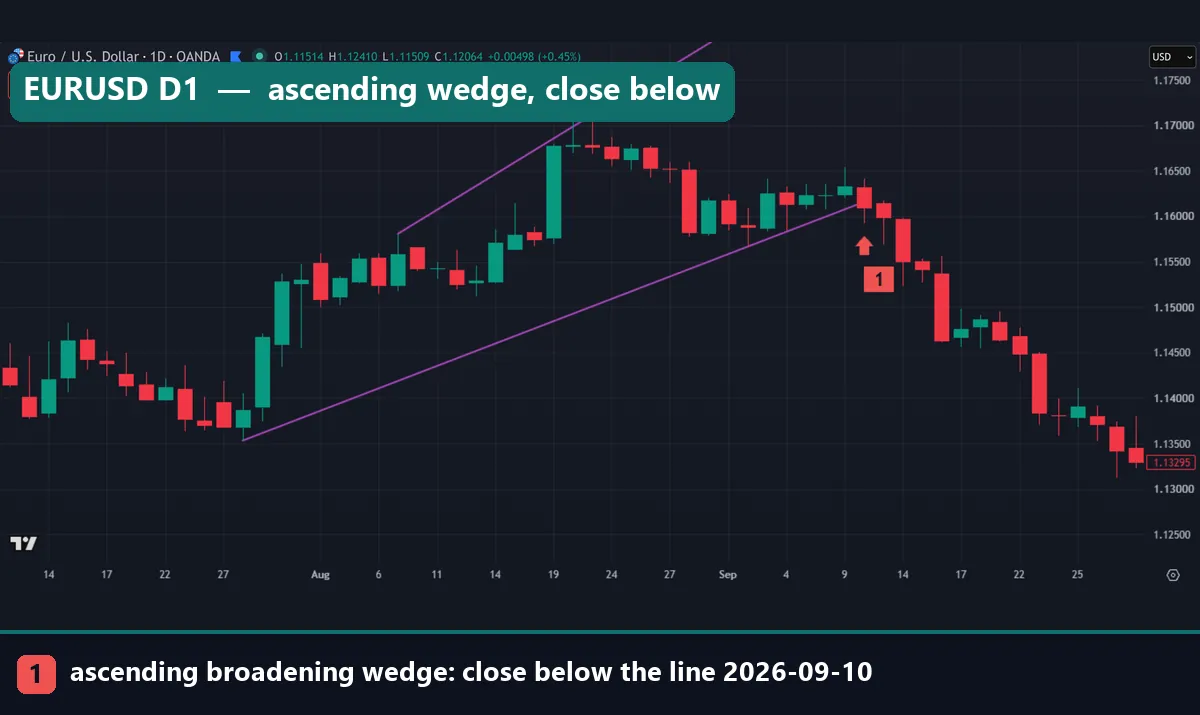
The chart above shows an ascending one on the EURUSD daily chart. Its upper purple line joins the highs of 7 and 21 August 2026. The lower one joins the lows of 28 July and 2 September. Price closed below the lower line on 10 September, at marker 1, and then kept falling.
Thomas Bulkowski calls the ascending version a megaphone tilted up on his ascending broadening wedges page at ThePatternSite. He notes that it most often breaks down in his stock data. Ours come from currency pairs.
Broadening wedge vs megaphone and the normal wedge
Three shapes get mixed up here, and only the slopes differ.
- Megaphone: the upper line rises and the lower line falls. Our megaphone pattern guide tests that shape.
- Broadening wedge: both lines slope the same way and spread apart, because one is steeper.
- Rising or falling wedge: both lines slope the same way and squeeze together. See what a wedge pattern means.
The broadening top entry on Wikipedia treats the flat megaphone as a topping pattern. Tilting it adds a trend, and as we show later, that tilt decides where the first close outside the lines tends to happen. For the narrowing shapes, see our falling wedge pattern guide and the rising wedge vs ascending triangle comparison.
How it works: two lines and a slope rule
Each line runs through two swing points. The upper line joins the first and the last swing high. The lower line joins the first and the last swing low. Then extend each line to the right:
slope = (P2 - P1) / bars between P1 and P2
line value = P2 + slope × bars since P2
Our rule then compares the slopes. The steep line must move at least 1.3 times as fast as the flat one, in the same direction.
The steep line catches the eye, but the flat line matters more. Picture price drifting sideways inside an ascending wedge. The lower line keeps rising until it meets price, while the upper line climbs away. So a quiet market tends to end with a close below the lower line, with no selling story behind it. The descending version is the mirror image. Our guide on how to use trend lines covers the basics.
How we tested the broadening wedge
We ran one fixed rule instead of picking patterns by eye, because eyes tend to find the shapes that worked.
Our statistics come from MetaTrader 4, build 1471, with Capital Point Trading history. The daily set covers 23 currency pairs from 12 June 2018 to 24 August 2026. For the hourly set, we used EURUSD, GBPUSD and USDJPY from 22 December 2025 to August 2026, plus gold (XAUUSD) from 1 July 2025 to 20 August 2026.
The chart examples come from the TradingView web chart with OANDA data. We took them on 15 October 2026 on daily, hourly and 15-minute charts. The purple lines come from the same rule.
We placed no trades. Instead, we logged which line price closed beyond first, and where it stood 10 bars later. So every figure is before spread, swap and commission. MT4 and OANDA only show tick volume, a count of price changes, so we left volume out. This method follows our editorial testing policy.
Our detection rules and settings
| Parameter | Our setting | Why it matters |
|---|---|---|
| Swing point | 3-bar swing high or low | The turns the lines use |
| Points | Five, alternating high and low | Two or more per line |
| Window | All five within 80 bars | Keeps stale swings out |
| Upper line | First and last swing highs | Middle highs do not move it |
| Lower line | First and last swing lows | Middle lows do not move it |
| Ascending | Both rise; upper at least 1.3 times as fast | Lines spread apart |
| Descending | Both fall; lower at least 1.3 times as fast | The mirror case |
| Width | At least 2 ATR at the last point | Drops tiny patterns |
| Break | First close outside a line within 30 bars | Otherwise, no break |
| Follow-through | Close 10 bars later beyond the break close | Did the break lead anywhere? |
ATR is the average true range, the typical size of one bar. Our guide to what ATR means in trading explains it, and TradingView’s help page on the Average True Range gives the formula. Change any setting and you get a different sample.
Reading a broadening wedge on a chart
On our charts, the purple lines are the pattern. Marker 1 is the first close outside them: green for a close above, red for a close below.
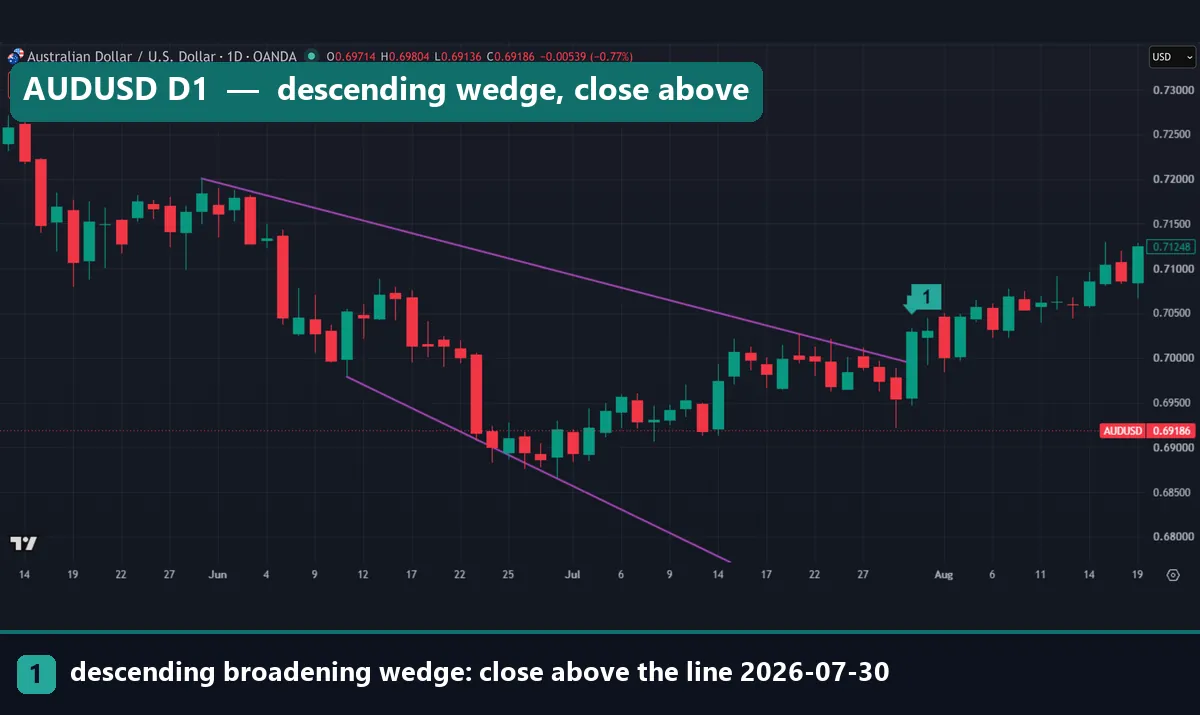
The AUDUSD daily chart shows a descending broadening wedge. Its upper line runs from the 0.72006 high on 29 May 2026 to the 0.70269 high on 21 July. The lower line runs from the 0.69789 low on 11 June to the 0.68654 low on 30 June. On 30 July a candle closed at 0.70297, above the upper line at 0.69940. Price climbed above 0.71000 by 19 August.
That is the common case. Here, the flat line sat just above price, while the steep line had dropped to 0.66733, about 356 pips below the close.
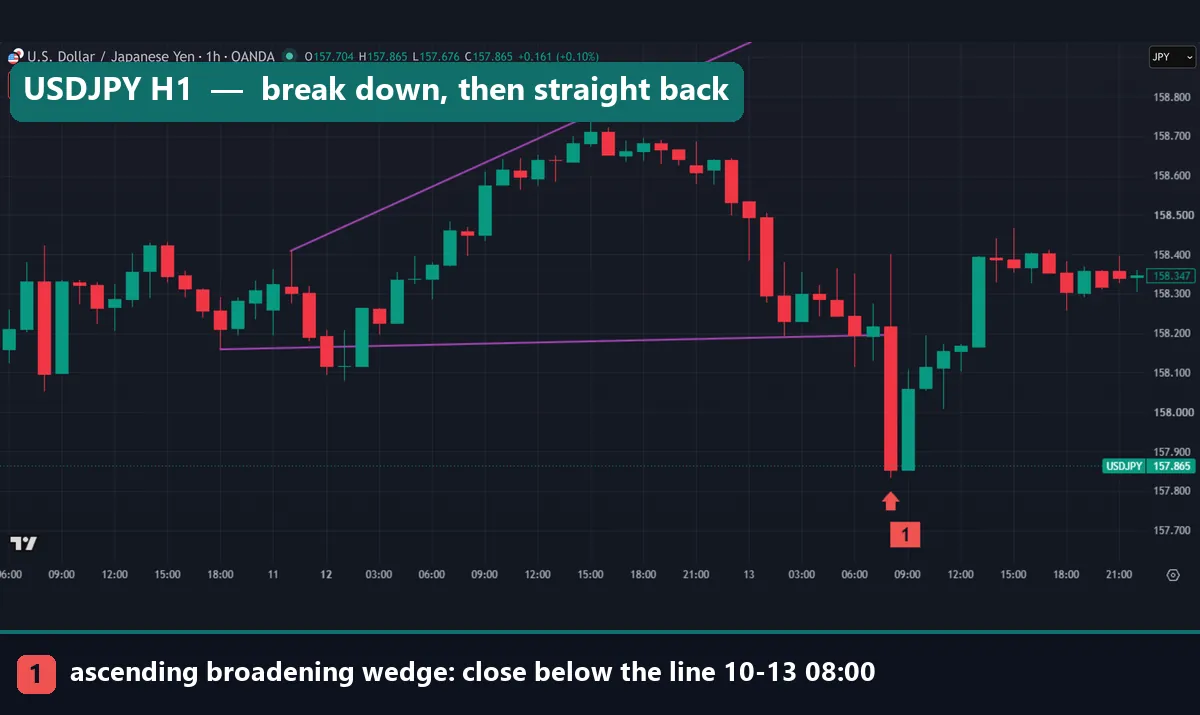
The USDJPY hourly chart is an ascending one that broke the expected way, then failed. The lower line is almost flat, from 158.159 on 9 October to 158.190 on 13 October. At 08:00 UTC on 13 October, a candle closed at 157.853, 34.3 pips under it. Later that day, price traded back above 158.300.
Note also the bars around midnight UTC on 12 October. Two of them closed below where the lower line now runs. The rule ignored them, because that line only exists once the last low has formed.
Worked example: the EURUSD daily broadening wedge
Here is the EURUSD pattern from the top of the page.
- Swing points: low 1.13532 (28 July 2026), high 1.15808 (7 August), low 1.15118 (13 August), high 1.17116 (21 August), low 1.15665 (2 September).
- Upper line: up 130.8 pips in 10 daily bars, or 13.1 pips per bar.
- Lower line: up 213.3 pips in 26 bars, or 8.2 pips per bar.
- Slope check: 13.1 divided by 8.2 is about 1.6, above our 1.3 minimum. So this is an ascending broadening wedge.
- Lines on 10 September: upper 1.18947, lower 1.16157, a width of 279 pips.
- Break: the 10 September close of 1.16100, 5.7 pips under the lower line.
On the break day, the close sat 285 pips under the upper line but only 5.7 pips under the lower one. An upside break needed a 285-pip rally. A downside break only needed a small slip. That is the geometry at work.
This one also followed through. Ten bars later, on 24 September, price closed well below 1.16100. Still, one clean example proves little, as the next section shows.
What 644 daily broadening wedges did
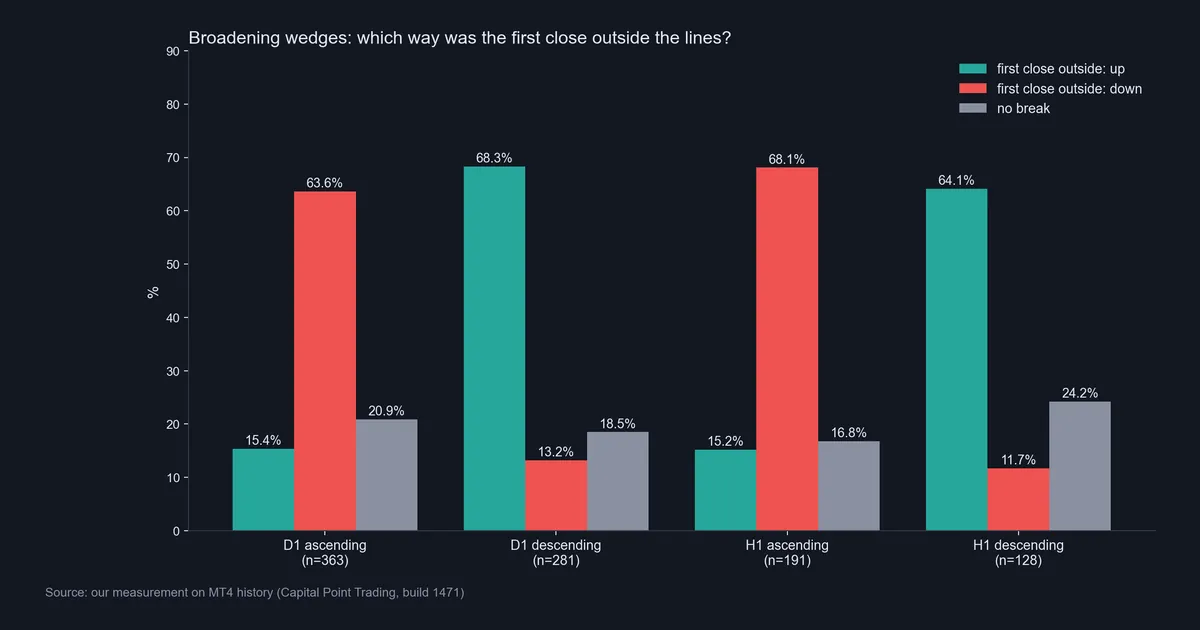
Our scan found 363 ascending and 281 descending patterns on the 23 daily pairs.
- Ascending, D1: 63.6% broke down, 15.4% broke up, 20.9% did not break within 30 bars.
- Descending, D1: 68.3% broke up, 13.2% broke down, 18.5% did not break.
- Ascending, H1 (191 cases): 68.1% down, 15.2% up, 16.8% no break.
- Descending, H1 (128 cases): 64.1% up, 11.7% down, 24.2% no break.
In every group, about two in three first closes came through the flatter line.
The move after the break is another story. Only 43.6% of daily ascending breaks were further along in their direction 10 bars later, and the median move was 0.28 ATR against the break. Descending ones followed through 50.7% of the time, with a median move of 0.04 ATR. On H1 the figures were 47.2% and 49.5%.
For scale, 52.3% of all days in the daily data closed higher 10 days later. So the pattern showed where price would leave the lines, but not where it would go next.
Why the flatter line breaks first
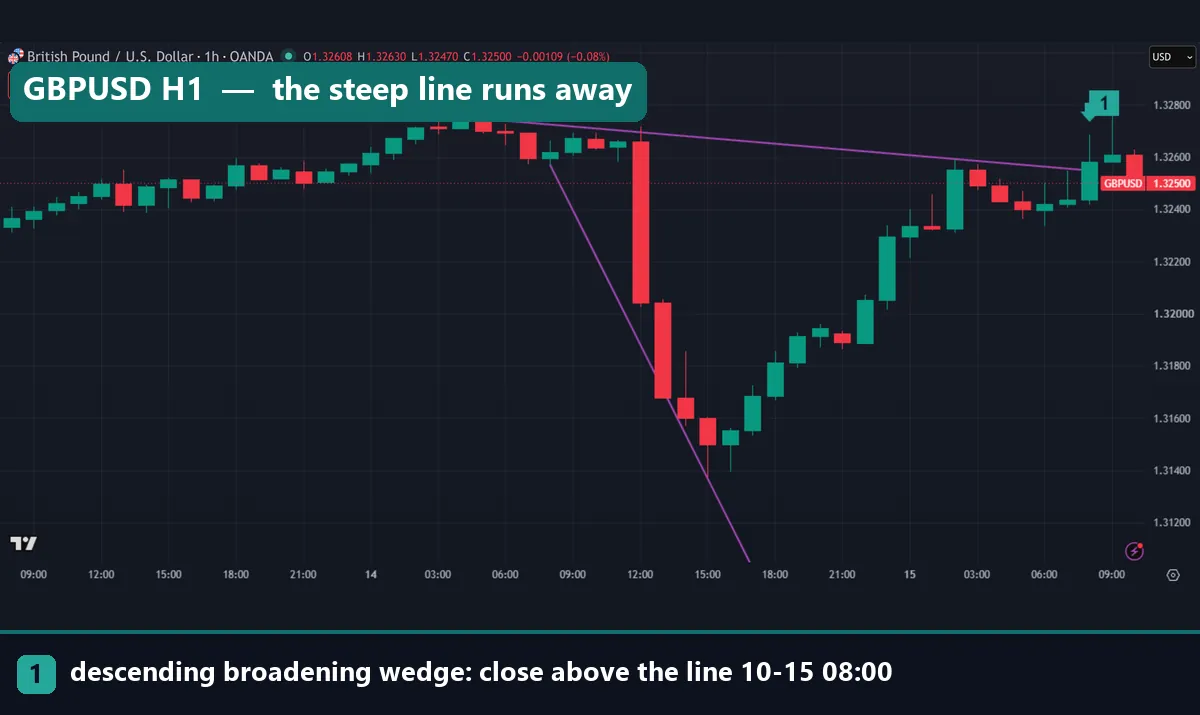
The GBPUSD hourly chart shows the geometry at its most extreme. Our rule labels it a descending broadening wedge. The upper line falls 16.1 pips in 22 hours, from 1.32753 to 1.32592. The lower line falls 119.8 pips in seven hours, from 1.32568 to 1.31370.
Now extend both lines to 08:00 UTC on 15 October. The upper line sits at 1.32548, and a candle closed above it at 1.32583. Meanwhile, the lower line has dropped to 1.28461, about 412 pips under the close. To break that line, price had to crash. To break the other, it only had to hold still.
That is the core of our 64% to 68% figures. A rule that demands one steep and one flat line sends a sideways market into the flat line first. We did not run a random price test, so we cannot say how much of the effect is pure geometry. Also, by eye this chart is a sharp drop and a V-shaped recovery, not a neat funnel. It ends an hour after the break, so it shows nothing about what came next.
Download the complete indicator database
Put these concepts on your charts. One email unlocks the full library of 1,380+ indicators with compiled MT4 and MT5 files, plus my TradingView scripts. No paywall, no spam, unsubscribe any time.
Get free access to my indicator database
One email unlocks 1,380+ free MT4, MT5 and TradingView indicators — the complete library. No single-tool download; you get the whole database.
Where it fails
- No edge after the break. Daily follow-through was 43.6% for ascending and 50.7% for descending patterns.
- The direction is mostly geometry. The flat line sits near price, and the steep line runs away.
- One in five never breaks. 20.9% and 18.5% of daily patterns stayed inside the lines for 30 bars.
- Two points per line. Middle swings can poke through, as on the USDJPY chart.
- It redraws. Each new swing can move both lines.
- The far line can be absurd. It can sit hundreds of pips away, as on GBPUSD.
- Thin samples. The hourly test covers four symbols over roughly eight to 14 months, and we did not test the 15-minute chart.
Bulkowski’s stock figures do not carry over to currencies either. Our backtest sample size guide explains why a few hundred cases still leave wide error bands.
Two breaks that went the rare way
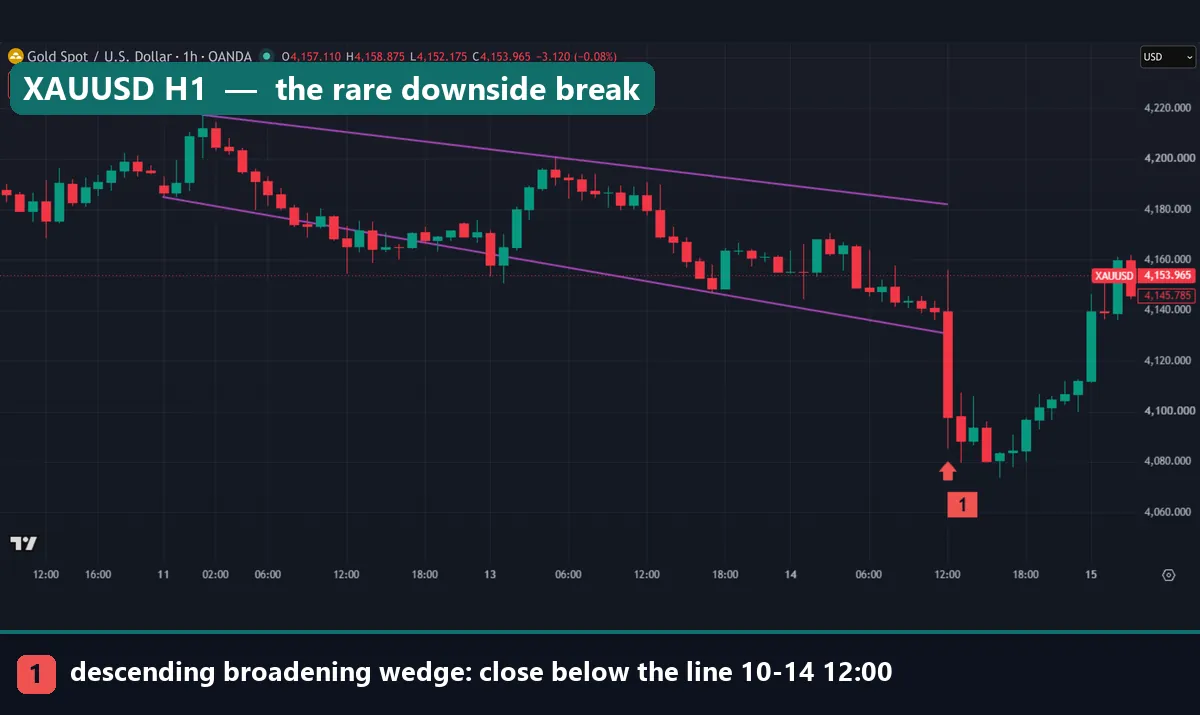
The gold hourly chart is a descending broadening wedge that broke down, the rare direction. The lower line joins the $4,184.85 low at 22:00 UTC on 11 October 2026 and the $4,147.00 low at 17:00 UTC on 13 October. At 12:00 UTC on 14 October, a candle closed at $4,097.91, about $33 under the line at $4,130.78.
Only 11.7% of hourly descending patterns broke down like this. Gold dipped further, then turned. By early on 15 October it traded back above $4,140.
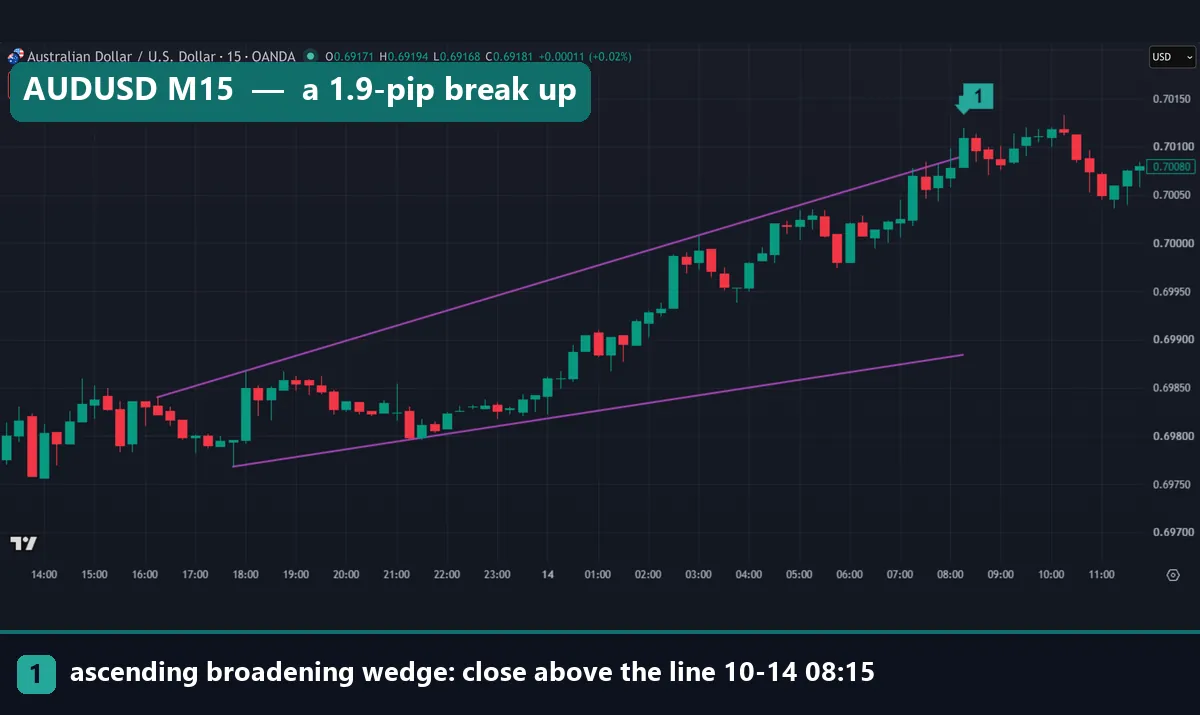
The AUDUSD 15-minute chart is an ascending one that broke up through its steep line. At 08:15 UTC on 14 October, a candle closed at 0.70109, just 1.9 pips above the line at 0.70090. Price then went sideways around 0.70100 for a few hours before slipping back under it.
We did not measure this timeframe, so treat it as an example. On a 1.9-pip margin, the spread alone can decide whether a break happened.
Common mistakes with the broadening wedge
- Trading the break direction as a signal. The flat line broke first most of the time, but the move after it showed no edge.
- Mixing up the shapes. Lines spreading in opposite directions make a megaphone. Lines squeezing together make a rising or falling wedge.
- Redrawing lines after the fact. Shifting a line until the last swing fits is hindsight. Our article on curve fitting in trading explains why that flatters results.
- Placing the stop beyond the far line. That line can sit hundreds of pips away. Our guide on ATR stop loss distance shows a volatility-based option.
Where to go next
Our ZigZag indicator marks swing highs and lows, and our peaks and troughs guide covers how swings define a trend. Our break and retest strategy test shows how often first breaks fail. Also, the chart pattern failure guide lists the usual ways patterns go wrong.
For outside reading, StockCharts ChartSchool’s article on trend lines covers how lines are drawn and tested.
FAQ about the broadening wedge
What is a broadening wedge pattern?
It is two trend lines that slope the same way and move apart. In the ascending version both rise, the upper one faster. In the descending version both fall, the lower one faster.
Is an ascending broadening wedge bearish?
It broke down in 63.6% of 363 daily cases. But only 43.6% of breaks were further along 10 bars later. So it pointed to the likely exit, not to a trend.
Is a descending broadening wedge bullish?
In our test, 68.3% of 281 daily cases closed above the upper line first. Yet only 50.7% of breaks followed through over 10 bars, about a coin toss.
What is the difference between a broadening wedge and a megaphone?
Both widen over time. In a megaphone, one line rises and the other falls. In a broadening wedge, both slope the same way and one is steeper, which keeps one line close to price.
How is it different from a rising or falling wedge?
A rising or falling wedge narrows because its lines converge. A broadening wedge widens because its lines diverge. They share the tilt, not the shape.
How many touches does a broadening wedge need?
Our rule used five alternating swing points. For the ascending version, Bulkowski asks for more touches in his stock work. We did not test whether stricter patterns behave better.
What is the price target for a broadening wedge?
Bulkowski targets the lowest low for an ascending wedge that breaks down, and the highest high for a descending wedge that breaks up. We did not test those targets.
Does the broadening wedge work on the hourly chart?
The hourly results matched the daily ones: 68.1% of ascending patterns broke down and 64.1% of descending ones broke up. Still, only 47.2% and 49.5% of breaks followed through. These figures are before costs; results are not guaranteed; past performance is not indicative of future results.
Last updated: 15 October 2026.

About the author
Written by Dominic Walsh, a Forex trader and MT4/MT5 indicator, Expert Advisor and script developer. Every tool on forexmt4systems.com is tested on live charts before release and ships with ready-to-use compiled MT4 (.ex4) and MT5 (.ex5) files. Learn more about the trader and developer behind this site.
How we build, test and correct every tool: Editorial & Testing Policy. Trading carries risk; see the disclaimer.