
This candlestick quiz uses six real charts and six short definition questions to test whether you can name a pattern when it appears on a live chart. Each answer sits behind a “Show the answer” button. Also, every answer shows what our own data found for that pattern across 23 daily FX pairs. Start with question 1 below.
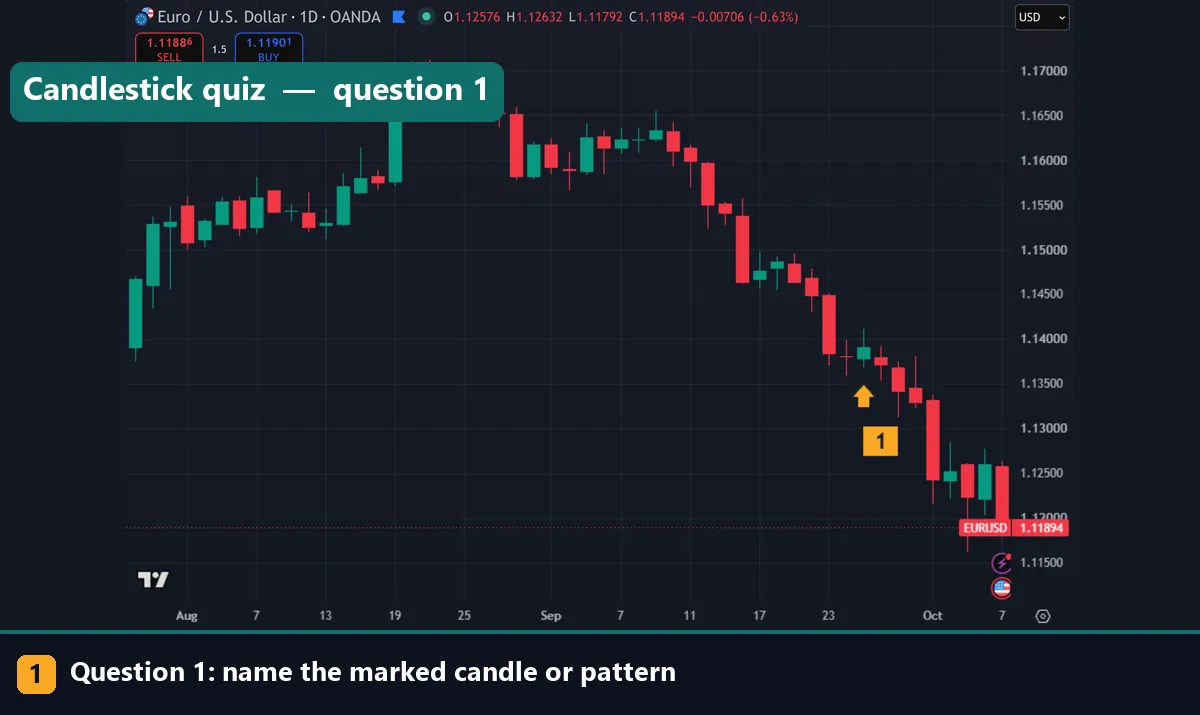
Question 1. The EURUSD daily chart above shows a decline through September 2026. The marker sits under the up candle from 25 September. Look at the candle before it too. What is the pattern?
Show the answer
Bullish engulfing. The 24 September candle is the first half of the pattern: a doji that opened at 1.13808 and closed at 1.13802, a tiny bearish body. Then on 25 September the next candle opened at 1.13788 and closed at 1.13911, so its body covers the whole body before it. In our daily test, bullish engulfing candles followed through 3 days later in 49.7% of 4,111 cases. That is below the 51.6% base rate, and EURUSD kept falling into October.
What a candlestick quiz tests
A candlestick shows one bar of price as a body and two wicks. The body runs from open to close, and the wicks mark the high and low. A pattern is a shape made by one to three bars. So this quiz checks two skills. First, can you spot the shape on a busy chart? Second, do you know the rule behind it?
Most quizzes stop at the name. We also show how often price moved the way each pattern suggests. If you need a refresher first, read our candlestick patterns explained page or the walk-through on how to read candlestick charts. Then come back and try the questions cold.
Five chart questions use daily charts and one uses a 1-hour chart. Each has one marker, labelled 1, next to the candle to name.
How we score each answer
Every answer gives the rule and a follow-through figure. First, our script finds every case of a pattern in the price history. Next, it checks the close 3 bars later. A bullish pattern counts as a follow-through when that later close sits above the pattern’s close. A bearish pattern counts when the later close sits below it. So the formula is simple: follow-through % = cases that moved the pattern's way / all cases x 100.
A raw percentage means little on its own, though. Daily FX bars drift a little higher in our sample: 51.6% of all bars closed higher 3 days later. So a bullish pattern needs to beat 51.6% to show any edge at all. For a bearish pattern the bar is 48.4%, which is 100 minus 51.6. Thomas Bulkowski ranks patterns the same way in his candlestick pattern statistics at ThePatternSite.
How we tested the candlestick quiz answers
We read the price history from a MetaTrader 4 terminal (Capital Point Trading, MetaTrader 4, build 1471). The sample covers 23 FX pairs on the daily timeframe, from 12 June 2018 to 24 August 2026. That gives 37,748 daily candles.
The quiz charts are separate. We drew them on the TradingView web chart with OANDA data on 7 October 2026. Gold and the 1-hour chart sit outside the daily FX statistics, and the answers say so.
Two limits apply to every number on this page. First, the figures measure where price closed, not trades. There is no stop, no target and no position size. Second, every figure comes before spread, swap and commission, because the MT4 history has no usable spread data. Our full method rules are in the editorial testing policy.
The pattern rules behind the answer key
Each answer uses the same rule our script used to count the pattern. The table lists the rules, sample sizes and 3-day results.
| Pattern | Rule we used | Cases | Follow-through, 3 days | Base rate |
|---|---|---|---|---|
| Bullish engulfing | Bearish candle, then a bullish body that covers it | 4,111 | 49.7% | 51.6% |
| Hammer | After a 5-bar fall: lower wick 2x body or more, small upper wick | 971 | 53.2% | 51.6% |
| Shooting star | After a 5-bar rise: upper wick 2x body or more, small lower wick | 1,613 | 46.5% | 48.4% |
| Doji | Body at most 10% of the range, range above 0.3 ATR | 3,824 | 52.3% | 51.6% |
| Morning star | Big bearish candle, small body, bullish close above its midpoint | 587 | 52.0% | 51.6% |
| Tweezer top | After a rise: matching highs, bullish then bearish | 1,142 | 48.9% | 48.4% |
| Evening star | Big bullish candle, small body, bearish close below its midpoint | 898 | 44.5% | 48.4% |
| Tweezer bottom | After a fall: matching lows, bearish then bullish | 1,102 | 53.3% | 51.6% |
| Bullish marubozu | Bullish body 90% of the range or more, above 0.7 ATR | 669 | 48.8% | 51.6% |
Most patterns sit within two points of the base rate. In short, the names are worth learning, but no single shape tells you much alone.
Reading the chart: questions 2 and 3
Look at the marked candle first. Then look at the bars before it, because both answers depend on the prior trend.
Question 2: GBPUSD daily
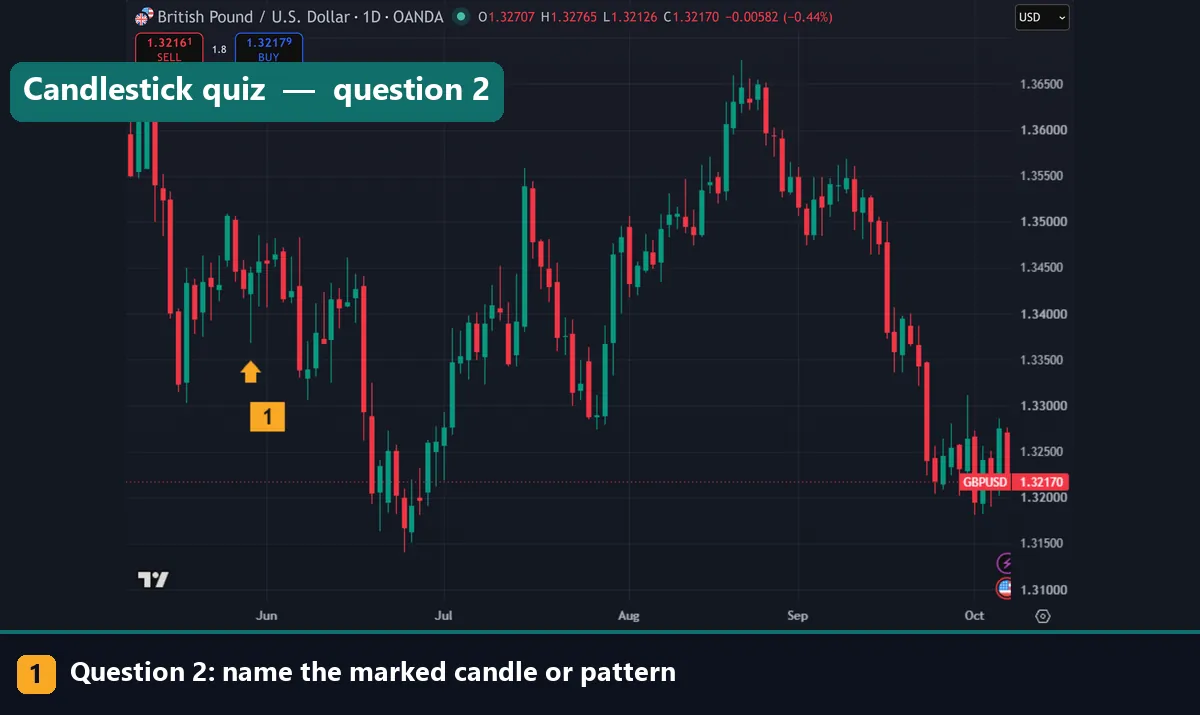
GBPUSD had dropped through mid-May 2026. The marker sits under the candle from 28 May. Name it.
Show the answer
Hammer. The candle has a small body near the top of its range and a long lower wick. It came after a decline. In our daily test, hammers followed through 3 days later in 53.2% of 971 cases, against a 51.6% base rate. The worked example below measures this candle in pips.
Question 3: XAUUSD daily
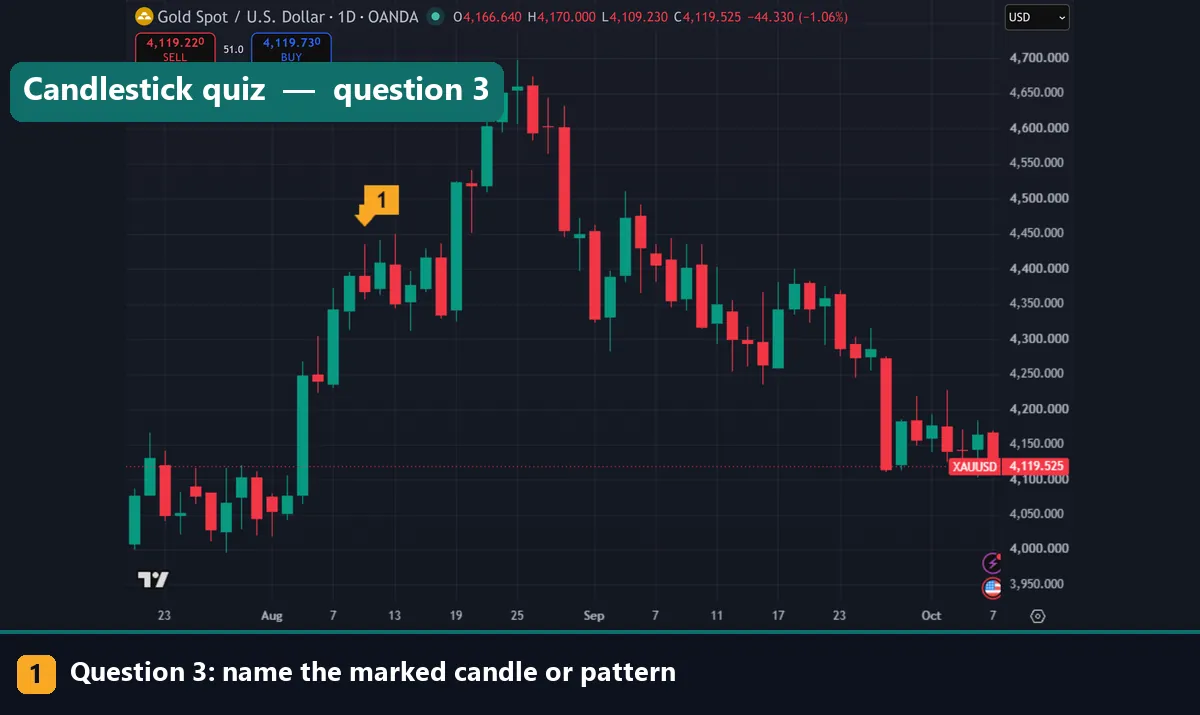
Gold climbed hard through early August 2026. The marker points down at the candle from 11 August. What is it?
Show the answer
Shooting star. It opened at $4,389.78, rose to $4,435.25, then closed at $4,368.25 near the low. So the upper wick of about $45 is more than twice the body of about $22. In our daily FX test, shooting stars followed through 3 days later in 46.5% of 1,613 cases. That is below the 48.4% bearish base rate. On this chart, gold then rallied toward $4,700 by late August.
Context matters as much as shape here. The same hammer shape after a rally would be a hanging man, as our hammer vs hanging man comparison shows.
Worked example: measuring the GBPUSD hammer
Now check question 2 against the rule. The 28 May 2026 GBPUSD candle opened at 1.34228. It traded down to 1.33676 and up to 1.34514. Then it closed at 1.34439.
- Body: 1.34439 minus 1.34228 is 21.1 pips.
- Lower wick: 1.34228 minus 1.33676 is 55.2 pips, which is 2.6 times the body.
- Upper wick: 1.34514 minus 1.34439 is 7.5 pips.
- Range: 1.34514 minus 1.33676 is 83.8 pips, so the upper wick is about 9% of it.
So the candle passes both shape tests. Also, the bars before it fell, so the hammer label fits.
What happened next? The chart shows GBPUSD drifting sideways for a few weeks and then dropping hard in the second half of June. So this hammer marked no lasting turn, which fits a 53.2% figure that is barely better than a coin toss.
Chart questions 4 and 5: a pause and a reversal
Question 4 uses a 1-hour chart. Question 5 is a three-candle pattern, so check the two bars before the marker too.
Question 4: USDJPY 1-hour
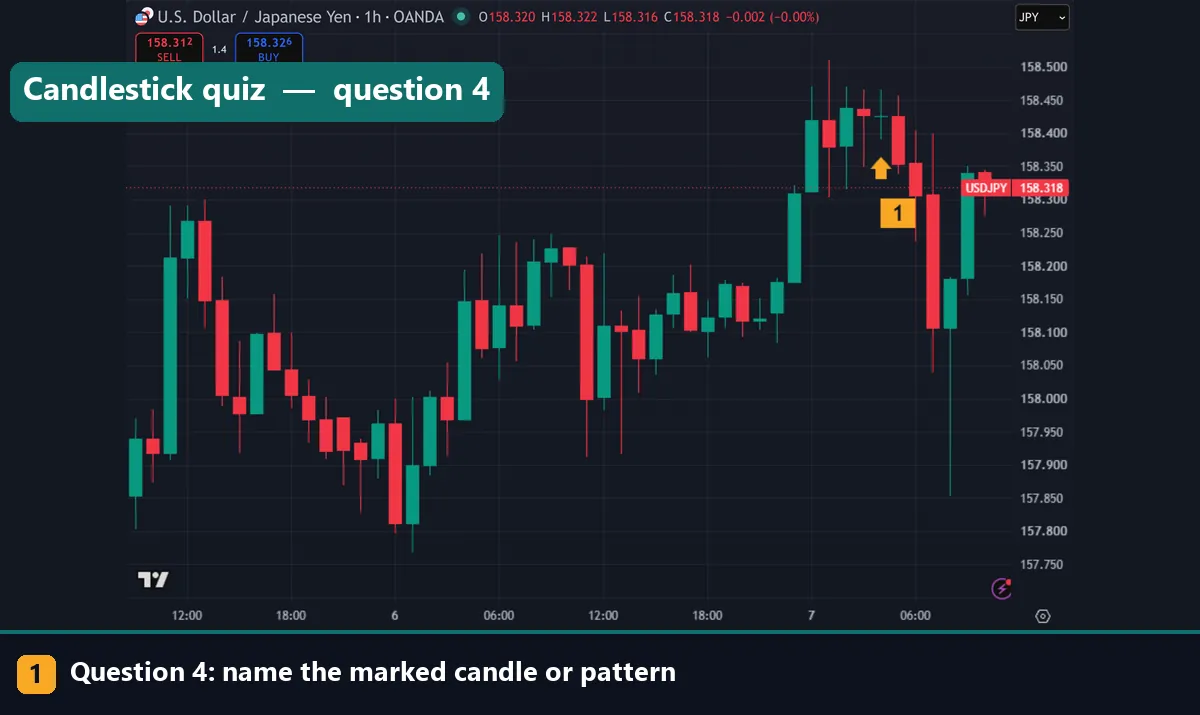
The marker sits under the USDJPY candle from 04:00 UTC on 7 October 2026. What is it?
Show the answer
Doji. It opened at 158.426 and closed at 158.426, so it has no body at all. The range ran from 158.390 to 158.466. In our daily test, dojis scored 52.3% follow-through over 3,824 cases, close to the 51.6% base rate. On this chart, the next few hours swung both ways, with a deep drop and a fast recovery.
Question 5: GBPJPY daily
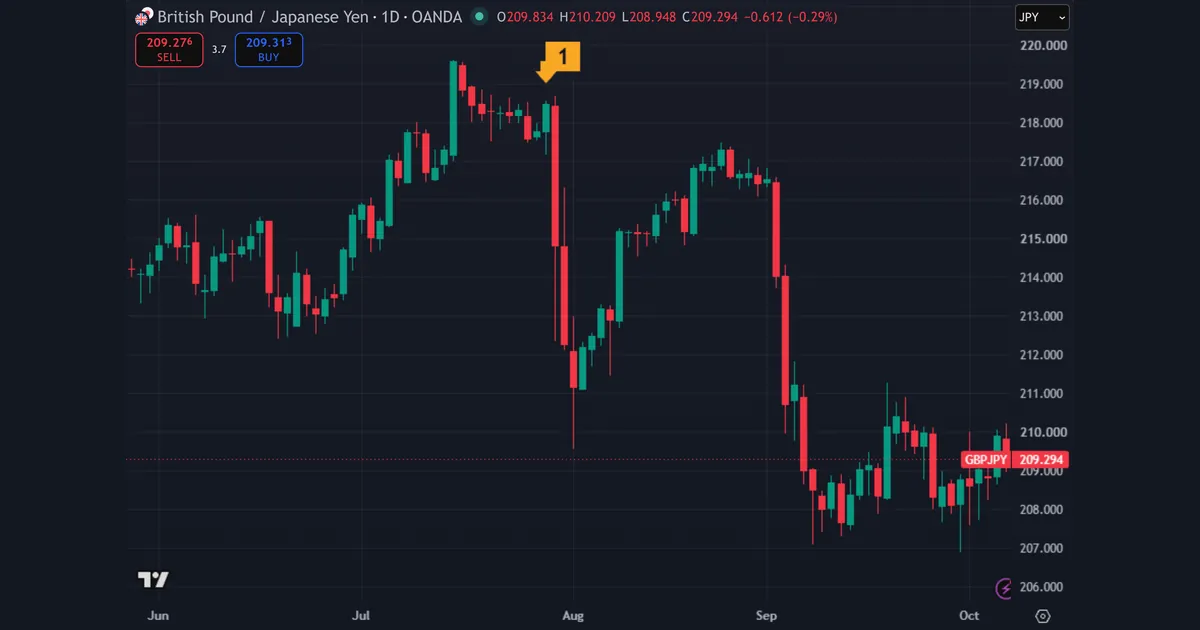
GBPJPY slid through late July 2026. The marker points at the candle from 29 July and the two before it. Name the pattern.
Show the answer
Morning star. A bearish candle came first, then a small-bodied candle, then a bullish candle on 29 July that opened at 217.777 and closed at 218.474. That close sits above the midpoint of the first candle. In our daily test, morning stars followed through 3 days later in 52.0% of 587 cases, against the 51.6% base rate. However, the next candle on this chart is a long bearish one that erased the whole pattern.
So a correct name tells you nothing about the next bar. For more on this shape, see our morning star pattern page.
Download the complete indicator database
Put these concepts on your charts. One email unlocks the full library of 1,380+ indicators with compiled MT4 and MT5 files, plus my TradingView scripts. No paywall, no spam, unsubscribe any time.
Download this quiz free
Enter your email and the file is yours. You also get the full MT4 and MT5 library.
Where this fails
The quiz and the data behind it both have real limits.
- Definitions vary. Books and platforms draw the lines in different places. Our hammer needs a wick of 2x the body, but some sources use 3x.
- The edge is tiny or absent. Most patterns sit within two points of the base rate. Bullish engulfing, shooting star, evening star and bullish marubozu did worse than the base rate in our test.
- No costs. Every figure comes before spread, swap and commission. A two-point edge can vanish once you pay to trade.
- One market, one timeframe. Our statistics cover 23 FX pairs on daily bars. They do not cover gold, stocks or 1-hour charts, and we did not test them out of sample.
- Hindsight. Spotting a pattern on a finished chart is easier than on a live one.
Question 6 and the printable quiz
The last chart question is a two-candle pattern. Compare the highs.
Question 6: AUDUSD daily
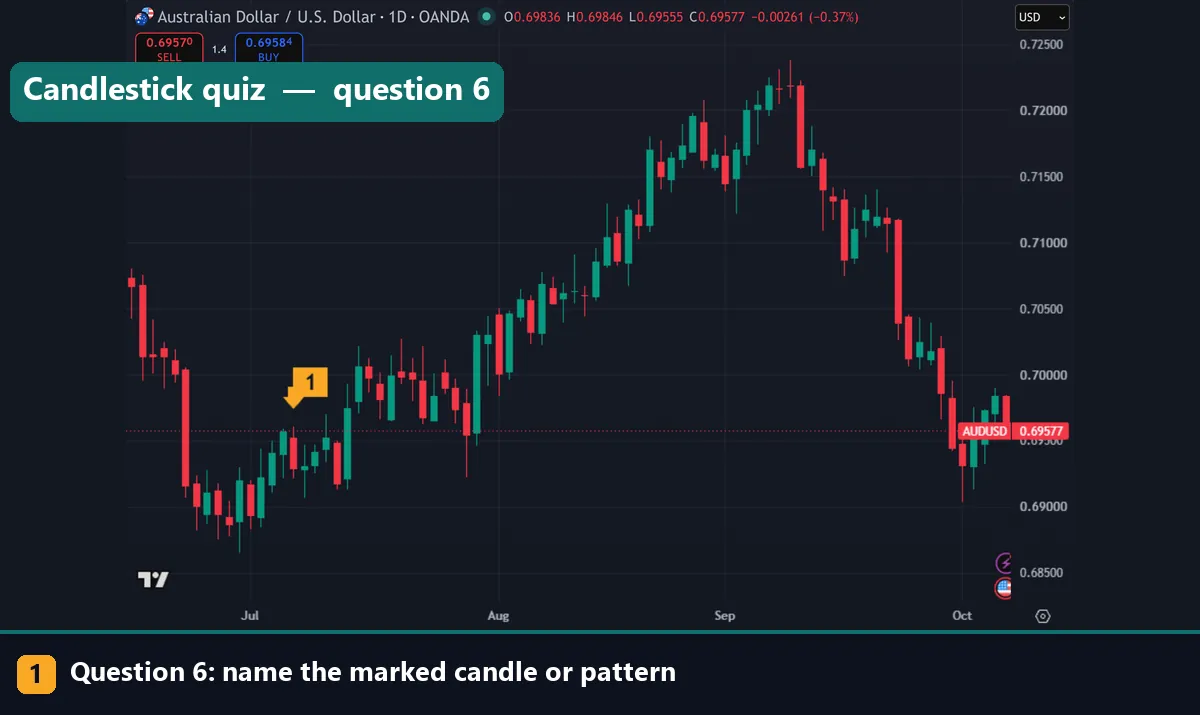
AUDUSD had climbed off its late-June low. The marker points down at the bearish candle from 7 July 2026. Compare it with the candle before it. What is the pattern?
Show the answer
Tweezer top. A bullish candle came first, then a bearish candle with a matching high. The 7 July candle reached 0.69604 and closed at 0.69290. In our daily test, tweezer tops followed through 3 days later in 48.9% of 1,142 cases. The bearish base rate is 48.4%, so the gap is half a point. On this chart, AUDUSD dipped briefly and then climbed above 0.70 later in July.
The free PDF version
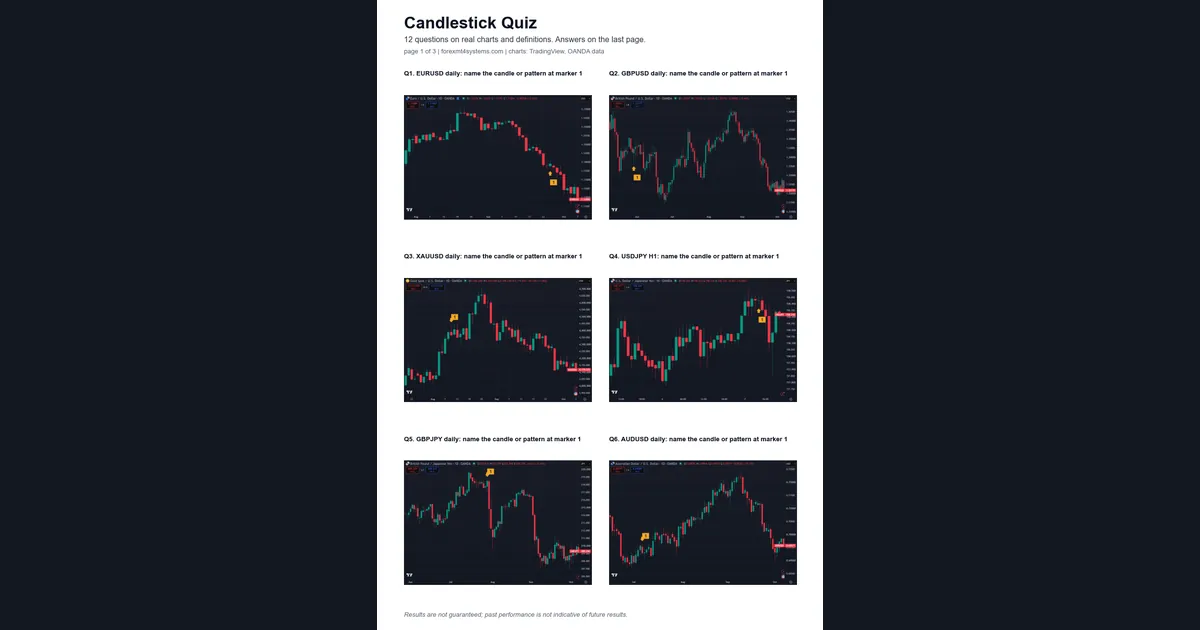
We also built a printable version of this quiz. It has 3 pages: six chart questions, six definition questions and an answer key with our follow-through rates. It is free through the email form on this page.
Six definition questions
These test the rule, not the chart.
Question 7
Which candle has a long upper wick, a small body at the bottom, and comes after a decline?
Show the answer
Inverted hammer. It is a shooting star shape that appears after a decline. We did not measure this pattern separately. Our inverted hammer vs shooting star page explains the difference.
Question 8
What do we call a candle with no wicks at all?
Show the answer
Marubozu. Our test used a looser rule: a bullish body of at least 90% of the range and larger than 0.7 ATR. That version followed through in 48.8% of 669 cases, below the 51.6% base rate. See our marubozu candlestick page for the full shape.
Question 9
A small candle whose body sits completely inside the previous candle’s body is a what?
Show the answer
Harami. We did not measure it in this sample. Our harami candlestick pattern page covers both versions.
Question 10
Which three-candle pattern is the mirror of the morning star?
Show the answer
Evening star. It is a large bullish candle, a small body, then a bearish close below the first candle’s midpoint. In our test it followed through in just 44.5% of 898 cases, under the 48.4% bearish base rate. Our evening star candlestick chart guide has worked charts.
Question 11
A doji whose open and close sit at the low, with a long upper wick, is a what?
Show the answer
Gravestone doji. We did not measure it separately here. Our gravestone candlestick guide goes through it.
Question 12
Two candles with matching lows after a decline form a what?
Show the answer
Tweezer bottom: a bearish candle, then a bullish one, with lows within 0.05 ATR. It scored 53.3% follow-through over 1,102 cases, against a 51.6% base rate. That was our best bullish result, but still a small margin. See tweezer tops and bottoms.
Four common mistakes on a candlestick quiz
These four errors cost the most marks.
- Ignoring the trend before the candle. A hammer, a hanging man and a shooting star can share a shape. Only the bars before them decide the name.
- Judging the candle before it closes. A doji at mid-session can close as a long candle. In short, the pattern only exists once the bar is complete.
- Mixing up wicks and bodies. An engulfing pattern compares bodies, not full ranges. Our candlestick wicks meaning page shows why that matters.
- Treating a name as a signal. Naming a pattern correctly is not the same as knowing what comes next. Our data shows most patterns sit close to the base rate, and our do candlestick patterns work page goes deeper on that point.
Where to go next
If you missed more than three questions, start with the basics. Our Japanese candlestick cheat sheet puts the shapes on one page. Then read the single-pattern pages, such as engulfing candle meaning and doji candle meaning.
If you want a tool to mark patterns for you, our candlestick pattern detector indicator labels them on MT4 and MT5 charts. Still, test your own eye first.
For outside reading, the candlestick charts primer at StockCharts ChartSchool covers the basics. Steve Nison brought these charts to Western traders; see Candlecharts.com by Steve Nison. Also, the candlestick pattern article on Wikipedia lists many more patterns than we tested here.
FAQ: candlestick quiz questions
How many questions are in the candlestick quiz?
There are 12: six chart questions on real TradingView charts and six short definition questions, with the same set in our free 3-page PDF.
Where do the quiz charts come from?
We drew them on the TradingView web chart with OANDA data on 7 October 2026, with one marker on each chart.
What does follow-through mean in the answers?
It is the share of cases where price closed in the pattern’s direction 3 days after the pattern, measured on 23 daily FX pairs from 2018 to 2026.
Which pattern scored best in your data?
Tweezer bottom scored 53.3% and the hammer scored 53.2%, against a 51.6% base rate, so the margins were small in both cases.
Which pattern scored worst?
The evening star followed through in only 44.5% of 898 cases, below the 48.4% bearish base rate.
Do the results include trading costs?
No. Every figure comes before spread, swap and commission, because our MT4 history has no usable spread data.
Can I print the quiz?
Yes. Enter your email in the form on this page and we send the PDF with the chart questions, the definition questions and the answer key.
Should I trade a pattern once I can name it?
Naming a pattern is a reading skill, not a trading plan, and our data showed little edge for most shapes; results are not guaranteed; past performance is not indicative of future results.
Last updated: 7 October 2026.

About the author
Written by Dominic Walsh, a Forex trader and MT4/MT5 indicator, Expert Advisor and script developer. Every tool on forexmt4systems.com is tested on live charts before release and ships with ready-to-use compiled MT4 (.ex4) and MT5 (.ex5) files. Learn more about the trader and developer behind this site.
How we build, test and correct every tool: Editorial & Testing Policy. Trading carries risk; see the disclaimer.