
A diamond bottom is a chart pattern that forms after a fall. Price swings widen for a while and then narrow, so lines across the highs and lows look like a diamond on its side. Chart books call it a bullish reversal. We tested that on eight years of daily forex data, and our 72 daily diamond bottoms broke up and down equally often. This guide settles how to spot one, how to measure it, and what it did on 23 currency pairs.
What a diamond bottom is
A diamond bottom has two halves. First, price makes a higher high and a lower low, so the range widens like a megaphone pattern. Then it makes a lower high and a higher low, so the range shrinks like a symmetrical triangle, one of the triangle pattern types.
The word “bottom” means it needs a decline before it. The same shape after a rally is a diamond top, and we cover it further down.
Inside the pattern, the lowest low sits in the middle. So a diamond bottom often resembles an inverse head and shoulders with a sloped neckline. Likewise, a diamond top can pass for a head and shoulders pattern. The difference is that a diamond’s highs also widen and then narrow.
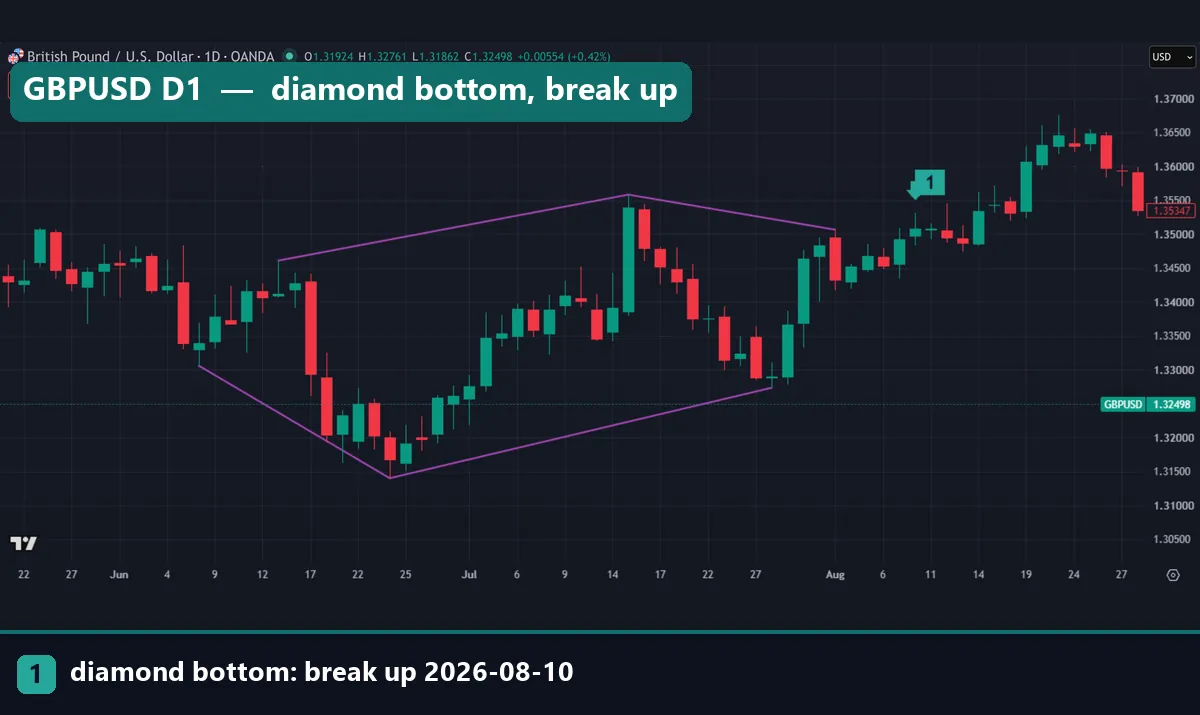
The chart above shows one on GBPUSD daily, from June to August 2026. Our purple lines join the three highs and the three lows. Marker 1 is the first close above the last high, on 10 August.
How the diamond bottom works: lines, break and target
The story goes like this. After a fall, both sides push harder, so the swings grow. Then the swings shrink as one side tires, and a close outside the range is meant to show the winner.
Call the three highs H1, H2 and H3, and the three lows L1, L2 and L3, in time order. Then the test is simple.
shape:  H2 > H1 and H2 > H3   (the middle high is the highest)
        L2 < L1 and L2 < L3   (the middle low is the lowest)
break:  up if a close > H3, down if a close < L3
height: H2 - L2
target: break close + height (up), break close - height (down)
Most books put the break at the sloping line. That fires earlier, but the line moves with whichever wicks you join. A close beyond the last swing comes later, yet everyone gets the same answer, so we used it.
The target is a classic measured move. Thomas Bulkowski uses the same height on his diamond bottoms page at ThePatternSite, then scales it down by how often price reached it in his data. His statistics come from US stocks, not forex.
How we tested the diamond bottom
Patterns drawn by eye are easy to bias, because the winners stick in memory. So every pattern here came from a fixed scan.
For the statistics, we read MetaTrader 4, build 1471, terminal history from Capital Point Trading. That gave us daily bars on 23 forex pairs from 12 June 2018 to 24 August 2026. We also scanned hourly bars of EURUSD, GBPUSD and USDJPY from 22 December 2025, and gold (XAUUSD) from 1 July 2025, up to August 2026.
The chart examples come from the TradingView web chart with OANDA data, shot on 15 October 2026. They cover D1, H1 and M15 charts of GBPUSD, AUDUSD, USDCHF and USDJPY. Every purple line and marker is our measurement.
We placed no trades. Instead, we counted which way price broke and where it closed 10 bars later, before spread, swap and commission. Our method is set out in the editorial testing policy.
We also left volume out. Spot forex is an over-the-counter market, as the BIS Triennial Survey of FX turnover describes it, with no single exchange volume. MT4 and OANDA show tick volume instead, which counts price changes.
Our detection rules and settings
Here is the exact rule set. A different choice would find a different sample, so we print all of it.
| Parameter | Our setting | Why it matters |
|---|---|---|
| Swing point | A high above (or a low below) the 3 bars on each side | Defines the turning points |
| Points | 6 alternating swings, 3 highs and 3 lows, within 90 bars | The fewest that can widen, then narrow |
| Shape | Middle high is the highest, middle low is the lowest | The widen-then-narrow test |
| Prior trend | Close fell (bottom) or rose (top) at least 2 ATR over the 20 bars before the first point | A reversal needs a trend to reverse |
| ATR | 14-bar average true range at the first point | Scales the trend test to volatility |
| Break | First close above the last high or below the last low | Flat levels, no line drawing |
| Break window | 20 bars, counted once the sixth point is confirmed | After that, we call it no break |
| Follow-through | Close 10 bars after the break versus the break close | Did the move keep going? |
Our swing points are a short version of those in our peaks and troughs guide. For the volatility unit, read what ATR means in trading. TradingView’s help page on the Average True Range gives the formula. Its default uses smoothing, while ours is a plain average.
Reading a diamond bottom on a chart
On our charts, purple lines join the highs, then the lows, in time order. Marker 1 is the first close outside: green for up, red for down and purple for none.
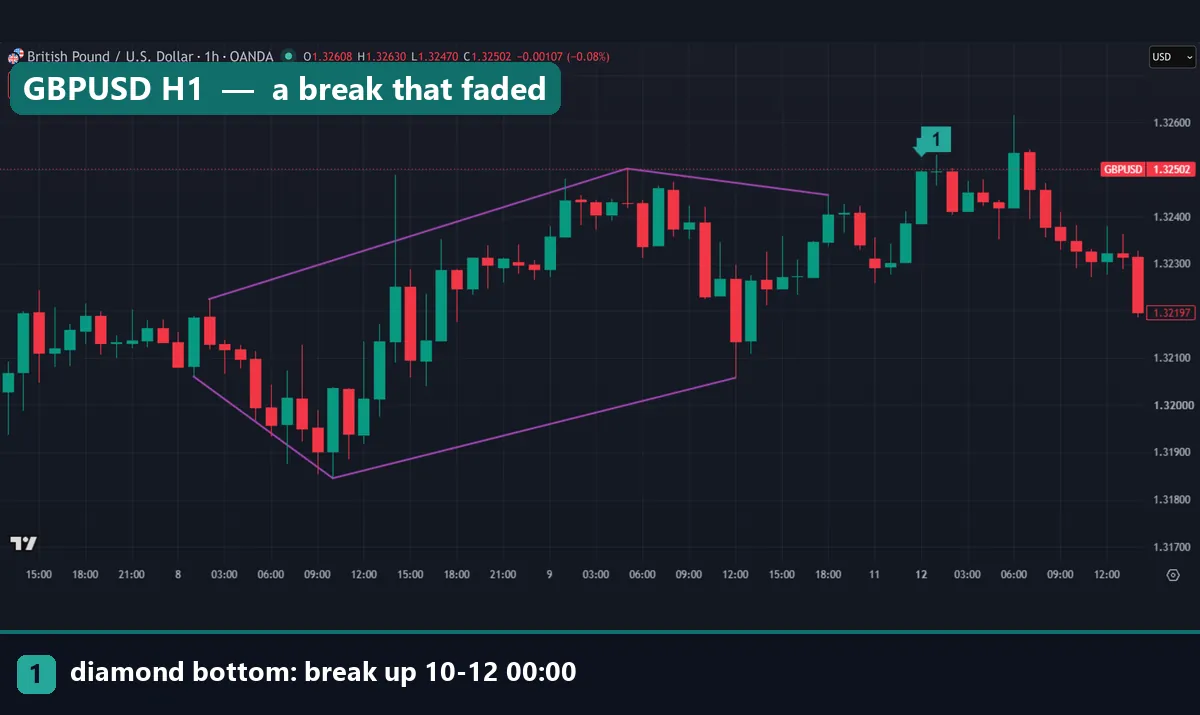
This GBPUSD hourly diamond bottom formed on 8 and 9 October 2026. Its widest swings were a high of 1.32502 and a low of 1.31845, so the height was 65.7 pips. Then a candle closed at 1.32496 at 00:00 UTC on 12 October, above the last high of 1.32446.
Price spiked above 1.32600 at 06:00 UTC. But by 14:00 UTC, where our chart ends, it was back near 1.32200, under the break close.
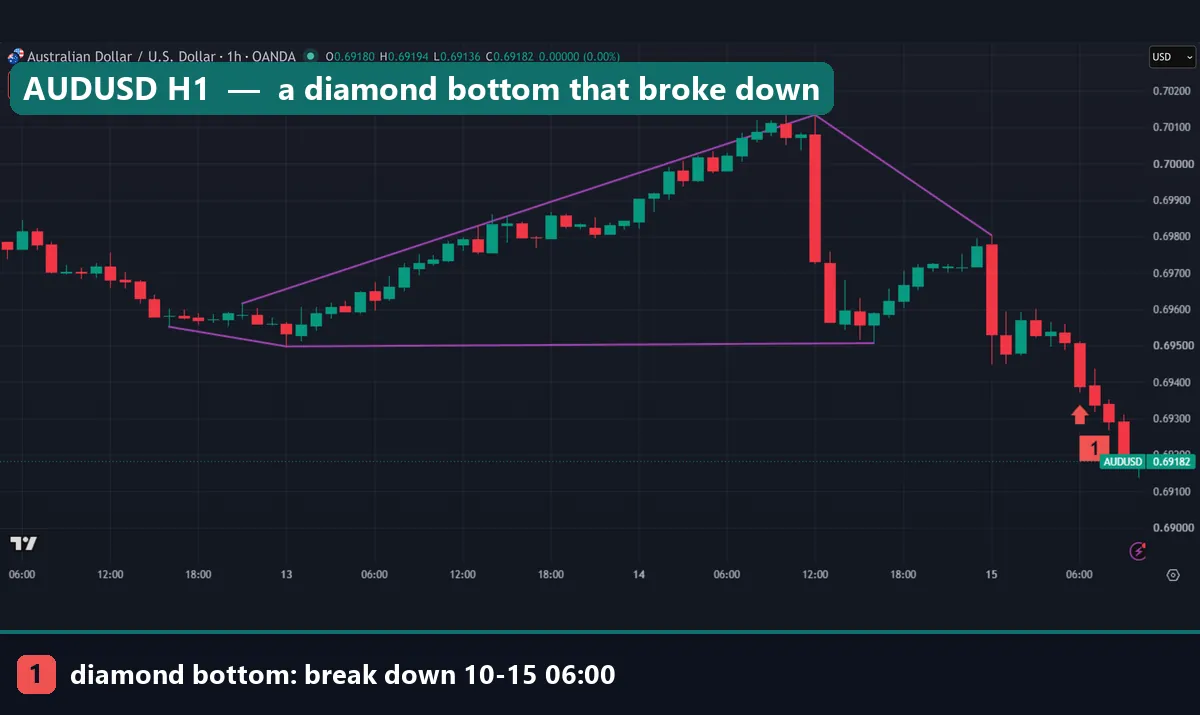
Next, this AUDUSD hourly diamond bottom broke the other way. Its widest swings were 0.70134 and 0.69498. At 06:00 UTC on 15 October, a candle closed at 0.69388, below the last low of 0.69507. After that, price kept falling to about 0.69160.
Notice the floor, though. The second and third lows sit 0.9 pips apart, so the lower line is almost flat. It looks more like a triangle than a diamond, yet it passes the rule.
Worked example: the GBPUSD daily diamond bottom
Here is the GBPUSD daily pattern from the top of the page, using OANDA daily prices.
- Prior fall: at least 2 ATR in the 20 bars before the first point.
- Swings 1 and 2: a low of 1.3306 on 8 June 2026, then a high of 1.3461 on 15 June.
- Swings 3 and 4: a low of 1.31402 on 24 June, then a high of 1.35582 on 15 July. These are the extremes.
- Swings 5 and 6: a low of 1.32735 on 28 July, then a high of 1.35065 on 3 August.
- Height: 1.35582 minus 1.31402 equals 0.04180, or 418 pips.
- Break: a close of 1.35078 on 10 August, 1.3 pips above the last high.
- Target: 1.35078 plus 0.04180 equals 1.39258.
A stop under the last low at 1.32735 sits 234.3 pips below the break close. So the target offers about 1.8 to 1 before costs. Our guide on how to use a stop loss covers that trade-off.
So what happened? Price rose above 1.36500 within two weeks. Then it slid back below 1.35500 by 28 August, where our chart ends, far short of the target. Also, a close 1.3 pips lower would have meant no break that day, so the signal hung on a hair.
What 72 daily diamond bottoms did
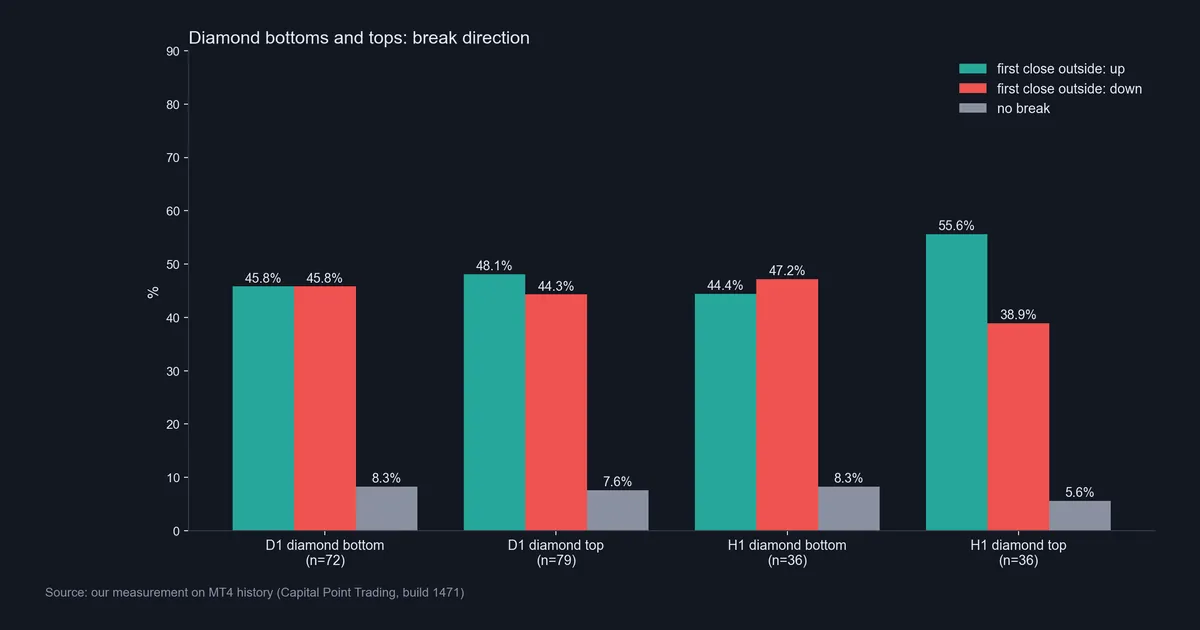
Our scan found 72 diamond bottoms on 23 daily pairs in about eight years. They split evenly: 33 broke up (45.8%) and 33 broke down (45.8%). The other 6 (8.3%) stayed inside for 20 bars. So the prior fall and the shape said nothing about direction.
Diamond tops did no better. Of 79 daily tops, 48.1% broke up and 44.3% broke down, so slightly more went against the textbook. On hourly charts, 36 bottoms broke up 44.4% and down 47.2% of the time, while 36 tops broke up 55.6% and down 38.9%.
Then we checked the close 10 bars after each break. For daily bottoms, 59.1% of breaks moved further in the break direction, with a median move of 0.29 ATR that way. Across all daily bars, the close was higher 10 days later 52.3% of the time. But daily tops managed 46.6%, hourly bottoms 48.5% and hourly tops 41.2%, all with negative medians.
So one group in four beat a coin flip, on 66 breaks. A gap that size on so few cases often comes from chance, as our guide to backtest sample size explains. Bulkowski’s stock data shows mostly upward breaks. Our forex data did not.
A 15-minute diamond bottom on USDCHF
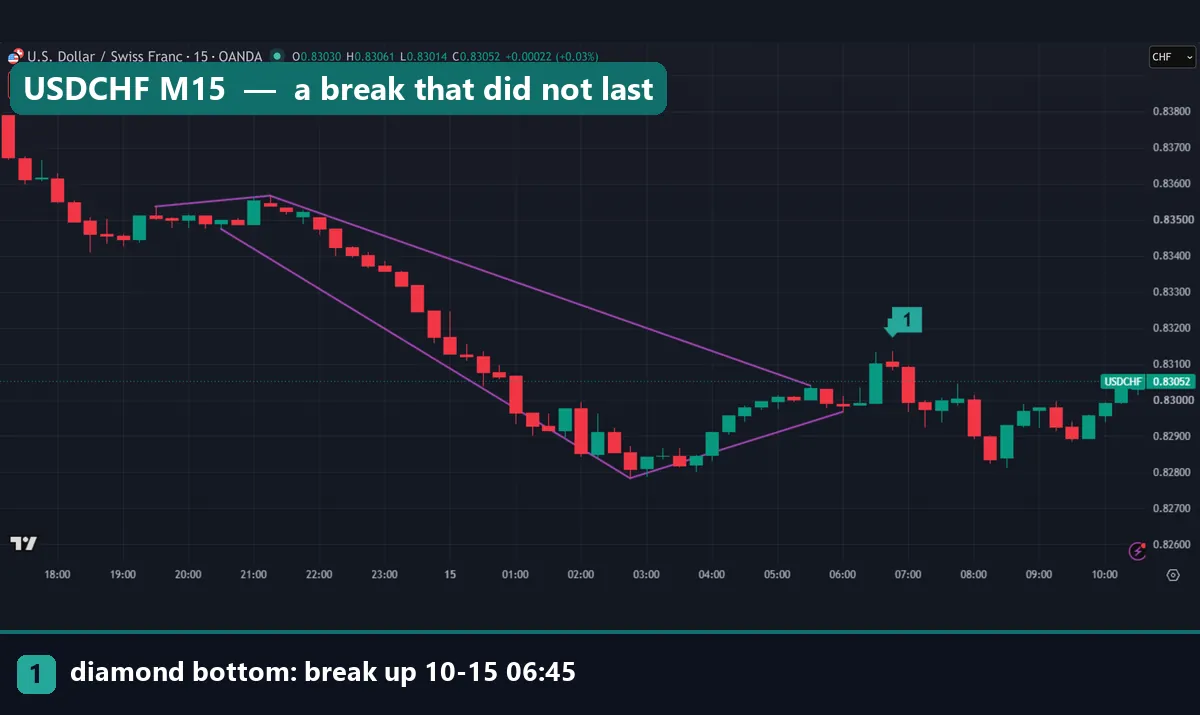
This USDCHF chart applies the same rule to 15-minute bars. Our statistics cover only D1 and H1, so we have no numbers for M15.
Its widest swings were 0.83566 on the evening of 14 October 2026 and 0.82783 at 02:45 UTC on 15 October, a height of 78.3 pips. At 06:45 UTC, a candle closed at 0.83093, above the last high of 0.8304.
However, the break did not last. Within about 90 minutes, price fell back under the last low at 0.82967. The shape is odd too: a nearly flat top line, then a steady slide that ended in a sharp V.
Download the complete indicator database
Put these concepts on your charts. One email unlocks the full library of 1,380+ indicators with compiled MT4 and MT5 files, plus my TradingView scripts. No paywall, no spam, unsubscribe any time.
Get free access to my indicator database
One email unlocks 1,380+ free MT4, MT5 and TradingView indicators — the complete library. No single-tool download; you get the whole database.
Where it fails
The diamond bottom has real weak points, and our data shows most of them.
- No direction edge. Daily bottoms broke up 45.8% and down 45.8% of the time.
- Tops often break up. Daily tops broke up 48.1% of the time, and hourly tops 55.6%.
- Weak follow-through. Only daily bottoms beat a coin flip after 10 bars, on just 66 breaks.
- Rare. We found 72 daily bottoms on 23 pairs in eight years. That is too few to trade as a system.
- A loose shape. Our AUDUSD and USDJPY examples pass the rule but hardly look like diamonds.
- A late break. A close beyond the last swing can come long after the lines cross price.
- No real volume. Tick volume is not traded volume, so the classic volume check cannot work.
- Costs. Every figure is before spread, swap and commission. See our guide to backtesting transaction costs.
In short, the shape looks like a story with an ending, but on our data it was a pause with two exits. Our guide to chart pattern failure covers the wider problem.
The diamond top: the mirror image
A diamond top is the same shape after a rally, and the textbook expects a close below the last low.
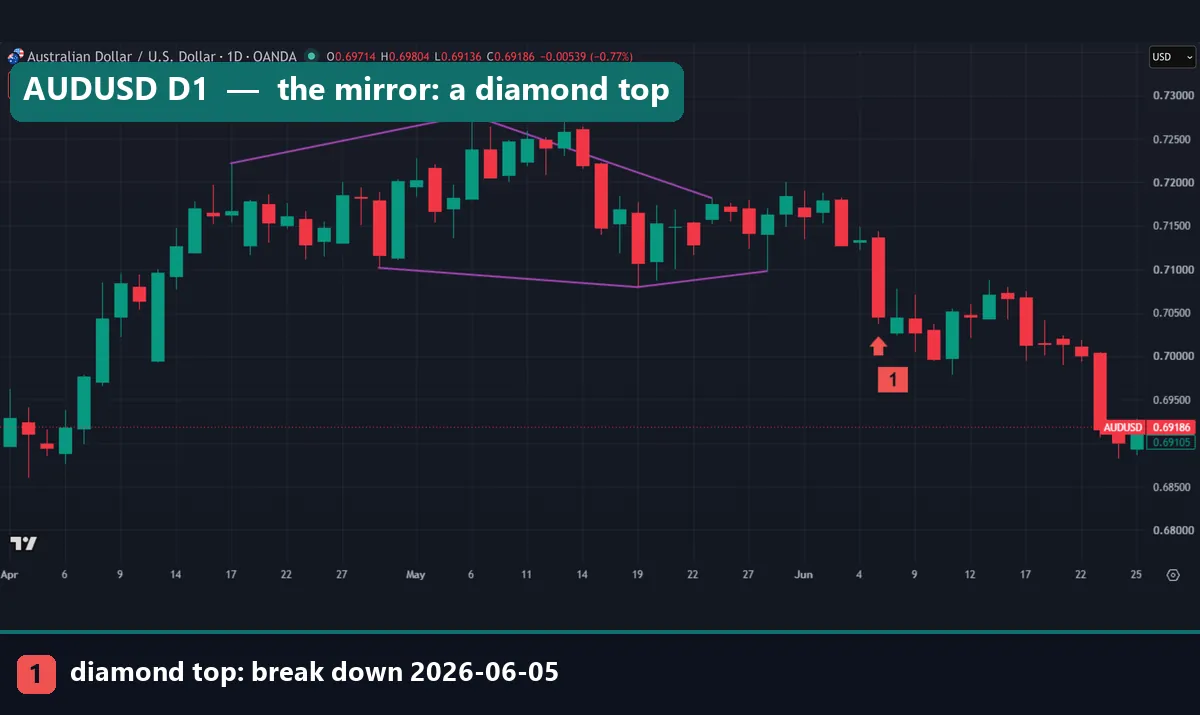
This AUDUSD daily top formed in April and May 2026. The extremes were a high of 0.72777 and a low of 0.70796, a height of 198.1 pips. On 5 June, a candle closed at 0.70452, below the last low of 0.70979, so the target sat at 0.68471. Price stayed under the last low, but it had not reached the target by 25 June, where our chart ends.
Here is the odd part. The same three lows appear in our triple bottom chart pattern guide, as a triple bottom that never broke its neckline. One set of swings gave two names and two opposite stories.
A diamond bottom that never broke
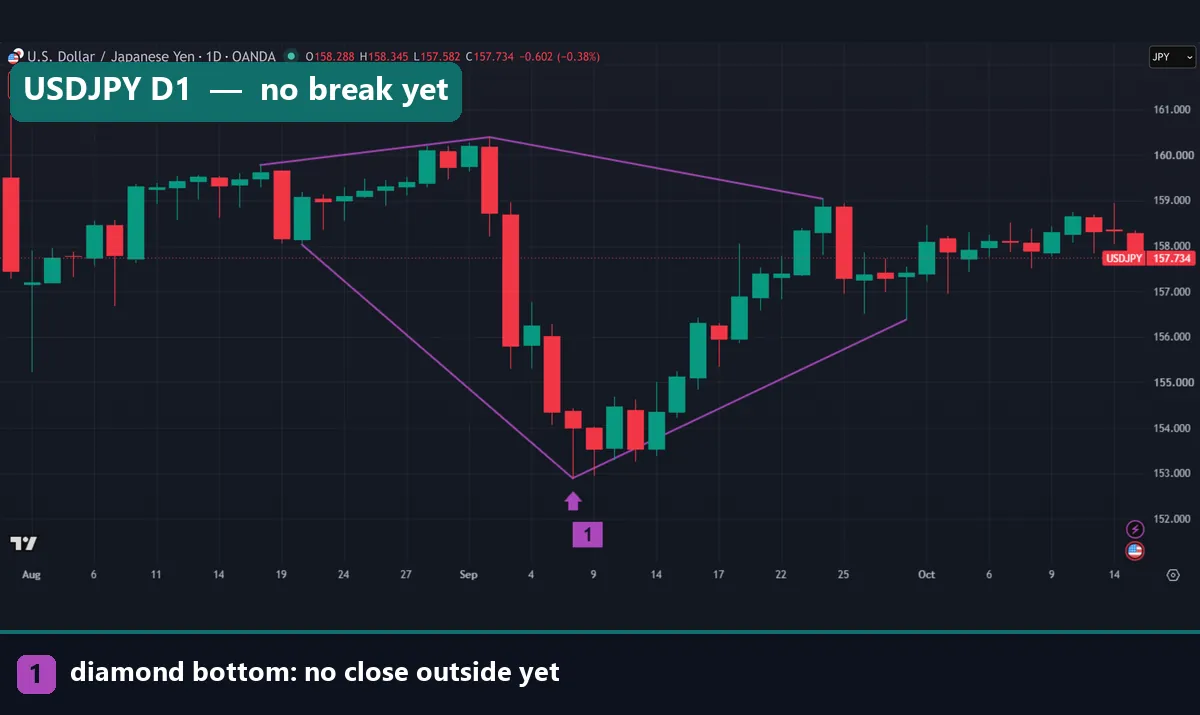
This USDJPY daily diamond bottom formed from 18 August to 30 September 2026. Its lows were 158.029, 152.888 and 156.375, and its highs 159.78, 160.394 and 159.037. Marker 1 sits under the deep 8 September low.
It is badly lopsided. In the widening half, the upper line rose 61.4 pips, while the lower line fell 514.1 pips. So this is really a drop and a recovery under a flat top.
By 15 October, no daily close had cleared 159.037 or 156.375. The marker says there was no close outside yet. Only about two weeks had passed when we took the shot, so the 20-bar window had not run out. In our daily sample, 8.3% of bottoms never broke within 20 bars.
Common mistakes with the diamond bottom
- Assuming it means up. Our daily bottoms broke down as often as up. Wait for a close outside the pattern.
- Treating a wick as a break. We counted closes only. Our break and retest strategy test shows how often first breaks fail.
- Forcing the shape. A V or a flat-floored triangle can pass a loose rule. If the halves are badly uneven, the label adds little.
- Trusting the full target. The height is the widest swing, so the target sits far away. Size the trade to the stop instead.
Where to go next
Our ZigZag formula guide shows how a swing filter picks turning points. For a simpler reversal shape, read the double bottom pattern guide.
For outside reading, the diamond top formation entry at Investopedia gives the textbook view of the mirror pattern. Bulkowski’s page, TradingView’s ATR page and the BIS survey, all linked above, cover the measure rule, the volatility unit and forex volume.
FAQ about the diamond bottom
Is a diamond bottom bullish?
Chart books say yes, but our data says the direction is open. Of 72 daily diamond bottoms on 23 forex pairs, 45.8% broke up and 45.8% broke down.
How do you confirm a diamond bottom?
We used a close above the last swing high, or below the last swing low. Many traders use a close through the sloping line instead. That comes sooner, but it depends on how you draw.
How do you calculate the diamond bottom target?
Subtract the lowest low from the highest high. Then add that height to the break close, or subtract it for a down break. In our GBPUSD daily example, 1.35078 plus 0.04180 gave 1.39258.
What is the difference between a diamond bottom and a diamond top?
Only the trend before it. A bottom follows a fall, and a top follows a rise. Our daily tops broke up 48.1% of the time and down 44.3%, so neither name predicted the side.
Is a diamond bottom the same as an inverse head and shoulders?
No, but they overlap. Both have the deepest low in the middle. A diamond also needs the highs to widen and then narrow, and some charts fit both labels.
How common is the diamond pattern?
Not very. Our scan found 72 daily bottoms and 79 daily tops on 23 pairs from June 2018 to August 2026. On hourly charts of four symbols, it found 36 of each.
Does volume confirm a diamond bottom in forex?
Not in the classic sense. Spot forex trades over the counter, so MT4 and OANDA show tick volume, which counts price changes. We left volume out of our test.
What timeframe works best for a diamond bottom?
We measured D1 and H1 only, and neither showed a direction edge. Daily bottoms had the best 10-bar follow-through, at 59.1% of breaks, but on just 66 cases. All figures are before costs; results are not guaranteed; past performance is not indicative of future results.
Last updated: 15 October 2026.

About the author
Written by Dominic Walsh, a Forex trader and MT4/MT5 indicator, Expert Advisor and script developer. Every tool on forexmt4systems.com is tested on live charts before release and ships with ready-to-use compiled MT4 (.ex4) and MT5 (.ex5) files. Learn more about the trader and developer behind this site.
How we build, test and correct every tool: Editorial & Testing Policy. Trading carries risk; see the disclaimer.